Image Capture | Image Registration Software | QuPath software | HALO® image analysis platform
Image Capture
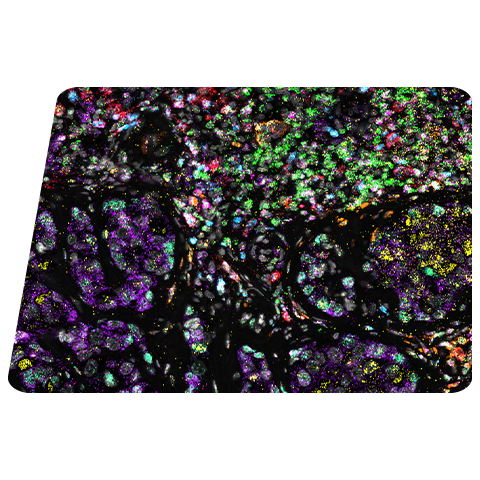
Chromogenic and fluorescent RNAscope™ assays result in signals where RNA target signals are represented as punctate dots. These signals can be captured by common slide imaging equipment with the following recommendations.
Chromogenic Imaging Recommendations
For chromogenic assays, any standard brightfield microscope or digital slide scanners can be used to acquire images at 20x or 40x magnification (recommended).
Fluorescent Imaging Recommendations
Instrumentation Recommendations | ||
Microscopes/Slide Scanners | Optics | Image Capture |
•Leica DM series •Zeiss Axio Imager •Inverted microscope is acceptable if optics and condenser meet requirements •Akoya PhenoImager
| •20X (N.A. 0.75) air •40X (N.A. 0.8) air (recommended) •40X (N.A 1.3) oil •63X (N.A 1.3) oil—for targets with low expression, if needed
It is recommended that targets with high expression be imaged with 20X and those with low expression be imaged with 40X. | •Multispectrum microscope/camera system (e.g. PhenoImager, Nuance EX, Mantra, and Vectra) recommended for imaging tissue with high autofluorescence •For optimal fluorescence detection, we recommend using a high resolution and high sensitivity cooled CCD camera with a 64um pixel size or smaller with a >65% peak quantum efficiency •Common models include: Hamamatsu Orca-Flash 4.0 and Perkin Elmer Nuance EX |
Fluorescent Optical Filter RecommendationsFor assay-specific recommendations, see the assay’s product page for additional recommendations. | |||||
Fluorophore | Ex Max (nm) | Em Max (nm) | Example Filter Set (Ex/Em) | Ex Filter (nm) | Em Filter (nm) |
| AlexaFluor 488 | 499 | 520 | FITC/FITC | 485/20 | 530/30 |
| Atto 550 | 553 | 576 | TRITC/TRITC | 535/36 | 590/34 |
| Atto 647 | 643 | 670 | Cy 5/Cy 5 | 645/30 | 660/40 |
| Cy 2/FITC | 492 | 507 | FITC/FITC | 485/20 | 530/30 |
| Cy 3 | 554 | 566 | TRITC/TRITC | 535/36 | 590/34 |
| Cy 5 | 649 | 666 | Cy 5/Cy 5 | 645/30 | 660/40 |
| Opal 520 | 494 | 525 | FITC/FITC | 485/20 | 530/30 |
| Opal 540 | 523 | 536 | TRITC/FITC | 535/36 | 530/30 |
| Opal 570 | 550 | 570 | TRITC/TRITC | 535/36 | 590/34 |
| Opal 620 | 588 | 616 | TXRED/TXRED | 560/40 | 610/40 |
| Opal 650 | 627 | 650 | Cy 5/Cy 5 | 645/30 | 660/40 |
| Opal 670 | 650 | 670 | Cy 5/Cy 5 | 645/30 | 660/40 |
| Opal 690 | 676 | 694 | Cy 5.5/Cy 5.5 | 655/40 | 716/40 |
| Opal 780 | 750 | 770 | Cy 7/Cy 7 | 708/75 | 809/81 |
Image Registration Software
RNAscope™ HiPlex Image Registration Software has been developed in-house to allow processing of images produced from the RNAscope HiPlex Assay. The software allows the registering, merging, background removal and visualization of up to 12 fluorescent images simultaneously of focal region images. Additionally, v 2.1 supports the registering, merging and background removal of whole slide images.
Minimum System Requirements
•Processor: Intel Core i5 or better
•RAM: 16 GB or greater
•Windows versions: Windows operating system versions 10 or 11
•Mac versions: MacOS operating system versions 11, 12, or 13
QuPath Software
QuPath is an open-source software that provides automated quantitative and semi-quantitative analysis of whole slide images. By using the built-in algorithms, QuPath offers a complete workflow for spatial RNA analysis - starting from color deconvolution, through stages of cell detection, subcellular probe identification and classification, and finally to cell-by-cell RNA quantification.
QuPath Features:
- Free open-source platform*
- Analysis of Single, Duplex, Multiplex, or Higher Plexing experiments
- Detection of individual and clustered RNA dots
- Subcellular dot-count-based and optical-density-based quantification
- Visualization of classification results
- Tabulated and graphical statistical outputs
- Scriptable workflow for batch processing
Tech Note: Using QuPath to analyze RNAscope™, BaseScope™ and miRNAscope™ images
This Technical note provides a guide to using QuPath for image analysis.
QuPath guidelines provided are For Research Use Only. Not For Use In Diagnostic Procedures.
QuPath is an open-source software that provides automated quantitative and semi-quantitative analysis of whole slide images. Visit QuPath’s website for more information: https://qupath.readthedocs.io/en/latest/.
* Download, use or access of this open-source software is voluntary, at your own risk and governed by QuPath’s terms and conditions. If you choose to download, access or use this open-source software, confirm beforehand that any of these actions comply with your organization’s internet, information security, privacy, technology and other applicable company policies. ACD and its affiliates assume no, and specifically disclaim any and all, liability for any damages associated with such use or access.
HALO® Image Analysis Platform
ACD has partnered with Indica Labs to offer quantitative RNAscope image analysis using the HALO software platform. This advanced digital pathology image analysis solution brings objective and accurate quantification to RNA in situ hybridization, enabling a new generation of applications based on single-cell analysis. With the ISH, ISH-IHC, FISH, and FISH-IF modules of the HALO® image analysis platform, pathologists and researchers can perform quantitative gene expression analysis at single-cell resolution and interpret data in the histopathological context.
RNAscope quantification with HALO provides:
- Quantitative and reproducible RNAscope spot counting
- Single-plex and multiplex ISH quantification
- Brightfield and fluorescent ISH quantification
- Cell-by-cell expression profiles
- Automatic generation of H-scores and histograms
- Rapid whole-slide analysis
- Manual and automatic selection of distinct cell populations
- Proximity Analysis, Nearest Neighbor Analysis, Infiltration Analysis, and Density Heatmap are available with the Spatial Analysis module
We offer Image Analysis as part of our Professional Assay Services. Learn more.
The HALO image analysis platform is also available for purchase and deployment within your organization. For more information contact info@indicalab.com.

