Analysis of Golimumab by Maurice
Introduction
Golimumab targets tumor necrosis factor alpha (TNFα) and has been shown to be effective in the treatment of inflamatorry arthiritis1 and ulcerative colitis2. There is currently one biosimilar in preclincial development3.
Maurice icIEF Method
Carboxypeptidase B (CpB) treatment: Golimumab was diluted to 1.0 mg/mL in water prior to CpB digestion. CpB (1 mg/mL stock solution) was added at a ratio of 1:100 (CpB to sample) and incubated at 37 °C for 20 minutes and then placed on ice. CpB was obtained from Sigma-Aldrich (PN C9584).
Sample preparation: Golimumab was diluted to 0.2 mg/mL in the ampholyte solution.
Ampholyte solution: Pharmalytes 8–10.5 (3%) and 5–8 (1%) containing 3.2 M urea, 5 mM IDA and10 mM arginine.
pI markers: 5.85 and 10.17.
Running conditions: 1 minute at 1500 V, then 8 minutes at 3000 V.
Imaging: Absorbance and fluorescence.
Results
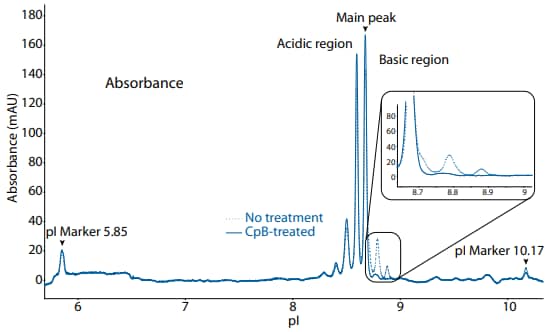
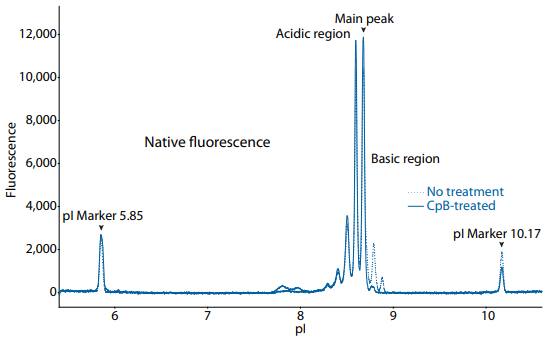
icIEF analysis of golimumab is shown in Figure 1 with absorbance detection and in Figure 2 with fluorescence detection. Treatment with CpB revealed the presence of terminal lysine variants.

Figure 1. icIEF absorbance (top) and peak area percentages (bottom) of golimumab.
| Sample | Acidic Region | Main Peak | Basic Region | Δ Basic Region | |
|---|---|---|---|---|---|
|
Golimumab |
No treatment | 51.6 | 36.9 | 11.5 | N/A |
| CpB-treated | 59.5 | 38.7 | 1.9 | -9.6 | |

Figure 2. icIEF fluorescence (top) and peak area percentages (bottom) of golimumab.
| Sample | Acidic Region | Main Peak | Basic Region | Δ Basic Region | |
|---|---|---|---|---|---|
|
Golimumab |
No treatment | 53.4 | 36.4 | 10.2 | N/A |
| CpB-treated | 61.4 | 37.3 | 1.4 | -8.8 | |
Maurice CE-SDS Method
Sample preparation: Golimumab was diluted to 1 mg/mL with 1X Sample Buffer prior to treatment for 10 minutes at 70 °C in the presence of either 11.5 mM IAM (nonreducing) or 650 nM β-ME (reducing).
Running conditions: Samples were injected for 20 seconds at 4600 V, followed by a 25-minute separation (reducing) or a 35-minute separation (non-reducing) at 5750 V.
Results
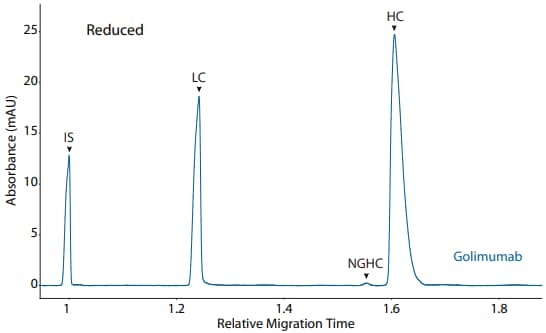
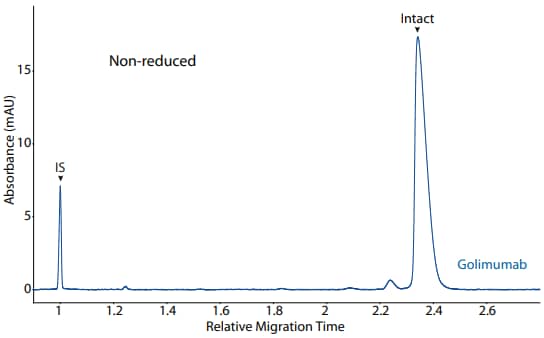
Golimumab was analyzed on the CE-SDS platform method described above under reducing (Figure 3) and nonreducing (Figure 4) conditions, revealing the purity of the sample.

Figure 3. CE-SDS reduced (top) and peak area percentages (bottom) of golimumab. (IS) Internal standard. (LC) Light chain. (NGHC) Nonglycosylated heavy chain. (HC) Heavy chain.
| Sample | Other | NG | Intact |
|---|---|---|---|
| Golimumab | 4.0 | 0.0 | 96.0 |

Figure 4. CE-SDS non-reduced (top) and peak area percentages (bottom) of golimumab. (IS) Internal standard. (NG) Non-glycosylated.
| Sample | LC | NGHC | HC | Other |
|---|---|---|---|---|
| Golimumab | 35.2 | 0.3 | 64.3 | 0.1 |
References
- A review on golimumab in the treatment of psoriatic arthritis, M Urdaneta, H Jethwa, R Sultan and S Abraham, Immunotherapy, 2017; 9(1):871–889.
- Golimumab for the treatment of ulcerative colitis, M Flamant, S Paul and X Roblin, Expert Opinion on Biological Therapy, 2017; 17(7):879–886.
- Biosimilars already approved and in development, T Dörner, J Isaacs, J Gonçalves, V Azevedo, G CastañedaHernández, R Strohal and I McInnes, Considerations in Medicine, 2017; 1:7–12.