Biosimilar Critical Quality Attribute Evaluation on Maurice
Summary
Biopharmaceuticals represent many of the most profitable drugs sold1. These therapeutics currently generate over 100 billion dollars annually in global sales. The expiry of patent protection for many biological medicines presents an attractive opportunity for the development of biosimilars, which are amino-acid-copy drugs intended to offer comparable safety and efficacy to the offpatent innovator biologics. The approval of a biosimilar requires several criteria to be met, one of which is the demonstration of comparability with the innovator molecule through various analytical techniques2.
These techniques are key to showing that biosimilars have no significant differences with the innovator in terms of quality, efficacy and safety. The complex nature of large biologics demands sensitive, quantitative and robust analytical techniques to ensure critical quality attributes (CQAs) meet the requirements mandated by global regulatory authorities. Imaged capillary isoelectric focusing (icIEF) is used extensively for examining CQAs of charge variants3. Obtaining matching icIEF data between the innovator and biosimilar is one way that similarity is demonstrated for a biosimilar2.
To facilitate rapid, accurate comparisons to innovator molecules, ProteinSimple has developed a robust icIEF platform method for the charge heterogeneity analysis of a wide variety of biosimilars. This method was developed on the next-generation capillary electrophoresis system, Maurice™, which combines both icIEF and CE-SDS detection schemes in one fully automated system for protein profiling by either size or charge separation methods. The icIEF method robustness was confirmed by design of experiments (DOE) using a central composite design (CCD). In addition, the innovator and cognate biosimilar molecules were evaluated by Maurice’s CE-SDS mode using platform methods.
Workflow
Materials
ProteinSimple - A Bio-Techne brand
- Instrument: Maurice
- Maurice cIEF Method Development Kit (PN PS-MDK01-C)
- Maurice CE-SDS Application Kit (PN PS-MAK02-S)
- Maurice CE-SDS Cartidges (PN PS-MC02-S)
- Maurice cIEF Cartridges (PN PS-MC02-C)
Other reagents
- Carboxypeptidase B (Sigma-Aldrich, PN C9584)
- b-mercaptoethanol (b-ME, Sigma-Aldrich, M6250)
- Iodoacetamide (IAM, Sigma-Aldrich, A3221)
Samples
- Innovator and biosimilar therapeutic mAbs
Platform Methods
icIEF
- Create an ampholyte mix consisting of 4% Pharmalytes (3% 8–10.5 and 1% 5–8), 3.2 M urea, 5 mM IDA,10 mM arginine, and pI markers 5.85 and 10.17. The recipe in Table 1 will make 1 mL of ampholyte mix.
- Carboxypeptidase B (CpB), which removes terminal lysine residues, can be added before icIEF analysis to identify lysine variants in comparison with an untreated control4. To create CpB-treated samples, reconstitute CpB in water to a concentration of 1 mg/mL. Add CpB at a ratio of 1:100 (CpB to sample). In the examples below, samples were diluted to 1.0 mg/mL in water prior to CpB digestion. Incubate at 37 °C for 20 minutes and then place on ice.
- Dilute samples to a final concentration of 0.2 mg/mL in the ampholyte mix. Run samples for 1 minute at 1500 V, and then 8 minutes at 3000 V.
| 1% MC | Pharmalytes | 8 M Urea | 200 mM IDA | 500 mM Arginine | pI 5.85 | pI 10.17 | Water | |
|---|---|---|---|---|---|---|---|---|
| 5-8 | 8-10.5 | |||||||
| 350 µL | 12.5 µL | 37.5 µL | 500 µL | 31.3 µL | 12.5 µL | 4 µL | 4 µL | 48 µL |
Table 1. Recipe to create 1 mL of the icIEF ampholyte mixture. (MC) Methyl cellulose. (IDA) Iminodiacetic acid.
CE-SDS
1. Dilute samples to 1.0 mg/mL with 1X Sample Buffer.
2. Treat samples for 10 minutes at 70 °C in the presence of either 11.5 mM IAM (non-reducing) or 650 mM b-ME (reducing).
3. Inject samples for 20 seconds at 4600 V, followed by either a 25-minute separation for reduced samples or 35-minute separation for non-reduced samples at 5750 V.
Results
icIEF METHOD ROBUSTNESS
To determine the robustness of the icIEF platform method, a multivariate test of method conditions was conducted. A design of experiments (DOE) was developed and analyzed with JMP® software using a central composite design (CCD). The three variables chosen for this analysis are focus time, basic ampholyte concentration, and cathodic blocker concentration (Table 2). These variables were chosen because they are known to have the greatest overall effect from previous studies, DOE analysis, and troubleshooting experience.
| CCD DOE | Focus Time (Minutes) | Pharmalyte 8-10.5 (%) | Arginine (mM) |
|---|---|---|---|
| Axial High | 9.29 | 4.29 | 15.14 |
| High | 9 | 4 | 14 |
| Center | 8 | 3 | 10 |
| Low | 7 | 2 | 6 |
| Axial Low | 6.71 | 1.71 | 4.86 |
Table 2. Central composite design (CCD) to test the robustness of the icIEF platform method.
Two mAbs with non-overlapping isoelectric points and separation patterns, infliximab and rituximab, were mixed together and tested under each condition. Even at the extremes of all three parameters, the focusing pattern of the mAbs are similar to that at the target condition (Figure 1).
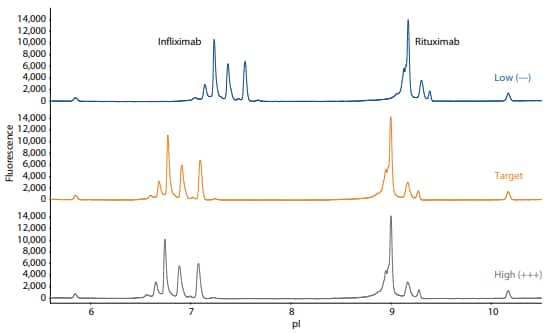
Figure 1. Electropherograms resulting from the icIEF platform method applied to a mixture of infliximab and rituximab at the low (–––), target, and high (+++) values of the three critical method parameters of focus time, basic ampholyte concentration, and cathodic blocker concentration.
Surface response analysis shows that the percent main peak (%MP) does not vary significantly in response to the variation of these parameters (Figure 2).
To provide assurance that the upper and lower pI markers are retained, the 17 DOE runs were repeated twice. Under no circumstance did the pI markers move outside the window of detection (Figure 3). Taken together, these results show that the method is robust and reproducible for the analysis of different therapeutic monoclonal antibodies.
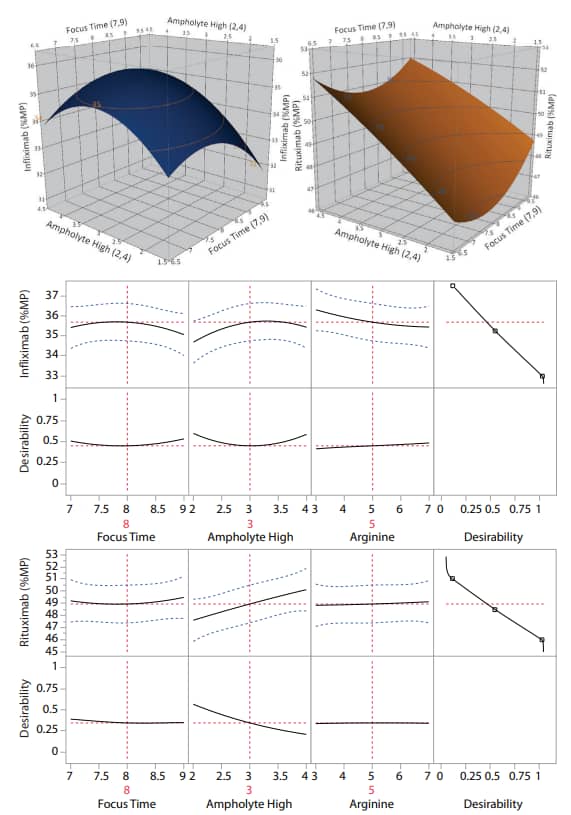
Figure 2. Robustness of the icIEF platform method. The percent main peak (%MP) of infliximab and rituximab are stable despite significant changes to critical method parameters. The samples in this analysis were not CpB-treated.
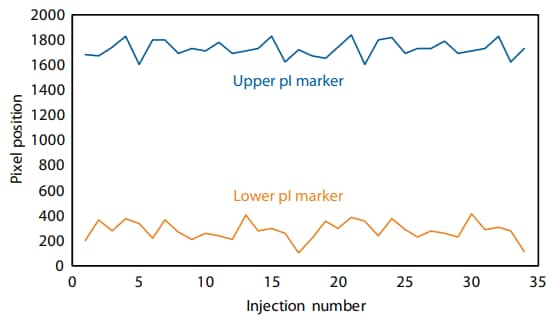
Figure 3. The lower and upper pI markers are retained throughout two consecutive repeats of the DOE (34 injections total). Pixels 0–2000 correspond to a window of detection between approximately pI 5–11 using this method.
Adalimumab (Humira®)
Adalimumab (trade name Humira®) is a biological drug used to treat rheumatoid arthritis, Crohn’s disease and psoriasis. Adalimumab reduces inflammatory responses by inhibiting TNFα binding to its receptor. It was the best selling biopharmaceutical until its patent expired in 2016, reaching $16 billion in global sales annually5. Several biosimilars are already on the market.
To compare adalimumab to a biosimilar, we used the icIEF platform method described above to monitor charge heterogeneity by absorbance (Figure 4) and by native fluorescence (Figure 5) detection.
These analyses revealed that the innovator and biosimilar are similar in charge heterogeneity and purity. To evaluate the presence of lysine variants, the antibodies were treated with CpB before analysis on icIEF. Treatment with CpB had a more dramatic effect on the basic region of the biosimilar than on the innovator molecule (Figure 4, 5), indicating that the biosimilar may have more terminallysine-containing variants in the final sample preparation.
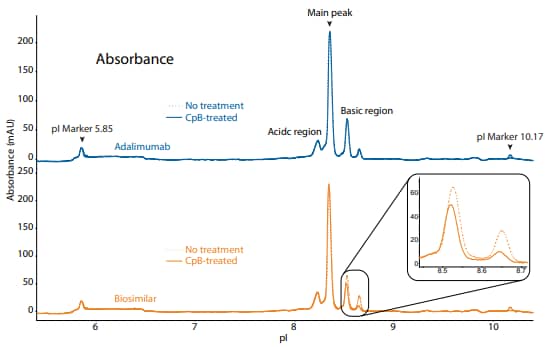
Figure 4. icIEF absorbance (top) and peak integrations (bottom) of adalimumab and a biosimilar. All numbers represent percent peak area.
| Sample | Acidic Region | Main Peak | Basic Region | Δ Basic Region | |
|---|---|---|---|---|---|
|
Adalimumab |
No treatment | 17.9 | 58.9 | 23.1 | N/A |
| CpB-treated | 20.8 | 57.6 | 21.5 | -1.6 | |
|
Biosimilar |
No treatment | 19.7 | 56.0 | 24.3 | N/A |
| CpB-treated | 24.0 | 59.0 | 17.0 | -7.3 | |
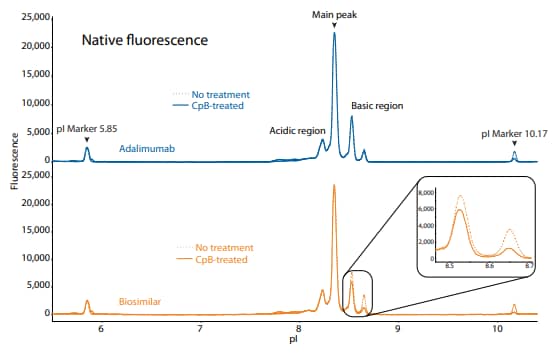
Figure 5. icIEF fluorescence (top) and peak integrations (bottom) of adalimumab and a biosimilar. All numbers represent percent peak area.
| Sample | Acidic Region | Main Peak | Basic Region | Δ Basic Region | |
|---|---|---|---|---|---|
|
Adalimumab |
No treatment | 16.4 | 63.8 | 19.8 | N/A |
| CpB-treated | 16.2 | 61.6 | 22.2 | 2.4 | |
|
Biosimilar |
No treatment | 16.8 | 58.8 | 24.4 | N/A |
| CpB-treated | 17.9 | 64.5 | 17.6 | -6.8 | |
Adalimumab and its biosimilar were also analyzed on the CE-SDS platform method described above under reduced (Figure 6) and non-reduced (Figure 7) conditions, resulting in comparable purity.
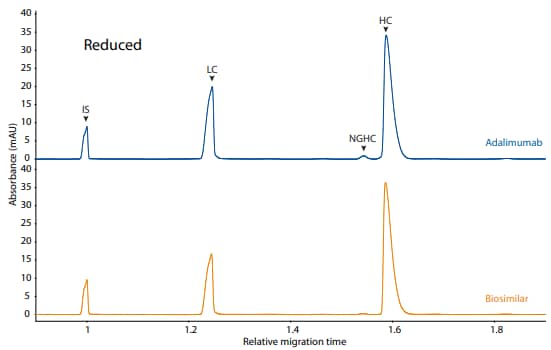
Figure 6. CE-SDS reduced (top) and peak integrations (bottom) of adalimumab and a biosimilar. (IS) Internal standard. (LC) Light chain. (NGHC) Non-glycosylated heavy chain. (HC) Heavy chain. All numbers represent percent peak area
| Sample | LC | NGHC | HC | Other |
|---|---|---|---|---|
| Adalimumab | 30.3 | 0.3 | 68.5 | 0.9 |
| Biosimilar | 31.5 | 1.9 | 66.1 | 0.5 |
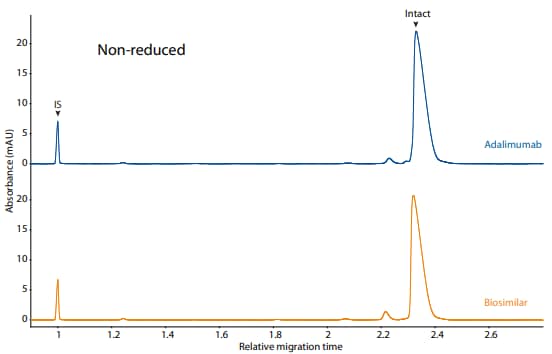
Figure 7. CE-SDS non-reduced (top) and peak integrations (bottom) of adalimumab and a biosimilar. (IS) Internal standard. (NG) Nonglycosylated. All numbers represent percent peak area.
| Sample | Other | NG | Intact |
|---|---|---|---|
| Adalimumab | 3.7 | 0.0 | 96.4 |
| Biosimilar | 5.5 | 0.0 | 94.5 |
Rituximab (Rituxan ®)
Rituximab (trade name Rituxan®) is a biological drug used to treat certain cancers and autoimmune diseases. It is one of the earliest antibody based therapies available for cancer treatment (approved in 1997), and is considered an essential medicine by the World Health Organization6.
To compare rituximab to its biosimilars, we used the icIEF platform method described above to monitor charge heterogeneity by absorbance (Figure 8) and by native fluorescence (Figure 9) detection. These analyses revealed that the innovator and biosimilar #1 are similar in charge heterogeneity and purity. Biosimilar #2, however, had a larger peak area percentage in the basic region (Figure 8, 9). To evaluate if this large peak area percentage in the basic region is due to the presence of lysine variants, the antibodies were treated with CpB before analysis on icIEF. Indeed, treatment with CpB had a dramatic effect on the peak area in the basic region of biosimilar #2, resulting in a >17% decrease, while it had very little effect on the basic region of the others (≤2% decrease in peak area). This indicates that biosimlar #2 contains terminal-lysinecontaining variants that are not present in the other samples. Furthermore, it is reasonable to speculate that the two basic peaks in the untreated sample of biosimilar #2 are two different terminal-lysine-containing variants because these two peaks disappear following CpB treatment. Because lysine modification can affect antibody function in vivo7, these variants are important to monitor during antibody process development.
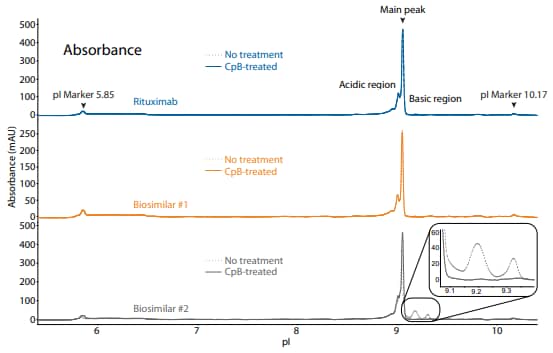
Figure 8. icIEF absorbance (top) and peak integrations (bottom) of rituximab and two biosimilars. All numbers represent percent peak area.
| Sample | Acidic Region | Main Peak | Basic Region | Δ Basic Region | |
|---|---|---|---|---|---|
|
Rituximab |
No treatment | 36.1 | 62.7 | 1.2 | N/A |
| CpB-treated | 37.1 | 62.9 | 0.0 | -1.2 | |
|
Biosimilar #1 |
No treatment | 37.8 | 61.6 | 0.6 | N/A |
| CpB-treated | 38.4 | 61.6 | 0.0 | -0.6 | |
|
Biosimilar #2 |
No treatment | 27.9 | 54.0 | 18.0 | N/A |
| CpB-treated | 35.1 | 64.7 | 0.2 | -17.8 | |
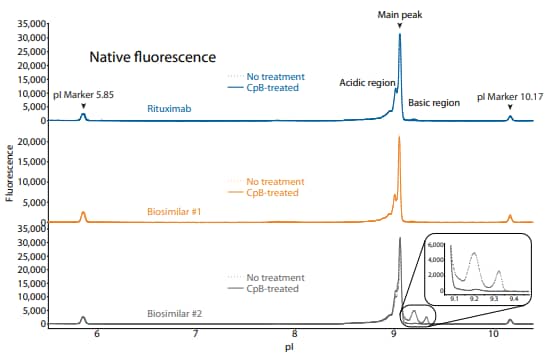
Figure 9. icIEF fluorescence (top) and peak integrations (bottom) of rituximab and two biosimilars. All numbers represent percent peak area.
| Sample | Acidic Region | Main Peak | Basic Region | Δ Basic Region | |
|---|---|---|---|---|---|
|
Rituximab |
No treatment | 43.0 | 54.8 | 2.2 | N/A |
| CpB-treated | 44.5 | 55.3 | 0.2 | -2.0 | |
|
Biosimilar #1 |
No treatment | 41.7 | 56.7 | 1.6 | N/A |
| CpB-treated | 41.6 | 57.9 | 0.5 | -1.1 | |
|
Biosimilar #2 |
No treatment | 31.0 | 50.4 | 18.6 | N/A |
| CpB-treated | 40.5 | 58.8 | 0.7 | -17.9 | |
Rituximab and its biosimilars were also analyzed on the CESDS platform method under reduced (Figure 10) and nonreduced (Figure 11) conditions, resulting in comparable purity.
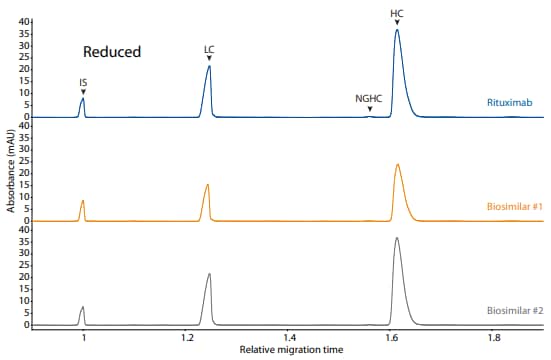
Figure 10. CE-SDS reduced (top) and peak integrations (bottom) of rituximab and two biosimilars. (IS) Internal standard. (LC) Light chain. (NGHC) Non-glycosylated heavy chain. (HC) Heavy chain. All numbers represent percent peak area.
| Sample | LC | NGHC | HC | Other |
|---|---|---|---|---|
| Rituximab | 32.6 | 0.4 | 66.7 | 0.3 |
| Biosimilar #1 | 32.4 | 0.2 | 67.1 | 0.2 |
| Biosimilar #2 | 32.8 | 0.2 | 66.8 | 0.2 |
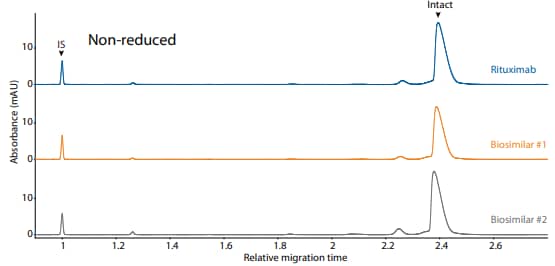
Figure 11. CE-SDS non-reduced (top) and peak integrations (bottom) of rituximab and two biosimilars. (IS) Internal standard. (NG) Nonglycosylated. All numbers represent percent peak area.
| Sample | Other | NG | Intact |
|---|---|---|---|
| Rituximab | 6.3 | 0.0 | 93.6 |
| Biosimilar #1 | 6.3 | 0.0 | 93.8 |
| Biosimilar #2 | 9.7 | 0.0 | 90.2 |
Trastuzumab (Herceptin ®)
Trastuzumab (trade name Herceptin®) is a biological drug used to treat HER2-positive breast cancer, which accounts for 20-30% of all breast cancers8. It is one of the earliest antibody based therapies available for cancer treatment. It was approved by the FDA in September 1998 and the first biosimilar was approved in December 2017.
To compare trastuzumab to its biosimilars, we used the icIEF platform method described above to monitor charge heterogeneity by absorbance (Figure 12) and by native fluorescence (Figure 13) detection. These analyses revealed that the innovator and biosimilars are similar in charge heterogeneity and purity. To evaluate the presence of lysine variants, the antibodies were treated with CpB before analysis on icIEF. Treatment with CpB conferred a relatively small (<2%) decrease in the basic region peak area percentage (Figure 12, 13), suggesting that these samples do no contain a significant amount of terminallysine variants.
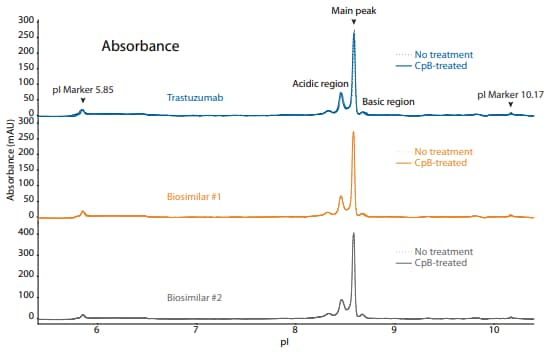
Figure 12. icIEF absorbance (top) and peak integrations (bottom) of trastuzumab and two biosimilars. All numbers represent percent peak area.
| Sample | Acidic Region | Main Peak | Basic Region | Δ Basic Region | |
|---|---|---|---|---|---|
|
Trastuzumab |
No treatment | 35.9 | 59.4 | 4.7 | N/A |
| CpB-treated | 36.7 | 60.0 | 3.3 | -1.4 | |
|
Biosimilar #1 |
No treatment | 35.8 | 59.5 | 4.8 | N/A |
| CpB-treated | 36.3 | 60.2 | 3.5 | -1.3 | |
|
Biosimilar #2 |
No treatment | 36.3 | 58.9 | 4.8 | N/A |
| CpB-treated | 36.2 | 59.1 | 4.7 | -0.1 | |
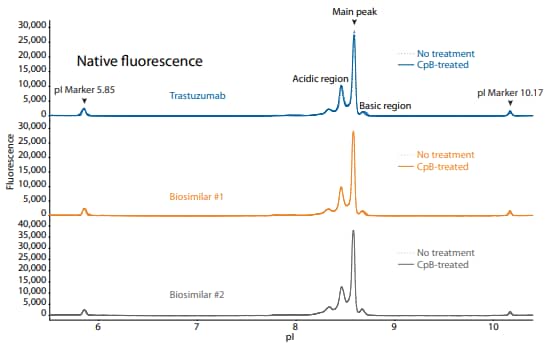
Figure 13. icIEF fluorescence (top) and peak integrations (bottom) of trastuzumab and two biosimilars. All numbers represent percent peak area.
| Sample | Acidic Region | Main Peak | Basic Region | Δ Basic Region | |
|---|---|---|---|---|---|
|
Trastuzumab |
No treatment | 40.8 | 54.6 | 4.6 | N/A |
| CpB-treated | 40.6 | 56.5 | 2.9 | -1.7 | |
|
Biosimilar #1 |
No treatment | 41.5 | 53.6 | 4.9 | N/A |
| CpB-treated | 41.0 | 55.4 | 3.5 | -1.4 | |
|
Biosimilar #2 |
No treatment | 49.5 | 45.7 | 4.9 | N/A |
| CpB-treated | 49.7 | 45.4 | 4.9 | 0.0 | |
Trastuzumab and its biosimilars were also analyzed on the CE-SDS platform method under reduced (Figure 14) and non-reduced (Figure 15) conditions, resulting in comparable purity.
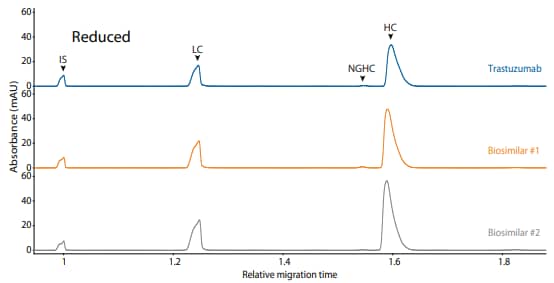
Figure 14. CE-SDS reduced (top) and peak integrations (bottom) of trastuzumab and two biosimilars. (IS) Internal standard. (LC) Light chain. (NGHC) Non-glycosylated heavy chain. (HC) Heavy chain. All numbers represent percent peak area.
| Sample | LC | NGHC | HC | Other |
|---|---|---|---|---|
| Trastuzumab | 29.5 | 0.5 | 69.7 | 0.3 |
| Biosimilar #1 | 29.8 | 0.8 | 69.7 | 0.3 |
| Biosimilar #2 | 30.2 | 0.3 | 69.1 | 0.5 |
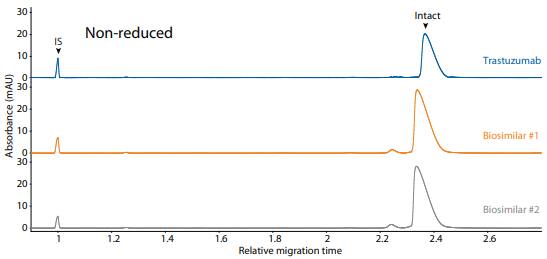
Figure 15. CE-SDS non-reduced (top) and peak integrations (bottom) of trastuzumab and two biosimilars. (IS) Internal standard. (NG) Nonglycosylated. All numbers represent percent peak area.
| Sample | Other | NG | Intact |
|---|---|---|---|
| Trastuzumab | 3.1 | 0.0 | 96.9 |
| Biosimilar #1 | 3.9 | 0.0 | 95.6 |
| Biosimilar #2 | 4.3 | 0.0 | 95.7 |
Summary
Platform methods are beneficial for their ease-of-use, consistency and broad application. Here, we provide icIEF and CE-SDS platform methods to characterize three major commercial therapeutic mAbs and their biosimilars on Maurice. The icIEF platform method developed here is highly robust because multivariate analysis showed that major perturbations to three critical variables in the method did little to change the main peak area percentage and retention of the pI markers, thus these platform methods can be applied to various biosimilars. Taken together, Maurice takes the complexity out of therapeutic protein analysis, making it fast, reliable and versatile.
References
- The therapeutic monoclonal antibody market, D Ecker, S Jones and H Levine, mAbs, 2015; 7(1):9–14.
- Biosimilars: Key regulatory considerations and similarity assessment tools, C Kirchhoff, X Wang, H Conlon, S Anderson, A Ryan and A Bose, Biotechnol Bioeng, 2017; 114(12):2696–2705.
- Imaged capillary isoelectric focusing for charge-variant analysis of biopharmaceuticals, C Felten, O Salas-Solano and D Michels, BioProcess International, 2011; 9(10):48–54.
- Chromatographic analysis of the acidic and basic species of recombinant monoclonal antibodies, Y Du, A Walsh, R Ehrick, W Xu, K May and H Liu, mAbs, 2012; 4(5):578–85.
- New 2016 data and statistics for global pharmaceutical products and projections through 2017, C Lindsley, ACS Chemical Neuroscience, 2017; 8:1635–36.
- Essential medicines for cancer: WHO recommendations and national priorities, J Robertson, R Barr, L Shulman, G Forte and N Magrini, Bulletin of the World Health Organization, 2016; 94:735–42.
- Human IgG is produced in a pro-form that requires clipping of C-terminal lysines for maximal complement activation, E van den Bremer, F Beurskens, M Voorhorst, P Engelberts, R de Jong, B van der Boom, E Cook, M Lindorfer, R Taylor, P van Berkel and P Parren, mAbs, 2015; 7:672–80.
- The HER2 receptor in breast cancer: pathophysiology, clinical use, and new advances in therapy, Z Mitri, T Constantine and R O'Regan, Chemotherapy Research and Practice, 2012; 2012:743193.