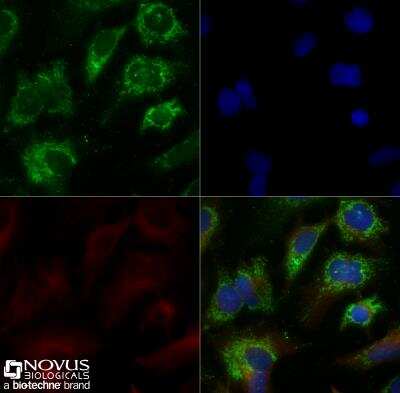
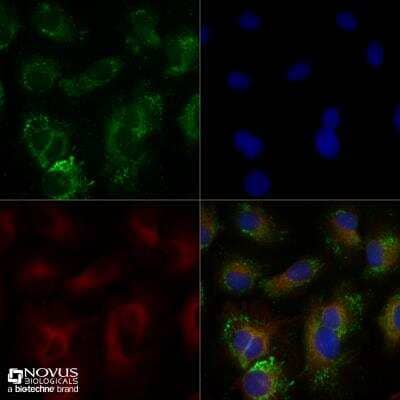
Immunocytochemistry/Immunofluorescence Staining of ABCA1 in HepG2 Cells
HepG2 cells were grown to 60% confluency, serum starved for 24 hours, and then treated with 1uM TO9 for 24 hours prior to being fixed for 10 minutes using 10% formalin and then permeabilized for 5 minutes using 1X TBS + 0.5% Triton-X100. The cells were incubated with anti-ABCA1 at 5.0ug/ml overnight at 4C and detected with an anti-rabbit Dylight 488 (Green) at a 1:500 dilution. Alpha tubulin (DM1A) NB100-690 was used as a co-stain at a 1:1000 dilution and detected with an anti-mouse Dylight 550 (Red) at a 1:500 dilution. Nuclei were counterstained with DAPI (Blue). Cells were imaged using a 40X objective.
Immunocytochemistry/Immunofluorescence Staining of ABCA1 in HepG2 Cells
Untreated HepG2 cells were grown to 60% confluency, and serum starved for 24 hours prior to being fixed for 10 minutes using 10% formalin and then permeabilized for 5 minutes using 1X TBS + 0.5% Triton-X100. The cells were incubated with anti-ABCA1 at 5.0ug/ml overnight at 4C and detected with an anti-rabbit Dylight 488 (Green) at a 1:500 dilution. Alpha tubulin (DM1A) NB100-690 was used as a co-stain at a 1:1000 dilution and detected with an anti-mouse Dylight 550 (Red) at a 1:500 dilution. Nuclei were counterstained with DAPI (Blue). Cells were imaged using a 40X objective.
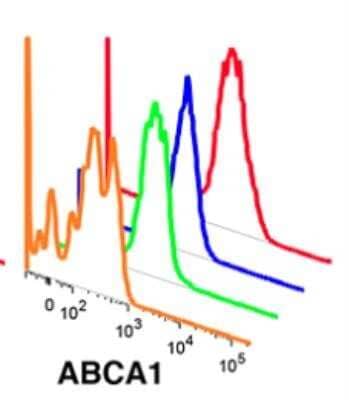
Flow Cytometry Analysis of Human Adipose Tissue Macrophage Subsets Stained with FITC Conjugated ABCA1 Antibody
ABCA-1 FITC conjugated antibody of human adipose tissue macrophage subsets by flow cytometry. Image from verified customer review.
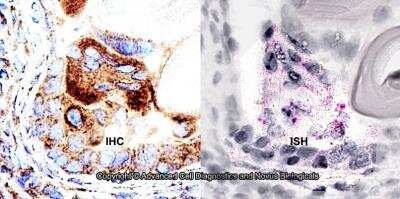
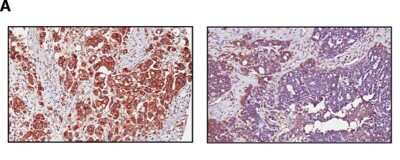
Immunohistochemical Staining of ABCA1 in Paraffin Embedded Ovarian Cancer Tissue
Association between expression of ABCA1 and survival in ovarian cancer patients. Expression of ABCA1 in 55 ovarian cancer patient samples was determined by IHC in tissue microarray. Representative image of ovarian cancer showing high (left panel) and low (right panel) ABCA1 expression on the cell membrane or cytoplasm (x400). Image collected and cropped by CiteAb from the following publication (https://www.clinicalepigeneticsjournal.com/content/7/1/1), licensed under a CC-BY license.
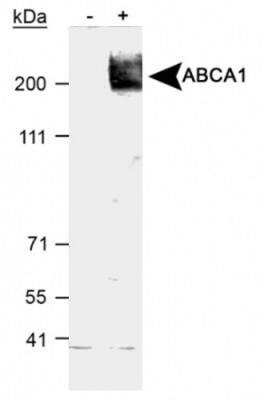
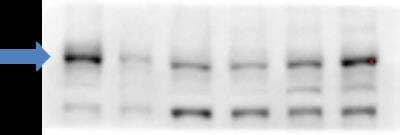
Western Blot Detection of ABCA1 in Human Primary Fibroblasts
ABCA1 in human primary fibroblasts in culture. 10 ug of total protein. 7.5% TGX gel. Blocking 5% milk in PBST 1h RT. 1:1000 primary ab in BSA 3% PBST O/N at 4C. Secondary 1:5000 HRP 1h RT. Arrow shows around 250 kDa. WB image submitted by a verified customer review.
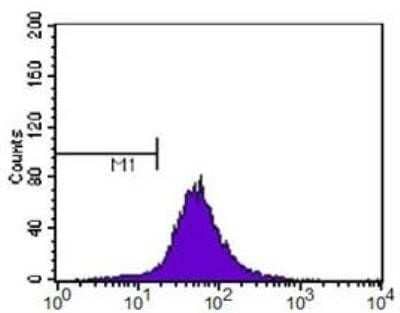
Flow Cytometry Analysis of HeLa Cells Stained with ABCA1 Antibody
ABCA1 antibody was tested at 1: 400 in HeLa cells using an Alexa Fluor 488 secondary (shown in purple). M1 is defined by unstained cells.
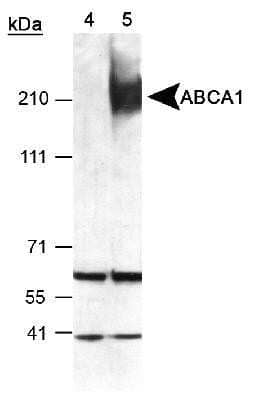
Western Blot Detection of ABCA1 in Mouse Peritoneal Macrophages
Detection of ABCA1 in mouse peritoneal macrophages using NB 400-105 (Lot L). ECL exposure, 1 min. Lane 4: T09 uninduced lysate Lane 5: T09 induced lysate.
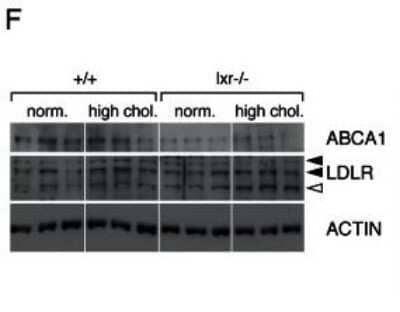
Western Blot Analysis of ABCA1 in WT and LXR Null Mice Under Normal or High Cholesterol Diets
Prostates of LXR mutant mice accumulate cholesterol esters through inappropriate LXR target genes regulation. Total protein lysates of WT and LXR null mice under normal or high cholesterol diet were analyzed by western blotting with antibodies against ABCA1, LDLR and ACTIN as a loading control (left panel), quantification of ABCA1 and LDLR protein accumulation levels (right panel). * p<0.05, *** p<0.001 in Student's t test. Error bars represent the +/- mean SEM. Image collected and cropped by CiteAb from the following publication (https://dx.plos.org/10.1371/journal.pgen.1003483), licensed under a CC-BY license.
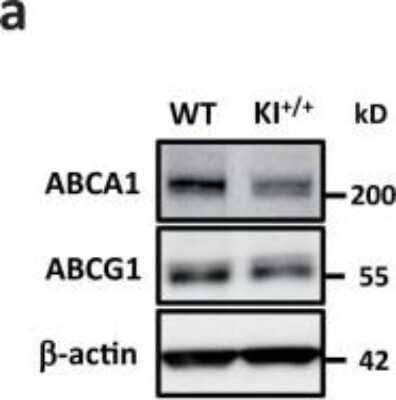
Western Blotting of ABCA1 in Peritoneal Macrophages from WT and KI+/+ Mice
miR-33b reduces cellular cholesterol efflux and serum HDL-C levels. Western blotting for ABCA1 (using NB400-105) and ABCG1 proteins in peritoneal macrophages from WT and KI+/+ mice. Representative images are shown. beta-actin was used as the loading control. Image collected and cropped by CiteAb from the following publication (https://www.nature.com/articles/srep05312), licensed under a CC-BY license.
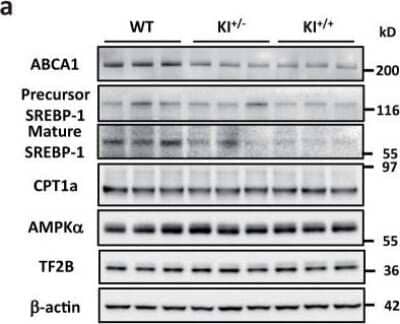
Western Blot Analysis of ABCA1 in the Livers of WT, KI+/-, and KI+/+ Mice
miR-33b regulates ABCA1 and SREBP-1. Analysis for ABCA1, SREBP-1, CPT1a, and AMPK alpha protein levels in the livers of WT, KI+/-, and KI+/+ mice. Representative images are shown. TF2B and beta-actin were used as loading controls. Image collected and cropped by CiteAb from the following publication (https://www.nature.com/articles/srep05312), licensed under a CC-BY license.
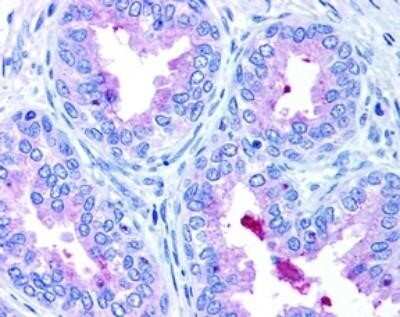
Immunohistochemical Staining of ABCA1 in Paraffin Embedded Human Prostate Epithelium
Detection of ABCA1 in human prostate epithelium showing luminal and membrane staining.
Western Blot: ABCA1 Antibody - BSA Free [NB400-105] -
Liver mRNA & protein expression analysis of chow-fed Osbpl8KO mice.A: qPCR analysis of the quantity of the mRNAs identified at the bottom in chow-fed KO females (open bars) & males (closed bars). The mRNAs were quantified using ribosomal protein 36B4 message as a housekeeping reference. The data are expressed relative to quantity in littermate WT animals of the same gender, & represent mean ± s.e.m. (n = 6; *p<0.05, **p<0.01, T-test). B: Western blot analysis of ABCA1 & SR-B1 proteins in WT & KO mouse liver. The blots were probed with anti-beta -actin as a loading control. Densitometric quantification of the Western blot data is shown on the right. The results were normalized against beta-actin. The data represents mean ± s.e.m. (n = 4). Image collected & cropped by CiteAb from the following publication (https://dx.plos.org/10.1371/journal.pone.0058856), licensed under a CC-BY license. Not internally tested by Novus Biologicals.
Western Blot: ABCA1 Antibody - BSA Free [NB400-105] -
Protein expressions of ABCA1, SR-BI & ABCG1 in liver & macrophage by Western blot. Simvastatin increased the expressions of ABCA1 & ABCG1 in liver & ABCA1 in macrophage, Both L-4F & the combination group improved the expressions of ABCA1, SR-BI & ABCG1 in liver & ABCA1 & ABCG1 in macrophage. 1P < 0.05, 2P < 0.001, vs. AS group; aP < 0.05, bP < 0.001, vs. Simva group;*P < 0.05, **P < 0.001, vs. L-4F group. Image collected & cropped by CiteAb from the following publication (https://lipidworld.biomedcentral.com/articles/10.1186/1476-511X-12-180), licensed under a CC-BY license. Not internally tested by Novus Biologicals.
Western Blot: ABCA1 Antibody - BSA Free [NB400-105] -
ABCA1, ABCG1 & SR-BI protein expressions. a & b Hepatic protein expressions of ABCA1, ABCG1 & SR-BI were significantly decreased in COMT−/− mice at GD 18.5, compared to C57BL/6 J mice. Decreased hepatic ABCA1 expression was also observed at 10 days postpartum. ATI-5261 increased ABCA1 & ABCG1 expression in the liver at 10 days postpartum. c Placental protein expressions of ABCA1 & ABCG1 was reduced in COMT−/− mice, compared to C57BL/6 J mice. ATI-5261 treatment significantly increased ABCA1 levels in the placenta of COMT−/− mice. d Representative immunoblots of the corresponding proteins in the placenta with mouse RAW264.7 cell lysate included as positive control. Similar results were obtained when the experiment was repeated with lysates prepared from three batches of tissues. Data are presented as mean ± SEM. Groups (n = 8 in all groups) were compared using one-way ANOVA with post-hoc analysis (Tukey’s procedure). *, p < 0.05 Image collected & cropped by CiteAb from the following publication (https://pubmed.ncbi.nlm.nih.gov/30237900), licensed under a CC-BY license. Not internally tested by Novus Biologicals.
Western Blot: ABCA1 Antibody - BSA Free [NB400-105] -
Effects of 13-HODE & LA in the presence & absence of PPAR alpha & PPAR gamma selective antagonists on molecular markers of cholesterol homeostasis in RAW264.7 macrophages. RAW264.7 cells were pre-treated without or with the PPAR alpha selective antagonist GW6471 or the PPAR gamma selective antagonist GW9662 & subsequently treated without (vehicle control) or with 2.5 μmol/L 13-HODE or 100 μmol/L LA for 24 h. Afterwards, cells were lysed & subsequently processed for western blotting as described in the materials & methods section. A, Representative immunoblots specific for ABCA1, ABCG1, SR-BI, LXR alpha, & beta-actin which was used for normalization are shown. B, Bars represent data from densitometric analysis & are means ± SD from three independent experiments (n = 3). Data are expressed as percentage of protein concentration of vehicle control cells. Results from statistical analysis are indicated: Significant effects are denoted with superscript letters. Bars marked without a common superscript letter significantly differ (P < 0.05). Image collected & cropped by CiteAb from the following publication (https://lipidworld.biomedcentral.com/articles/10.1186/1476-511X-10-222), licensed under a CC-BY license. Not internally tested by Novus Biologicals.
Western Blot: ABCA1 Antibody - BSA Free [NB400-105] -
Protein expressions of ABCA1, SR-BI & ABCG1 in liver & macrophage by Western blot. Simvastatin increased the expressions of ABCA1 & ABCG1 in liver & ABCA1 in macrophage, Both L-4F & the combination group improved the expressions of ABCA1, SR-BI & ABCG1 in liver & ABCA1 & ABCG1 in macrophage. 1P < 0.05, 2P < 0.001, vs. AS group; aP < 0.05, bP < 0.001, vs. Simva group;*P < 0.05, **P < 0.001, vs. L-4F group. Image collected & cropped by CiteAb from the following publication (https://lipidworld.biomedcentral.com/articles/10.1186/1476-511X-12-180), licensed under a CC-BY license. Not internally tested by Novus Biologicals.
Western Blot: ABCA1 Antibody - BSA Free [NB400-105] -
Western Blot: ABCA1 Antibody - BSA Free [NB400-105] - (A) Upregulation of ABCA1 & ABCG1 & (B) enhancement of cholesterol efflux by purple Perilla frutescens extracts (PPE) in 50 μg/ml Cu2+-oxidized low-density lipoproteins (LDL)-exposed J774A.1 murine macrophages. (A) For the measurement of ABCA1 & ABCG1 expression, total cell lysates were subjected to western blot analysis with a primary antibody against ABCA1 or ABCG1. beta-actin was used as an internal control. Bar graphs (means ± SEM, n=3) represent quantitative densitometric results of the upper bands. (B) Cholesterol efflux was expressed as the percentage of fluorescence in the medium relative to the total fluorescence. Bar graphs denoted without a common letter indicate significant difference, P<0.05. Image collected & cropped by CiteAb from the following publication (https://www.spandidos-publications.com/10.3892/ijmm.2015.2101), licensed under a CC-BY license. Not internally tested by Novus Biologicals.
Western Blot: ABCA1 Antibody - BSA Free [NB400-105] -
Western Blot: ABCA1 Antibody - BSA Free [NB400-105] - 6‐Dihydroparadol increases A) ABCA1 & B) ABCG1, but not C) SR‐BI protein levels in cholesterol‐loaded THP‐1‐derived macrophages. THP‐1 cells were differentiated as described in Figure 2, & then loaded with unlabeled cholesterol for 24 h. Cells were treated with increasing concentrations of 6‐dihydroparadol (1–30 μm) for another 24 h. The protein levels of ABCA1, ABCG1, & SR‐B1 were detected by Western blot analysis. The control was treated with solvent vehicle (0.1% DMSO). As a positive control, TO901317 (5 μm, 24 h) was used. The bar graphs represent mean ± SD from three independent experiments. *p < 0.05, **p < 0.01, & ***p < 0.001 versus control (determined by Student's t‐test or ANOVA with Bonferroni's post hoc test). Image collected & cropped by CiteAb from the following publication (https://pubmed.ncbi.nlm.nih.gov/29802792), licensed under a CC-BY license. Not internally tested by Novus Biologicals.
Western Blot: ABCA1 Antibody - BSA Free [NB400-105] -
Western Blot: ABCA1 Antibody - BSA Free [NB400-105] - Akt inhibition suppresses mTORC1 activity.BHK-ABCA1 cells were induced overnight with mifepristone (10 nM) & then incubated with DEBC, LY294002 or rapamycin at indicated concentrations for 2 h. Cells were then lysed & analyzed for ABCA1 & phosphorylated S6K by Western blotting. Actin was also blotted as loading control. Image collected & cropped by CiteAb from the following publication (https://dx.plos.org/10.1371/journal.pone.0113789), licensed under a CC-BY license. Not internally tested by Novus Biologicals.
Western Blot: ABCA1 Antibody - BSA Free [NB400-105] -
Western Blot: ABCA1 Antibody - BSA Free [NB400-105] - Reversal of hepatic steatosis by reduction of SREBP-1 levels.(a) Western blotting analysis of SREBP-1 & ABCA1 levels in livers of miR-33+/+Srebf1+/+, miR-33+/+Srebf1+/−, miR-33−/−Srebf1+/+ & miR-33−/−Srebf1+/− mice. Representative western blot images are shown (n=4). Image collected & cropped by CiteAb from following publication (https://pubmed.ncbi.nlm.nih.gov/24300912), licensed under a CC-BY license. Not internally tested by Novus Biologicals.
Western Blot: ABCA1 Antibody - BSA Free [NB400-105] -
Western Blot: ABCA1 Antibody - BSA Free [NB400-105] - 6‐Dihydroparadol increases A) ABCA1 & B) ABCG1 protein stability. THP‐1 cells were differentiated as described in Figure 2. Then cells were loaded with unlabeled cholesterol & treated with 6‐dihydroparadol (10 μm), or solvent vehicle (0.1% DMSO, control) for 24 h. Cells were lysed at different time points (0, 1, 2, 3, 4, & 6 h) after treatment with the protein synthesis inhibitor cycloheximide (CHX, 100 μm). The protein levels of both ABCA1 & ABCG1 were detected by Western blot analysis. The data points represent mean ± SD from three independent experiments. *p < 0.05 & **p < 0.01 versus control at the same time point (determined by Student's t‐test). Image collected & cropped by CiteAb from the following publication (https://pubmed.ncbi.nlm.nih.gov/29802792), licensed under a CC-BY license. Not internally tested by Novus Biologicals.
Western Blot: ABCA1 Antibody - BSA Free [NB400-105] -
Western Blot: ABCA1 Antibody - BSA Free [NB400-105] - Ligand activation of LXR inhibits LPS-induced MAP kinase activation through Abca1 induction.(A–D) Bone marrow-derived macrophages from Lxr alpha−/−Lxr beta−/− & control wild-type mice (A, B), or bone marrow-derived macrophages from myeloid-specific Abca1−/− & control wild-type mice (C, D) were pretreated with GW3965 (1 µM) overnight, followed by stimulation with LPS (10 ng/ml) for 20 min or 1 hr. Whole cell lysates were harvested & protein expression was analyzed by immunoblotting with the indicated antibodies (A, C). Protein expression was quantified by Image Quant TL7.0 (B, D). N = 4–6 per group. *p < 0.05, **p < 0.01, NS, not significant. Error bars represent means ± SEM.DOI:http://dx.doi.org/10.7554/eLife.08009.012 Image collected & cropped by CiteAb from the following publication (https://elifesciences.org/articles/08009), licensed under a CC-BY license. Not internally tested by Novus Biologicals.
Western Blot: ABCA1 Antibody - BSA Free [NB400-105] -
Western Blot: ABCA1 Antibody - BSA Free [NB400-105] - 6‐Dihydroparadol increases A) ABCA1 & B) ABCG1, but not C) SR‐BI protein levels in cholesterol‐loaded THP‐1‐derived macrophages. THP‐1 cells were differentiated as described in Figure 2, & then loaded with unlabeled cholesterol for 24 h. Cells were treated with increasing concentrations of 6‐dihydroparadol (1–30 μm) for another 24 h. The protein levels of ABCA1, ABCG1, & SR‐B1 were detected by Western blot analysis. The control was treated with solvent vehicle (0.1% DMSO). As a positive control, TO901317 (5 μm, 24 h) was used. The bar graphs represent mean ± SD from three independent experiments. *p < 0.05, **p < 0.01, & ***p < 0.001 versus control (determined by Student's t‐test or ANOVA with Bonferroni's post hoc test). Image collected & cropped by CiteAb from the following publication (https://pubmed.ncbi.nlm.nih.gov/29802792), licensed under a CC-BY license. Not internally tested by Novus Biologicals.
Western Blot: ABCA1 Antibody - BSA Free [NB400-105] -
Western Blot: ABCA1 Antibody - BSA Free [NB400-105] - Western Blotting for ABCA1, as detailed in Supplementary Protocol #5 (Additional file 1). Caco-2 cells cultivated on filter inserts were treated for 48 h with bexarotene (RXR agonist, 5 μM), T0901317 (LXR agonist, 10 μM), GW3965 (LXR agonist, 10 μM) or the vehicle control (DMSO 0.1%). Protein expression was then determined by western blot analysis. Results were normalized for interexperimental variance & then set in relation to the vehicle control. Bar graphs represent mean ± SD from three independent experiments. A representative blot is shown - the bands stem from the same membrane & the vertical line indicates excised irrelevant bands. ns not significant, *P < 0.05, **P < 0.01 versus solvent vehicle (determined by paired t-test) Image collected & cropped by CiteAb from the following publication (https://pubmed.ncbi.nlm.nih.gov/32308567), licensed under a CC-BY license. Not internally tested by Novus Biologicals.
Western Blot: ABCA1 Antibody - BSA Free [NB400-105] -
Western Blot: ABCA1 Antibody - BSA Free [NB400-105] - Ligand activation of LXR inhibits LPS-induced MAP kinase activation through Abca1 induction.(A–D) Bone marrow-derived macrophages from Lxr alpha−/−Lxr beta−/− & control wild-type mice (A, B), or bone marrow-derived macrophages from myeloid-specific Abca1−/− & control wild-type mice (C, D) were pretreated with GW3965 (1 µM) overnight, followed by stimulation with LPS (10 ng/ml) for 20 min or 1 hr. Whole cell lysates were harvested & protein expression was analyzed by immunoblotting with the indicated antibodies (A, C). Protein expression was quantified by Image Quant TL7.0 (B, D). N = 4–6 per group. *p < 0.05, **p < 0.01, NS, not significant. Error bars represent means ± SEM.DOI:http://dx.doi.org/10.7554/eLife.08009.012 Image collected & cropped by CiteAb from the following publication (https://elifesciences.org/articles/08009), licensed under a CC-BY license. Not internally tested by Novus Biologicals.
Western Blot: ABCA1 Antibody - BSA Free [NB400-105] -
Western Blot: ABCA1 Antibody - BSA Free [NB400-105] - Expression of ABCA1 & CROT in livers & RIP140 in macrophages is elevated in miR-33−/−Apoe−/− mice compared with miR-33+/+Apoe−/− mice. A, Quantitative real-time PCR analysis of Abca1, Crot, Cpt1a, & Prkaa1in livers from miR-33+/+Apoe−/− & miR-33−/−Apoe−/− mice. Values from miR-33+/+Apoe−/− mice were set at 100%. Values are mean±SE (n=9 to 11each); **P<0.01. B, Western analysis of ABCA1, CROT, CPT1a, & AMPK alpha in livers from miR-33+/+Apoe−/− & miR-33−/−Apoe−/− mice. beta-actin was used as a loading control. C, Densitometry of ABCA1, CROT, CPT1a, & AMPK alpha in livers from miR-33+/+Apoe−/− & miR-33−/−Apoe−/− mice. Values from miR-33+/+Apoe−/− mice were set at 100%. Values are mean±SE (n=4 each); *P<0.05. D, Total cholesterol, free cholesterol, cholesterol ester, & triglyceride levels in livers of miR-33+/+Apoe−/− & miR-33−/−Apoe−/− mice. Values are mean±SE (n=9 to 11 each). E, HE staining of livers of miR-33+/+Apoe−/− & miR-33−/−Apoe−/− mice at age 20 weeks fed NC. Scale bar: 100 μm. F, Quantitative real-time PCR analysis of Nrip1 (RIP140) in peritoneal macrophages from miR-33+/+Apoe−/− & miR-33−/−Apoe−/− mice. Values from miR-33+/+Apoe−/− mice were set at 100%. Values are mean±SE (n=7 each). G, Western analysis of NRIP1 (RIP140) in peritoneal macrophages from miR-33+/+Apoe−/− & miR-33−/−Apoe−/− mice. GAPDH was used as a loading control. H, Densitometry of NRIP1 (RIP140) in peritoneal macrophages from miR-33+/+Apoe−/− & miR-33−/−Apoe−/− mice. Values from miR-33+/+Apoe−/− mice were set at 100%. Values are mean±SE (n=4 each); *P<0.05. Image collected & cropped by CiteAb from the following publication (https://pubmed.ncbi.nlm.nih.gov/23316322), licensed under a CC-BY license. Not internally tested by Novus Biologicals.
Western Blot: ABCA1 Antibody - BSA Free [NB400-105] -
Western Blot: ABCA1 Antibody - BSA Free [NB400-105] - Basal ABCA1 expression & function in patient-derived iRPEs. (A) Representation of patient-derived iPSC lines & genotypes harboring polymorphisms in ABCA1 that are associated with decreased or increased risk for AMD development. (B) Relative expression of ABCA1 mRNA in patient-derived iRPEs under basal conditions normalized to RPL28 & decreased risk group. (C) Western blot analysis of ABCA1 levels in patient-derived iRPEs under basal conditions. Actin was detected as loading control. ABCA1 expression was quantified & normalized to actin. (D,E) Relative expression of ABCG1 (D) & NR1H3 (E) mRNA in patient-derived iRPEs under basal conditions normalized to RPL28 & decreased risk group. (F) Cholesterol efflux in patient-derived iRPEs after direct cell labeling & in the presence of ApoAI. (G) Cholesterol efflux in patient-derived iRPEs after phagocytosis of BODIPY-cholesterol-loaded POSs & in the presence of ApoAI. (H) Quantification of phagocytosed POSs per nuclei in patient-derived iRPEs. Values shown are means ± SD (n = 3). * p < 0.05; *** p < 0.001. Unpaired Student’s t-test. (I) Representative fluorescence microscopy images of phagocytosed FITC-labeled POSs (green) & staining for ZO-1 (red) & DAPI (blue) of increased risk cell line IPS19-00096. Scale bar = 100 μm. Image collected & cropped by CiteAb from the following publication (https://pubmed.ncbi.nlm.nih.gov/35328615), licensed under a CC-BY license. Not internally tested by Novus Biologicals.
Western Blot: ABCA1 Antibody - BSA Free [NB400-105] -
Western Blot: ABCA1 Antibody - BSA Free [NB400-105] - A–C) Effects of 6‐dihydroparadol & specific proteasomal, lysosomal, & calpain inhibitors on the ABCA1 protein levels. THP‐1 cells were differentiated as described in Figure 2, & then loaded with unlabeled cholesterol for 24 h. Cells were treated with or without 6‐dihydroparadol (6‐DP, 30 μm) for 24 h & incubated for another 3 h with or without the proteasome inhibitor lactacystin (10 μm), the lysosomal inhibitor chloroquine (100 μm), or the calpain inhibitor calpeptin (30 μg mL−1). The ABCA1 protein levels were detected by Western blot analysis. The bar graphs represent mean ± SD from three independent experiments. *p < 0.05, **p < 0.01, & ***p < 0.001 versus control; n.s., not significant versus control (determined by Student's t‐test or ANOVA with Bonferroni's post hoc test). Image collected & cropped by CiteAb from the following publication (https://pubmed.ncbi.nlm.nih.gov/29802792), licensed under a CC-BY license. Not internally tested by Novus Biologicals.
Western Blot: ABCA1 Antibody - BSA Free [NB400-105] -
Western Blot: ABCA1 Antibody - BSA Free [NB400-105] - Suppressive effects of Ucn1 on foam cell formation & related protein expression in human monocyte-derived macrophages.Human monocytes were incubated for 7 days with RPMI-1640 supplemented with 10% human serum & the indicated concentrations of Ucn1, followed by a 19 h-incubation with 50 µg/ml oxLDL in the presence of 0.1 mmol/l [3H]oleate. Intracellular CE accumulation was determined from the radioactivity of cholesterol-[3H]oleate. Otherwise, before the addition of oxLDL, cells were harvested & subjected to immunoblotting analyses for CD36, ACAT1, or ABCA1. beta-Actin served as a loading control. Data are expressed as means ± SEM from 4–6 independent experiments with monocytes from 4–6 different donors. Baseline (1 fold) = 8.4±2.2 nmol/mg cell protein. *P<0.05, †P<0.001 vs. 0 nmol/l of Ucn1. Image collected & cropped by CiteAb from the following publication (https://dx.plos.org/10.1371/journal.pone.0110866), licensed under a CC-BY license. Not internally tested by Novus Biologicals.
Western Blot: ABCA1 Antibody - BSA Free [NB400-105] -
Western Blot: ABCA1 Antibody - BSA Free [NB400-105] - Effect of evodiamine on ABCA1 transcription & the degradation rate of ABCA1 protein. (a) Differentiated THP-1 macrophages were incubated with 10 μM evodiamine or 10 μM pioglitazone as positive control for 24 h. Total RNA was extracted & ABCA1 mRNA expression levels were quantified by qRT-PCR. (b) 293 T cells were transfected with a luciferase reporter construct driven by the human ABCA1 promoter as described in the Materials & Methods section. After transfection, cells were treated with 10 μM Evodiamine or 1 μM T0901317 as positive control for 24 h. (c) Differentiated THP-1 macrophages were incubated for 24 h with (black circle) or without (Veh; white circle) evodiamine (10 μM) & lysed after addition of cycloheximide (CHX; 140 μM) at different time points (0, 10, 20, 40 min). Western blot analysis shows the decline of ABCA1 protein level with cycloheximide in the presence & absence of evodiamine. All data are means ± S.D. (n = 3) vs. solvent vehicle control (DMSO), *p < 0.05, **p < 0.01, n.s. no significance (ANOVA/Bonferroni). Image collected & cropped by CiteAb from the following publication (https://pubmed.ncbi.nlm.nih.gov/30038271), licensed under a CC-BY license. Not internally tested by Novus Biologicals.
Western Blot: ABCA1 Antibody - BSA Free [NB400-105] -
Western Blot: ABCA1 Antibody - BSA Free [NB400-105] - miR-33 deficiency improved cholesterol efflux in macrophages. A, Quantitative real-time PCR analysis of Abca1 & Abcg1 in macrophages from miR-33+/+Apoe−/− & miR-33−/−Apoe−/− mice. Values from miR-33+/+Apoe−/− were set at 100%. Values are mean±SE (n=7 each); ***P<0.001. B, Western blotting analysis of ABCA1 & ABCG1 in thioglycollate-elicited peritoneal macrophages from miR-33+/+Apoe−/− & miR-33−/−Apoe−/− mice. GAPDH was used as a loading control. C, Cholesterol efflux from thioglycollate-elicited peritoneal macrophages in the presence or absence of apoA-I (5 or 10 μg/mL). Values are mean±SE (n=6 each); **P<0.01. D, Cholesterol efflux from thioglycollate-elicited peritoneal macrophages in the presence or absence of HDL-C (50 or 100 μg/mL). Values are mean±SE (n=6 each); **P<0.01. Image collected & cropped by CiteAb from the following publication (https://pubmed.ncbi.nlm.nih.gov/23316322), licensed under a CC-BY license. Not internally tested by Novus Biologicals.
Western Blot: ABCA1 Antibody - BSA Free [NB400-105] -
Western Blot: ABCA1 Antibody - BSA Free [NB400-105] - A–C) Effects of 6‐dihydroparadol & specific proteasomal, lysosomal, & calpain inhibitors on the ABCA1 protein levels. THP‐1 cells were differentiated as described in Figure 2, & then loaded with unlabeled cholesterol for 24 h. Cells were treated with or without 6‐dihydroparadol (6‐DP, 30 μm) for 24 h & incubated for another 3 h with or without the proteasome inhibitor lactacystin (10 μm), the lysosomal inhibitor chloroquine (100 μm), or the calpain inhibitor calpeptin (30 μg mL−1). The ABCA1 protein levels were detected by Western blot analysis. The bar graphs represent mean ± SD from three independent experiments. *p < 0.05, **p < 0.01, & ***p < 0.001 versus control; n.s., not significant versus control (determined by Student's t‐test or ANOVA with Bonferroni's post hoc test). Image collected & cropped by CiteAb from the following publication (https://pubmed.ncbi.nlm.nih.gov/29802792), licensed under a CC-BY license. Not internally tested by Novus Biologicals.
Western Blot: ABCA1 Antibody - BSA Free [NB400-105] -
Western Blot: ABCA1 Antibody - BSA Free [NB400-105] - Srebf1 is a miR-33 target gene.(a) Relative changes in lipid metabolism-related genes in the livers of miR-33−/− mice compared with miR-33+/+ mice fed NC at 16 weeks of age. (n=5–8 each,*P<0.05 in Student’s t-test). (b) Conservation of miR-33 target regions in the 3′UTR of Srebf1. Underlined sequences are the potential binding site of miR-33 seed sequences. * indicates the conservation among spieces. (c) 3′UTR reporter assay used to verify the target. Luciferase reporter activity of human & mouse SREBP-1 gene 3′UTR constructs in 293T cells overexpressing miR-control (miR-Con) & miR-33 (n=4 each, *P<0.05 & ***P<0.001 in Student’s t-test). (d) miR-33 dose-dependent changes in luciferase reporter activity of mouse Srebf1 3′UTR construct in 293T cells. miR-Con & miR-146a is used as a negative control (n=4 each, *P<0.05 & ***P<0.001 in one-way analysis of valiance test). (e) Luciferase reporter activity of the WT or mutant Srebf1 3′UTR at the potential miR-33 binding site in 293T cells (n=4 each, **P<0.01 in Student’s t-test). (f,g) Luciferase reporter activity of SRE-promoter (f) or FAS-promoter (g) in 293T cells. 293T cells were co-transfected with mouse Srebf1 with the full-length 3′UTR or without the 3′UTR, along with expression plasmids for miR-negative control, or miR-33. Values are the mean±s.e. (n=4 each, **P<0.01 versus miR-Con. ***P<0.001 versus miR-Con in one-way analysis of valiance test). (h) Western blotting analysis of SREBP-1, ABCA1, & IRS-2 in miR-33 transduced HepG2 cells & primary hepatocytes & hepatocytes prepared from miR-33+/+ & miR-33−/− mice. Representative western blot images are shown (n=4). Values are the means±s.e.m. Image collected & cropped by CiteAb from the following publication (https://pubmed.ncbi.nlm.nih.gov/24300912), licensed under a CC-BY license. Not internally tested by Novus Biologicals.
Western Blot: ABCA1 Antibody - BSA Free [NB400-105] -
Western Blot: ABCA1 Antibody - BSA Free [NB400-105] - (A) Chemical structure, (B) cytotoxicity of alpha-asarone, (C) enhancement of cholesterol efflux by alpha-asarone, (D & E) upregulation of ABCA1 & ABCG1 by alpha-asarone & beta-asarone, & (F) elevation of retinoid X receptor (RXR) alpha transcription. J774A.1 murine macrophages were exposed to 50 μg/ml oxidized low-density lipoprotein (LDL) & treated with 1–10 μM purple Perilla frutescens extracts (PPE)-alpha -asarone & 5–10 μM beta-asarone. (B) MTT assay was performed for the measurement of alpha-asarone toxicity. Graph data represent 1 of 4 independent experiments with multiple estimations. Values are expressed as the percentage cell survival relative to the untreated control cells (cell viability, 100%). (C) Cholesterol efflux was expressed as the percentage fluorescence in the medium relative to total fluorescence. (D & E) For the measurement of ABCA1 & ABCG1 expression, total cell lysates were subjected to western blot analysis with a primary antibody against ABCG1 or ABCG1. beta-actin was used as an internal control. Bar graphs (means ± SEM, n=3) represent quantitative densitometric results of the upper bands. Bar graphs denoted without a common letter indicate significant difference, P<0.05. (F) RXR alpha mRNA expression was measured by RT-PCR. GAPDH was used as a housekeeping gene for the co-amplification with RXR alpha. Image collected & cropped by CiteAb from the following publication (https://www.spandidos-publications.com/10.3892/ijmm.2015.2101), licensed under a CC-BY license. Not internally tested by Novus Biologicals.
Western Blot: ABCA1 Antibody - BSA Free [NB400-105] -
Western Blot: ABCA1 Antibody - BSA Free [NB400-105] - Bilirubin significantly decreases expression of ATP‐binding cassette transporter A1 (ABCA1) protein in THP‐1 macrophages treated with LXR agonist (TO901317) to upregulate ABCA1 protein. THP‐1 cells were differentiated for 72 hours with 200 nmol/L phorbol‐12‐myristate‐13‐acetate & then loaded with unlabeled cholesterol for another 24 hours. Cells were treated with TO901317 (5 μmol/L) or solvent vehicle (0.1% dimethyl sulfoxide [DMSO]) for 24 hours. Afterward, cells were treated with bilirubin (17.1 μmol/L) or solvent vehicle (0.1% DMSO) for 16 hours. The protein levels of ABCA1 were detected by western blot analysis. The bar graphs present mean±SD from 3 independent experiments. ***P<0.001 vs control (determined by ANOVA with Bonferroni post hoc test). Image collected & cropped by CiteAb from the following publication (https://pubmed.ncbi.nlm.nih.gov/28455345), licensed under a CC-BY license. Not internally tested by Novus Biologicals.
Western Blot: ABCA1 Antibody - BSA Free [NB400-105] -
Western Blot: ABCA1 Antibody - BSA Free [NB400-105] - Induction of cholesterol efflux attenuates the enhancement in HIV-1infectivity in NPCD55 cells. (A) Normal & NPCD55 cells were treated with 5 μM TO-901317 at 24 h post-infection & cultured for 72 h in the presence of the compound. At 96 h post-infection the cells were harvested & ABCA1, Gag, & beta-actin expression was detected by Western blotting analysis. All samples were loaded on the same gel. (B) AmplexRed assay was performed to measure free cholesterol content of untreated (filled) & TO-901317-treated (slashed) cells. Cholesterol content was normalized to protein concentration. (C) AmplexRed assay was performed to measure virion-associated cholesterol from purified virus produced in untreated (filled) & TO-901317-treated (slashed) infected cells. Virion-associated cholesterol content was normalized to p24 concentration. (D) TZM-bl reporter assay was performed to measure virus infectivity when cholesterol efflux was induced via TO-901317 stimulation. The ρ values were calculated by performing student T-test (*denotes < 0.05). Image collected & cropped by CiteAb from the following publication (https://pubmed.ncbi.nlm.nih.gov/22273177), licensed under a CC-BY license. Not internally tested by Novus Biologicals.
Western Blot: ABCA1 Antibody - BSA Free [NB400-105] -
Western Blot: ABCA1 Antibody - BSA Free [NB400-105] - Effects of apabetalone on ABCA1 expression & carboplatin response in ovarian cancer cells. (A) Apabetalone treatment reduced expression of ABCA1 in OVCAR-5 & OVCAR-5 CBPR cell lines. Cells were treated for 72 h with control medium (DMSO) or apabetalone (80 µM). Protein extracts from OVCAR-5 (~30 µg) were electrophoresed & immunoblotted with rabbit polyclonal ABCA1 antibody (1/1000, NB400-105, Novus Biological) & beta-actin (1/2000, Abcam) was used as a loading control. (B) Quantification of Western blot. OVCAR-5 (C), CaOV3 (D), OVCAR-5 CBPR (E) & CaOV3 CBPR (F) cell survival following treatment with carboplatin (CBP) alone (0-200 µM, black line) & in combination with apabetalone (Apa, 80 µM, purple line). (G) Carboplatin IC50 for OVCAR-5 & OVCAR-5 CBPR cells ± apabetalone. Data are mean ± SEM from three independent experiments. *P < 0.05, Student’s t-test. (H) Carboplatin IC50 for CaOV3 & CaOV3 CBPR cells ± apabetalone. Data are mean ± SEM from three independent experiments. P < 0.05, Student’s t-test. Image collected & cropped by CiteAb from the following publication (https://pubmed.ncbi.nlm.nih.gov/35582032), licensed under a CC-BY license. Not internally tested by Novus Biologicals.
Western Blot: ABCA1 Antibody - BSA Free [NB400-105] -
Western Blot: ABCA1 Antibody - BSA Free [NB400-105] - Expression of ATP‐binding cassette transporter A1 (ABCA1) protein in THP‐1 macrophages treated with bilirubin & in peripheral blood mononuclear cells (PBMCs) from Gilbert syndrome (GS) patients. A, Bilirubin suppresses the expression of ABCA1 protein in THP‐1‐derived macrophages time‐dependently. THP‐1 cells were differentiated as described in Figure 1 & then loaded with unlabeled cholesterol for another 24 hours. Cells were treated with bilirubin (17.1 μmol/L) for 4, 8, 16, & 24 hours. The protein levels of ABCA1 were detected by western blotting. Control was treated with solvent vehicle (0.1% dimethyl sulfoxide). The bar graph presents mean±SD from 3 independent experiments. B, Expression of ABCA1 protein is decreased in PBMCs from participants with high bilirubin blood levels (GS) compared with healthy controls. The protein levels of ABCA1 were detected by western blotting. The bar graph presents mean±SEM (n=28 per group). *P<0.05, **P<0.01 & ***P<0.001 vs control. ns indicates not significant (determined by Student t test). Image collected & cropped by CiteAb from the following publication (https://pubmed.ncbi.nlm.nih.gov/28455345), licensed under a CC-BY license. Not internally tested by Novus Biologicals.
Western Blot: ABCA1 Antibody - BSA Free [NB400-105] -
Western Blot: ABCA1 Antibody - BSA Free [NB400-105] - (A) Time course response of ABCA1 induction by pioglitazone, & (B) enhancement of ABCA1 & (C) peroxisome proliferator-activated receptor gamma (PPAR gamma) by purple Perilla frutescens extracts (PPE). J774A.1 murine macrophages were incubated with 10 μM pioglitazone & 50 μg/ml oxidized low-density lipoprotein (LDL) in the absence or presence of 1–10 μg/ml PPE. For the measurement of expression of (A & B) ABCA1 & (C) PPAR gamma, total cell lysates were subjected to western blot analysis with a primary antibody against ABCA1 or PPAR gamma. beta-actin was used as an internal control. Bar graphs (means ± SEM, n=3) represent quantitative densitometric results of the upper bands. Bar graphs denoted without a common letter indicate significant difference, P<0.05. Image collected & cropped by CiteAb from the following publication (https://www.spandidos-publications.com/10.3892/ijmm.2015.2101), licensed under a CC-BY license. Not internally tested by Novus Biologicals.
Western Blot: ABCA1 Antibody - BSA Free [NB400-105] -
Western Blot: ABCA1 Antibody - BSA Free [NB400-105] - LXR agonist-stimulated ABCA1 expression & function in patient-derived iRPEs. Patient-derived iRPE lines were stimulated for 16 h with LXR agonist & are relative to unstimulated cells shown in Figure 2. (A) Expression of ABCA1 mRNA normalized to RPL28 & relative to unstimulated cells shown in Figure 2B. (B) Western blot analysis of ABCA1 protein levels. Actin was detected as loading control. ABCA1 expression was quantified & normalized to actin. (C) Cholesterol efflux assay after direct cell labeling & in the presence of ApoAI. (D) Cholesterol efflux assay after phagocytosis of BODIPY-cholesterol-loaded POSs & in the presence of ApoAI. Data are relative to unstimulated cells shown in Figure 2F,G, respectively. Data are presented as means ± SD (n = 3). Unpaired Student’s t-test. * p < 0.05. Image collected & cropped by CiteAb from the following publication (https://pubmed.ncbi.nlm.nih.gov/35328615), licensed under a CC-BY license. Not internally tested by Novus Biologicals.
Western Blot: ABCA1 Antibody - BSA Free [NB400-105] -
Western Blot: ABCA1 Antibody - BSA Free [NB400-105] - Akt inhibition by LY294002 or Akt1/2 also enhances cholesterol efflux to apoA-I from ABCA1-expressing BHK cells.A) BHK cells were induced as in Fig. 1 & then incubated with LY294002 (200 µM) for 2 h. Cells were then lysed & analysed for ABCA1, phosphorylated Akt (p-Akt) & total Akt by Western-blotting. Hsp70 was also blotted as loading control. B & C) BHK cells were labeled with [3H] cholesterol & induced with 10 nM mifepristone overnight. Cholesterol efflux was measured after 2 h incubation with BSA (1 mg/ml) or BSA plus apoA-I (5 µg/ml). Some of cells were also incubated with indicated doses of LY294002 (B) or Akt1/2 (C), in addition to apoA-I, during 2 h efflux period. Results are presented as the average of triplicate wells with standard deviation & representative of more than three independent experiments. *** P<0.0001, **P<0.001 & *P<0.05 vs apoA-I only. Image collected & cropped by CiteAb from the following publication (https://dx.plos.org/10.1371/journal.pone.0113789), licensed under a CC-BY license. Not internally tested by Novus Biologicals.
Western Blot: ABCA1 Antibody - BSA Free [NB400-105] -
Western Blot: ABCA1 Antibody - BSA Free [NB400-105] - Generation, differentiation & analysis of ABCA1-deficient iRPEs. (A) Immunofluorescence staining for ZO-1 (red) in 4-week cultured iRPEs. Nuclei were stained with DAPI (blue). Scale bar = 100 μm. (B) Bright-field microscopy of iRPEs. (C) Ct values of RPE marker genes BEST1, OTX2, RLBP1 & RPE65 in iRPEs & parental iPSCs obtained by qPCR. Values shown are means ± SD (n = 3). Unpaired Student’s t-test. **** p < 0.0001. (D) Sequence alignment of parts of exon 14 (top) & exon 46 (bottom) of ABCA1-deficient iRPE cell clones & parental line. (E) Western blot of ABCA1 protein levels in ABCA1-deficient iRPE cell lines & parental cell line after 16 h of stimulation with 1 μM LXR agonist. Actin was detected as loading control. (F) Relative expression of ABCA1 mRNA in ABCA1-deficient iRPE cell lines & parental cell line normalized to ACTB. Values shown are means ± SD (n = 3). One-way ANOVA with Tukey’s post hoc test. **** p < 0.0001. (G) Relative expression of ABCG1 mRNA in ABCA1-deficient iRPE cell lines & parental cell line normalized to ACTB. Values shown are means ± SD (n = 3). One-way ANOVA with Tukey’s post hoc test. ** p < 0.01; *** p < 0.001. (H) Cholesterol efflux assay in iRPEs in the presence of ApoAI and/or LXR agonist (LXR ag). Values shown are means ± SD (n = 3). Two-way ANOVA with Bonferroni post hoc test vs. DMSO + BSA control. **** p < 0.0001. (I) Bright-field (BF) microscopy & Nile Red fluorescence microscopy (overview & close-up view marked with white squares) of 4-week cultured ABCA1-deficient iRPE cell lines & parental cell line. Relative fluorescence was quantified & is shown as mean ± SD (n = 8). One-way ANOVA with Tukey’s post hoc test. * p < 0.05, **** p < 0.0001. Image collected & cropped by CiteAb from the following publication (https://pubmed.ncbi.nlm.nih.gov/35328615), licensed under a CC-BY license. Not internally tested by Novus Biologicals.
Western Blot: ABCA1 Antibody - BSA Free [NB400-105] -
Western Blot: ABCA1 Antibody - BSA Free [NB400-105] - Akt inhibition enhances cholesterol efflux to apoA-I from wt MEFs, but not from TSC2-/- MEFs where mTORC1 is constitutively activated.A) Mouse embryonic fibroblasts (MEFs), wt & TSC2-/-, were induced overnight with T0901317 (10 µM). Cell lysates were collected for Western blotting for phosphorylated S6K & total S6K. B) wt & TSC2-/- MEFs were incubated with or without T0901317 (10 µM) overnight. Some of cells were then incubated with apoA-I (10 µg/ml) or apoA-I plus DEBC (25 µM) for 2 h. The expression of ABCA1, phosphorylated Akt, total Akt & loading control hsp70 were analyzed by Western blotting. C) wt & TSC2-/- were labeled with [3H] cholesterol for 1 day & then incubated with or without T0901317 (10 µM) overnight. Some of cells were then incubated with apoA-I (10 µg/ml) or apoA-I plus DEBC (25 µM) for 2 h to analyze cholesterol efflux. Data presented as the average of triplicate wells with standard deviation & representative of at least three independent experiments. *** P<0.0001 vs apoA-I only. Image collected & cropped by CiteAb from the following publication (https://dx.plos.org/10.1371/journal.pone.0113789), licensed under a CC-BY license. Not internally tested by Novus Biologicals.
Western Blot: ABCA1 Antibody - BSA Free [NB400-105] -
Western Blot: ABCA1 Antibody - BSA Free [NB400-105] - Akt inhibition by DEBC enhances cholesterol efflux to apoA-I specifically from ABCA1-expressing BHK cells.A) BHK-ABCA1 cells were induced with mifepristone (10 nM) overnight & then incubated with indicated doses of DEBC for 2 h. Cells were then lysed & Western-blotted for ABCA1, phosphorylated Akt (p-Akt) & total Akt. Hsp70 was also blotted as loading control. B) BHK-ABCA1 cells were labeled with [3H] cholesterol & induced overnight as above. After 2 h incubation with BSA (1 mg/ml) or BSA plus apoA-I (5 µg/ml), cholesterol efflux was measured as described in the Methods section. Some of the cells were also incubated with indicated doses of DEBC, in addition to apoA-I, during 2 h efflux period. C) BHK-ABCA1 & BHK-A937V cells were induced with mifepristone (10 nM) overnight. 2 h Cholesterol efflux was measured as above either with or without DEBC (25 µM). Results are presented as the average of triplicate wells with standard deviation & representative of more than three independent experiments. *** P<0.0001 & **P<0.001 vs apoA-I only. Image collected & cropped by CiteAb from the following publication (https://dx.plos.org/10.1371/journal.pone.0113789), licensed under a CC-BY license. Not internally tested by Novus Biologicals.
Western Blot: ABCA1 Antibody - BSA Free [NB400-105] -
Western Blot: ABCA1 Antibody - BSA Free [NB400-105] - LXRs control expression of genes involved in cholesterol homeostasis & fatty acid synthesis in MPECs.(A) qPCR analysis of Abca1, Abcg1 & Idol levels in WT (+/+) & Lxr alpha beta−/− (lxr−/−) MPECs after DMSO (vehicle) or T0901317 stimulation (B) Effect of 9-cis retinoic acid and/or T0901317 stimulation on Abca1 accumulation levels in WT (+/+) & Lxr alpha beta−/− (lxr−/−) MPECs (C) qPCR analysis of Srebp1, Acc, & Fas levels in WT (+/+) & Lxr alpha beta−/− (lxr−/−) MPECs after DMSO (vehicle) or T0901317 stimulation. (qPCR analysis results from 4 independant experiments & was normalized using 36b4 gene). *p<0.05, **p<0.01, ***p<0.001 in Student’s t test. Error bars represent mean ± SEM. (D) Western blot analysis was performed on WT (+/+) or Lxr alpha beta−/− MPECs using Srebp1c, Abca1 & beta-Actin antibodies. (E) Oil-Red O staining (ORO) & Normarski/Dapi of WT (+/+) & Lxr alpha beta−/− MPECs, or WT MEFs, treated for 48h with DMSO (vehicle) or T0901317 (1 µM). Head arrows indicate lipid droplets. Scale bars 100 µm. Image collected & cropped by CiteAb from the following publication (https://pubmed.ncbi.nlm.nih.gov/23554947), licensed under a CC-BY license. Not internally tested by Novus Biologicals.
Western Blot: ABCA1 Antibody - BSA Free [NB400-105] -
Western Blot: ABCA1 Antibody - BSA Free [NB400-105] - (A) Time course response of ABCA1 induction by pioglitazone, & (B) enhancement of ABCA1 & (C) peroxisome proliferator-activated receptor gamma (PPAR gamma) by purple Perilla frutescens extracts (PPE). J774A.1 murine macrophages were incubated with 10 μM pioglitazone & 50 μg/ml oxidized low-density lipoprotein (LDL) in the absence or presence of 1–10 μg/ml PPE. For the measurement of expression of (A & B) ABCA1 & (C) PPAR gamma, total cell lysates were subjected to western blot analysis with a primary antibody against ABCA1 or PPAR gamma. beta-actin was used as an internal control. Bar graphs (means ± SEM, n=3) represent quantitative densitometric results of the upper bands. Bar graphs denoted without a common letter indicate significant difference, P<0.05. Image collected & cropped by CiteAb from the following publication (https://www.spandidos-publications.com/10.3892/ijmm.2015.2101), licensed under a CC-BY license. Not internally tested by Novus Biologicals.
Western Blot: ABCA1 Antibody - BSA Free [NB400-105] -
Western Blot: ABCA1 Antibody - BSA Free [NB400-105] - Anti-ApoA-1 IgGs upregulate ABCA1. ABCA1 was increased after 16 & 24 h of anti-ApoA-1 IgG exposure to HMDM at the mRNA level as revealed by RT-PCR (a) as well as at the protein level after 24 h anti-apoA-1 IgG stimulation, as revealed by Western blot analysis (b). In panel a, data are expressed as fold change expression of the mean ± SD of ABCA1 calculated by delta deltaCT method of six independent experiments (n = 6) & values were normalized to untreated condition. p-values were calculated using the Student’s t-test: * p < 0.05, ** p < 0.01, **** p < 0.0001. (b) One of four representative Western blots is shown. Data are the mean ± SD of band intensity volume/actin intensity volume of four independent experiments (n = 4). p-values were calculated using the Student’s t-test: * p = 0.02, ** p = 0.005. Image collected & cropped by CiteAb from the following publication (https://pubmed.ncbi.nlm.nih.gov/31766415), licensed under a CC-BY license. Not internally tested by Novus Biologicals.
Western Blot: ABCA1 Antibody - BSA Free [NB400-105] -
Western Blot: ABCA1 Antibody - BSA Free [NB400-105] - A–C) Effects of 6‐dihydroparadol & specific proteasomal, lysosomal, & calpain inhibitors on the ABCA1 protein levels. THP‐1 cells were differentiated as described in Figure 2, & then loaded with unlabeled cholesterol for 24 h. Cells were treated with or without 6‐dihydroparadol (6‐DP, 30 μm) for 24 h & incubated for another 3 h with or without the proteasome inhibitor lactacystin (10 μm), the lysosomal inhibitor chloroquine (100 μm), or the calpain inhibitor calpeptin (30 μg mL−1). The ABCA1 protein levels were detected by Western blot analysis. The bar graphs represent mean ± SD from three independent experiments. *p < 0.05, **p < 0.01, & ***p < 0.001 versus control; n.s., not significant versus control (determined by Student's t‐test or ANOVA with Bonferroni's post hoc test). Image collected & cropped by CiteAb from the following publication (https://pubmed.ncbi.nlm.nih.gov/29802792), licensed under a CC-BY license. Not internally tested by Novus Biologicals.
Western Blot: ABCA1 Antibody - BSA Free [NB400-105] -
Western Blot: ABCA1 Antibody - BSA Free [NB400-105] - ABCA1 protein expression is upregulated in ovarian cancer cells with acquired carboplatin resistance. ABCA1 expression in OVCAR-5 (A) & CaOV3 (C) & carboplatin resistant OVCAR-5 CBPR (B) & CaOV3 CBPR (D) by immunocytochemistry using rabbit polyclonal ABCA1 antibody (1/100, NB400-105, Novus Biological). (E) OVCAR-5 cells with Rabbit IgG & (F) CaOV3 cells with Rabbit IgG. (G) Protein extracts from OVCAR-5 (~30 µg) & CaOV3 cell lines (~60 µg) were electrophoresed & immunoblotted with rabbit polyclonal ABCA1 antibody (1/1000, NB400-105, Novus Biological), & beta-actin (1/2000, Abcam) was used as a loading control. A major band was detected at ~250 kDa, which is the predicted size for ABCA1. (H) Quantitation of ABCA1 Western blots. Data are from 2-4 independent experiments. Statistical significance was determined using the Student’s t-test, *P < 0.05. Image collected & cropped by CiteAb from the following publication (https://pubmed.ncbi.nlm.nih.gov/35582032), licensed under a CC-BY license. Not internally tested by Novus Biologicals.
Western Blot: ABCA1 Antibody - BSA Free [NB400-105] -
Western Blot: ABCA1 Antibody - BSA Free [NB400-105] - Evodiamine enhances apo A1-mediated ChE from THP-1 macrophages & increases ABCA1 protein level. (a) Differentiated THP-1 cells were loaded with [3H]-cholesterol together with the indicated treatments for 24 h. On the next day, the cells were washed twice with PBS & incubated with the same compounds [solvent vehicle control (Veh; ≤0.1% DMSO), evodiamine (1–20 μM), & the PPAR gamma agonist pioglitazone (10 μM) as positive control] with or without 10 µg/mL apo A1. Extracellular as well as intracellular radioactivities were quantified with scintillation counter. Differentiated THP-1-derived macrophages were treated with solvent vehicle control (Veh; ≤0.1% DMSO), evodiamine (10 μM), & the PPAR gamma agonist pioglitazone (10 μM) as positive control. After 24 h incubation, the cells were lysed & 20 μg protein was resolved via SDS-PAGE. Immunodetection was performed with antibodies against the indicated proteins, ABCA1 (b), ABCG1 (c), & SR-B1 (d), & visualized by chemiluminescence detection. All experiments were performed at least three times & data are presented as means ± S.D. vs. solvent vehicle control, *p < 0.05, **p < 0.01, ***p < 0.001, n.s. no significance (ANOVA/Bonferroni). Image collected & cropped by CiteAb from the following publication (https://pubmed.ncbi.nlm.nih.gov/30038271), licensed under a CC-BY license. Not internally tested by Novus Biologicals.
Western Blot: ABCA1 Antibody - BSA Free [NB400-105] -
Western Blot: ABCA1 Antibody - BSA Free [NB400-105] - A–C) Effects of 6‐dihydroparadol & specific proteasomal, lysosomal, & calpain inhibitors on the ABCA1 protein levels. THP‐1 cells were differentiated as described in Figure 2, & then loaded with unlabeled cholesterol for 24 h. Cells were treated with or without 6‐dihydroparadol (6‐DP, 30 μm) for 24 h & incubated for another 3 h with or without the proteasome inhibitor lactacystin (10 μm), the lysosomal inhibitor chloroquine (100 μm), or the calpain inhibitor calpeptin (30 μg mL−1). The ABCA1 protein levels were detected by Western blot analysis. The bar graphs represent mean ± SD from three independent experiments. *p < 0.05, **p < 0.01, & ***p < 0.001 versus control; n.s., not significant versus control (determined by Student's t‐test or ANOVA with Bonferroni's post hoc test). Image collected & cropped by CiteAb from the following publication (https://pubmed.ncbi.nlm.nih.gov/29802792), licensed under a CC-BY license. Not internally tested by Novus Biologicals.
Western Blot: ABCA1 Antibody - BSA Free [NB400-105] -
Western Blot: ABCA1 Antibody - BSA Free [NB400-105] - Functional miR-33 responsive elements in the 3′UTR of ATP8B1 & ABCB11A,B. Conserved sequences in the 3′UTR of ATP8B1 & ABCB11 are partially complementary to miR-33. The element in human ATP8B1 is located 1877–1897 nt after the stop codon. The element in ABCB11 overlaps the stop codon in primates, while rodents show a conserved sequence 732–751 nt after the stop codon.C,D. Luciferase assays in HEK293 cells using the whole 3′UTR of human or murine ATP8B1 & ABCB11, or a single copy of the responsive elements (RE) identified above, or mutant responsive elements (RE*; where AATGCA was mutated to GGGTTG to prevent complementarity to the seed sequence of the miRNA), co-transfected with (closed bars) or without (open bars) a vector to overexpress miR-33. In grey, data from empty (negative control) & R33 (positive control containing a 100% match to miR-33) reporter vectors.E,F. Relative mRNA expression of canalicular transporters in primary murine hepatocytes (n = 4 dishes/condition) & human HuH-7 hepatoma cells (n = 3 dishes/condition) transduced 48 h with empty or miR-33 adenovirus.G. Relative protein levels in HuH7 cells transduced with empty or miR-33 adenovirus. Some cells were incubated for 16 h in the presence of FXR:RXR agonists (2 µmol/L GW4064 : 1 µmol/L 9-cis-retinoic acid) to induce ABCB11. Asterisk indicates a non-specific band. Data shown as mean ± SD; **p < 0.01. Image collected & cropped by CiteAb from the following publication (https://pubmed.ncbi.nlm.nih.gov/22767443), licensed under a CC-BY license. Not internally tested by Novus Biologicals.
Western Blot: ABCA1 Antibody - BSA Free [NB400-105] -
Western Blot: ABCA1 Antibody - BSA Free [NB400-105] - (A) Chemical structure, (B) cytotoxicity of alpha-asarone, (C) enhancement of cholesterol efflux by alpha-asarone, (D & E) upregulation of ABCA1 & ABCG1 by alpha-asarone & beta-asarone, & (F) elevation of retinoid X receptor (RXR) alpha transcription. J774A.1 murine macrophages were exposed to 50 μg/ml oxidized low-density lipoprotein (LDL) & treated with 1–10 μM purple Perilla frutescens extracts (PPE)-alpha -asarone & 5–10 μM beta-asarone. (B) MTT assay was performed for the measurement of alpha-asarone toxicity. Graph data represent 1 of 4 independent experiments with multiple estimations. Values are expressed as the percentage cell survival relative to the untreated control cells (cell viability, 100%). (C) Cholesterol efflux was expressed as the percentage fluorescence in the medium relative to total fluorescence. (D & E) For the measurement of ABCA1 & ABCG1 expression, total cell lysates were subjected to western blot analysis with a primary antibody against ABCG1 or ABCG1. beta-actin was used as an internal control. Bar graphs (means ± SEM, n=3) represent quantitative densitometric results of the upper bands. Bar graphs denoted without a common letter indicate significant difference, P<0.05. (F) RXR alpha mRNA expression was measured by RT-PCR. GAPDH was used as a housekeeping gene for the co-amplification with RXR alpha. Image collected & cropped by CiteAb from the following publication (https://www.spandidos-publications.com/10.3892/ijmm.2015.2101), licensed under a CC-BY license. Not internally tested by Novus Biologicals.
Western Blot: ABCA1 Antibody - BSA Free [NB400-105] -
Western Blot: ABCA1 Antibody - BSA Free [NB400-105] - Gas6 treatment enhances expression of LXR alpha & LXR beta & their target genes in BMDM.Mouse BMDM were stimulated with 400 ng/ml Gas6, 1 μM T0901317, 10 ng/ml interferon (IFN)-gamma, 10 ng/ml IL-4, or 100 ng/ml LPS for 4 h (a,b) or 400 ng/ml Gas6 for the indicated times (c–g). (a,b,e) The amounts of the LXR alpha, LXR beta, ABCA1, ABCG1, ApoE, AIM, Arg2, VEGF, YM1, & Arg1 mRNAs were analyzed by real-time PCR & normalized to that of Hprt mRNA. (c,d,f,g) The relative abundances of LXR alpha, LXR beta, ABCA1, ABCG1, ApoE, Aim, Arg2, & VEGF proteins were determined by Western blotting analysis. The relative densitometric intensity was determined for each band & normalized to beta-actin. Data in all bar graphs are means ± SEM of three independent experiments. *P < 0.05 compared with control. Image collected & cropped by CiteAb from the following publication (https://pubmed.ncbi.nlm.nih.gov/27406916), licensed under a CC-BY license. Not internally tested by Novus Biologicals.
Western Blot: ABCA1 Antibody - BSA Free [NB400-105] -
Western Blot: ABCA1 Antibody - BSA Free [NB400-105] - (A) Time course response of ABCA1 induction by TO-091317 & (B) upregulation of ABCA1 by purple Perilla frutescens extracts (PPE), & (C) enhancement of liver X receptor (LXR) alpha induction by PPE. J774A.1 murine macrophages were cultured with 1 μM TO-091317 or 50 μg/ml Cu2+-oxidized low-density lipoprotein (LDL) in the absence or presence of 1–10 μg/ml PPE. For the measurement of expression of (A & B) ABCA1 & (C) LXR alpha, total cell lysates were subjected to western blot analysis with a primary antibody against ABCA1 or LXR alpha. beta-actin was used as an internal control. Bar graphs (means ± SEM, n=3) represent quantitative densitometric results of the upper bands. Bar graphs denoted without a common letter indicate significant difference, P<0.05. Image collected & cropped by CiteAb from the following publication (https://www.spandidos-publications.com/10.3892/ijmm.2015.2101), licensed under a CC-BY license. Not internally tested by Novus Biologicals.

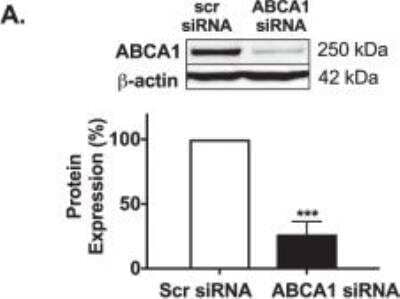
![Western Blot: ABCA1 Antibody - BSA Free [NB400-105] - ABCA1 Antibody - BSA Free](https://resources.bio-techne.com/images/products/nb400-105_rabbit-polyclonal-abca1-antibody-210202423454864.jpg)
![Western Blot: ABCA1 Antibody - BSA Free [NB400-105] - ABCA1 Antibody - BSA Free](https://resources.bio-techne.com/images/products/nb400-105_rabbit-polyclonal-abca1-antibody-210202423454876.jpg)
![Western Blot: ABCA1 Antibody - BSA Free [NB400-105] - ABCA1 Antibody - BSA Free](https://resources.bio-techne.com/images/products/nb400-105_rabbit-polyclonal-abca1-antibody-21020242345482.jpg)
![Western Blot: ABCA1 Antibody - BSA Free [NB400-105] - ABCA1 Antibody - BSA Free](https://resources.bio-techne.com/images/products/nb400-105_rabbit-polyclonal-abca1-antibody-2102024234687.jpg)
![Western Blot: ABCA1 Antibody - BSA Free [NB400-105] - ABCA1 Antibody - BSA Free](https://resources.bio-techne.com/images/products/nb400-105_rabbit-polyclonal-abca1-antibody-210202423454828.jpg)
![Western Blot: ABCA1 Antibody - BSA Free [NB400-105] - ABCA1 Antibody - BSA Free](https://resources.bio-techne.com/images/products/nb400-105_rabbit-polyclonal-abca1-antibody-310202415382446.jpg)
![Western Blot: ABCA1 Antibody - BSA Free [NB400-105] - ABCA1 Antibody - BSA Free](https://resources.bio-techne.com/images/products/nb400-105_rabbit-polyclonal-abca1-antibody-310202415384115.jpg)
![Western Blot: ABCA1 Antibody - BSA Free [NB400-105] - ABCA1 Antibody - BSA Free](https://resources.bio-techne.com/images/products/nb400-105_rabbit-polyclonal-abca1-antibody-31020241538240.jpg)
![Western Blot: ABCA1 Antibody - BSA Free [NB400-105] - ABCA1 Antibody - BSA Free](https://resources.bio-techne.com/images/products/nb400-105_rabbit-polyclonal-abca1-antibody-310202415291985.jpg)
![Western Blot: ABCA1 Antibody - BSA Free [NB400-105] - ABCA1 Antibody - BSA Free](https://resources.bio-techne.com/images/products/nb400-105_rabbit-polyclonal-abca1-antibody-310202415394516.jpg)
![Western Blot: ABCA1 Antibody - BSA Free [NB400-105] - ABCA1 Antibody - BSA Free](https://resources.bio-techne.com/images/products/nb400-105_rabbit-polyclonal-abca1-antibody-310202415392521.jpg)
![Western Blot: ABCA1 Antibody - BSA Free [NB400-105] - ABCA1 Antibody - BSA Free](https://resources.bio-techne.com/images/products/nb400-105_rabbit-polyclonal-abca1-antibody-310202415392590.jpg)
![Western Blot: ABCA1 Antibody - BSA Free [NB400-105] - ABCA1 Antibody - BSA Free](https://resources.bio-techne.com/images/products/nb400-105_rabbit-polyclonal-abca1-antibody-310202415284512.jpg)
![Western Blot: ABCA1 Antibody - BSA Free [NB400-105] - ABCA1 Antibody - BSA Free](https://resources.bio-techne.com/images/products/nb400-105_rabbit-polyclonal-abca1-antibody-310202415384110.jpg)
![Western Blot: ABCA1 Antibody - BSA Free [NB400-105] - ABCA1 Antibody - BSA Free](https://resources.bio-techne.com/images/products/nb400-105_rabbit-polyclonal-abca1-antibody-31020241534346.jpg)
![Western Blot: ABCA1 Antibody - BSA Free [NB400-105] - ABCA1 Antibody - BSA Free](https://resources.bio-techne.com/images/products/nb400-105_rabbit-polyclonal-abca1-antibody-31020241616095.jpg)
![Western Blot: ABCA1 Antibody - BSA Free [NB400-105] - ABCA1 Antibody - BSA Free](https://resources.bio-techne.com/images/products/nb400-105_rabbit-polyclonal-abca1-antibody-310202416171459.jpg)
![Western Blot: ABCA1 Antibody - BSA Free [NB400-105] - ABCA1 Antibody - BSA Free](https://resources.bio-techne.com/images/products/nb400-105_rabbit-polyclonal-abca1-antibody-310202416165615.jpg)
![Western Blot: ABCA1 Antibody - BSA Free [NB400-105] - ABCA1 Antibody - BSA Free](https://resources.bio-techne.com/images/products/nb400-105_rabbit-polyclonal-abca1-antibody-310202416182616.jpg)
![Western Blot: ABCA1 Antibody - BSA Free [NB400-105] - ABCA1 Antibody - BSA Free](https://resources.bio-techne.com/images/products/nb400-105_rabbit-polyclonal-abca1-antibody-310202416173512.jpg)
![Western Blot: ABCA1 Antibody - BSA Free [NB400-105] - ABCA1 Antibody - BSA Free](https://resources.bio-techne.com/images/products/nb400-105_rabbit-polyclonal-abca1-antibody-31020241616047.jpg)
![Western Blot: ABCA1 Antibody - BSA Free [NB400-105] - ABCA1 Antibody - BSA Free](https://resources.bio-techne.com/images/products/nb400-105_rabbit-polyclonal-abca1-antibody-310202416165626.jpg)
![Western Blot: ABCA1 Antibody - BSA Free [NB400-105] - ABCA1 Antibody - BSA Free](https://resources.bio-techne.com/images/products/nb400-105_rabbit-polyclonal-abca1-antibody-310202416165627.jpg)
![Western Blot: ABCA1 Antibody - BSA Free [NB400-105] - ABCA1 Antibody - BSA Free](https://resources.bio-techne.com/images/products/nb400-105_rabbit-polyclonal-abca1-antibody-310202416161846.jpg)
![Western Blot: ABCA1 Antibody - BSA Free [NB400-105] - ABCA1 Antibody - BSA Free](https://resources.bio-techne.com/images/products/nb400-105_rabbit-polyclonal-abca1-antibody-310202416175272.jpg)
![Western Blot: ABCA1 Antibody - BSA Free [NB400-105] - ABCA1 Antibody - BSA Free](https://resources.bio-techne.com/images/products/nb400-105_rabbit-polyclonal-abca1-antibody-31020241617529.jpg)
![Western Blot: ABCA1 Antibody - BSA Free [NB400-105] - ABCA1 Antibody - BSA Free](https://resources.bio-techne.com/images/products/nb400-105_rabbit-polyclonal-abca1-antibody-310202416161826.jpg)
![Western Blot: ABCA1 Antibody - BSA Free [NB400-105] - ABCA1 Antibody - BSA Free](https://resources.bio-techne.com/images/products/nb400-105_rabbit-polyclonal-abca1-antibody-31020241616374.jpg)
![Western Blot: ABCA1 Antibody - BSA Free [NB400-105] - ABCA1 Antibody - BSA Free](https://resources.bio-techne.com/images/products/nb400-105_rabbit-polyclonal-abca1-antibody-3102024161896.jpg)
![Western Blot: ABCA1 Antibody - BSA Free [NB400-105] - ABCA1 Antibody - BSA Free](https://resources.bio-techne.com/images/products/nb400-105_rabbit-polyclonal-abca1-antibody-310202416171457.jpg)
![Western Blot: ABCA1 Antibody - BSA Free [NB400-105] - ABCA1 Antibody - BSA Free](https://resources.bio-techne.com/images/products/nb400-105_rabbit-polyclonal-abca1-antibody-310202416163770.jpg)
![Western Blot: ABCA1 Antibody - BSA Free [NB400-105] - ABCA1 Antibody - BSA Free](https://resources.bio-techne.com/images/products/nb400-105_rabbit-polyclonal-abca1-antibody-310202416173523.jpg)
![Western Blot: ABCA1 Antibody - BSA Free [NB400-105] - ABCA1 Antibody - BSA Free](https://resources.bio-techne.com/images/products/nb400-105_rabbit-polyclonal-abca1-antibody-310202416163724.jpg)
![Western Blot: ABCA1 Antibody - BSA Free [NB400-105] - ABCA1 Antibody - BSA Free](https://resources.bio-techne.com/images/products/nb400-105_rabbit-polyclonal-abca1-antibody-310202416175212.jpg)
![Western Blot: ABCA1 Antibody - BSA Free [NB400-105] - ABCA1 Antibody - BSA Free](https://resources.bio-techne.com/images/products/nb400-105_rabbit-polyclonal-abca1-antibody-31020241616059.jpg)
![Western Blot: ABCA1 Antibody - BSA Free [NB400-105] - ABCA1 Antibody - BSA Free](https://resources.bio-techne.com/images/products/nb400-105_rabbit-polyclonal-abca1-antibody-310202416171495.jpg)
![Western Blot: ABCA1 Antibody - BSA Free [NB400-105] - ABCA1 Antibody - BSA Free](https://resources.bio-techne.com/images/products/nb400-105_rabbit-polyclonal-abca1-antibody-31020241616076.jpg)
![Western Blot: ABCA1 Antibody - BSA Free [NB400-105] - ABCA1 Antibody - BSA Free](https://resources.bio-techne.com/images/products/nb400-105_rabbit-polyclonal-abca1-antibody-31020241618917.jpg)
![Western Blot: ABCA1 Antibody - BSA Free [NB400-105] - ABCA1 Antibody - BSA Free](https://resources.bio-techne.com/images/products/nb400-105_rabbit-polyclonal-abca1-antibody-310202416171478.jpg)
![Western Blot: ABCA1 Antibody - BSA Free [NB400-105] - ABCA1 Antibody - BSA Free](https://resources.bio-techne.com/images/products/nb400-105_rabbit-polyclonal-abca1-antibody-310202416161816.jpg)
![Western Blot: ABCA1 Antibody - BSA Free [NB400-105] - ABCA1 Antibody - BSA Free](https://resources.bio-techne.com/images/products/nb400-105_rabbit-polyclonal-abca1-antibody-310202416161840.jpg)
![Western Blot: ABCA1 Antibody - BSA Free [NB400-105] - ABCA1 Antibody - BSA Free](https://resources.bio-techne.com/images/products/nb400-105_rabbit-polyclonal-abca1-antibody-31020241616034.jpg)
![Western Blot: ABCA1 Antibody - BSA Free [NB400-105] - ABCA1 Antibody - BSA Free](https://resources.bio-techne.com/images/products/nb400-105_rabbit-polyclonal-abca1-antibody-310202416175262.jpg)
![Western Blot: ABCA1 Antibody - BSA Free [NB400-105] - ABCA1 Antibody - BSA Free](https://resources.bio-techne.com/images/products/nb400-105_rabbit-polyclonal-abca1-antibody-310202416175244.jpg)
![Western Blot: ABCA1 Antibody - BSA Free [NB400-105] - ABCA1 Antibody - BSA Free](https://resources.bio-techne.com/images/products/nb400-105_rabbit-polyclonal-abca1-antibody-31020241616565.jpg)