Detection of Human CD81 by Western Blot
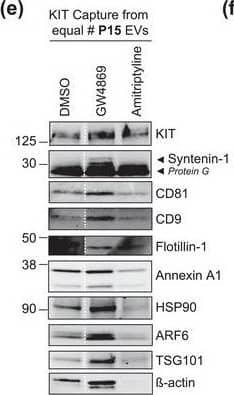
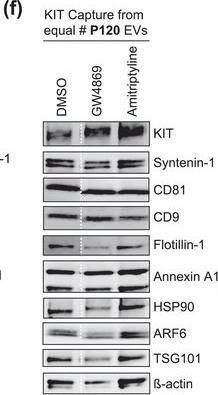
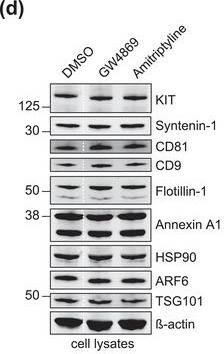
The protein loading of KIT‐EVs shifts among vesicle subtypes after cell treatment with SMase inhibitors. (A) Viability assessment of HMC‐1.1 cells at the end of the 16 h treatment with DMSO (vehicle control), 10 μM GW4869 (n‐SMase inhibitor) or 10 μM amitriptyline (a‐SMase inhibitor) to control for potential drug‐induced cell death. Data are presented as mean ± S.D. from three independent experiments, normalized to the control. (B, C) EVs released by control‐ or inhibitor‐treated HMC‐1.1 cells were pelleted as P15 (B) or P120 (C) EVs and evaluated by nanoparticle tracking. The sum of P15 (B) or P120 (C) EVs (ranging from 0 to 250 nm) released under each condition was plotted. Representative data are shown as mean ± S.D. from five repetitions. Ns, not significant; **, 0.0011; ****p < 0.0001 (two‐tailed, unpaired Student t‐test). (D) Total lysates (30 μg) of DMSO‐ or inhibitor‐treated cells were analyzed by immunoblotting with the indicated antibodies. (E,F) KIT‐EVs were captured with an antibody against N‐terminal KIT from P15 (3.4 × 10⁸ EVs) (E) or P120 (2.6 × 10⁹ EVs) (F) vesicles released by control, GW4869‐ or amitriptyline‐treated cells. Total KIT‐EV lysates were evaluated by Western blotting; representative blots are shown. (G,H) Signal intensities of proteins in KIT‐EVs (E,F) were quantified and normalized to the DMSO control. Up‐ or down‐regulation (indicated by arrows) of protein content in P15 and P120 KIT‐EVs in response to GW4869 (G) or amitriptyline (H) is displayed in Volcano graphs (n = 3). The q‐value is the FDR‐adjusted p‐value, and the dashed line indicates the significance threshold. In D, E and F, dashed lines imply lanes from the same blot that were not loaded contiguously Image collected and cropped by CiteAb from the following open publication (https://pubmed.ncbi.nlm.nih.gov/36239715), licensed under a CC-BY license. Not internally tested by R&D Systems.
Detection of Human CD81 by Western Blot
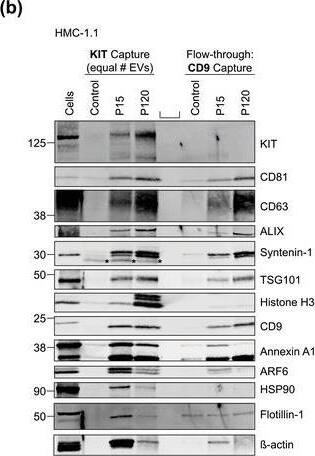
Mast cells produce microvesicle (P15)‐&exosome (P120)‐like KIT‐EVs. (B) KIT‐EVs purified from P15 or P120 EVs (8.9 × 10⁹ EVs) by immunoprecipitation with an antibody against N‐terminal KIT. EVs in the flow‐through captured with CD9‐conjugated beads. Unconjugated beads&a mix of P15&P120 vesicles used as a negative control. Cell lysates (30 μg)&EV eluates analyzed by WB with the indicated antibodies. Representative blots are shown. *, indicates bands arising from protein G. Image collected & cropped by CiteAb from the following open publication (https://pubmed.ncbi.nlm.nih.gov/36239715), licensed under a CC-BY license. Not internally tested by R&D Systems.
Detection of Human CD81 by Western Blot
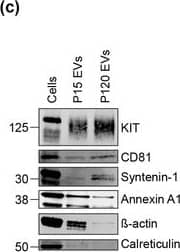
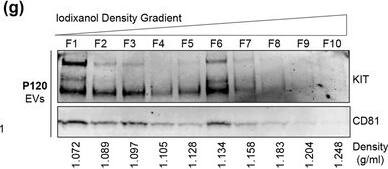
KIT‐EVs are released as heterogeneous subpopulations with different physical properties. (A) Cell culture supernatant was subjected to differential ultracentrifugation to obtain P15 and P120 EV pellets, as illustrated. Where indicated, P15 and P120 EVs were further separated by iodixanol density gradients. Vesicles from each density fraction were pelleted and analyzed. (B) P15 and P120 EVs obtained from HMC‐1.1 cells were analyzed by nanoparticle tracking. Representative concentration and size profiles averaged from five workflow repetitions are depicted. The averaged percentage (%) of different size ranges within the P15 or P120 population is shown on top (bar chart). (C) Representative Western blot of HMC‐1.1 cell, P15 and P120 EV lysates (30 μg) probed with the indicated antibodies. (D, E) HMC‐1.1‐derived P15 (D) or P120 (E) EV pellets were separated by density gradients and the vesicles from each fraction (F1‐F10) were analyzed by nanoparticle tracking for concentration (particles/ml), shown as box plots, and size (represented as average mode, nm), shown as a line graph. Data in the box plots represent the median with the whiskers indicating minimum and maximum values; data in the line graph are represented as mean ± S.D. from five repetitions. Representative results are shown. (F, G) Representative immunoblots showing the presence of KIT and annexin A1 in P15 EV fractions (F) and KIT and CD81 in P120 EV fractions (G). The density (g/ml) of each fraction is indicated below Image collected and cropped by CiteAb from the following open publication (https://pubmed.ncbi.nlm.nih.gov/36239715), licensed under a CC-BY license. Not internally tested by R&D Systems.
Detection of Human CD81 by Western Blot
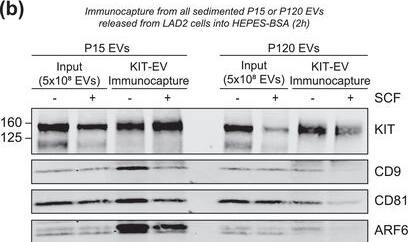
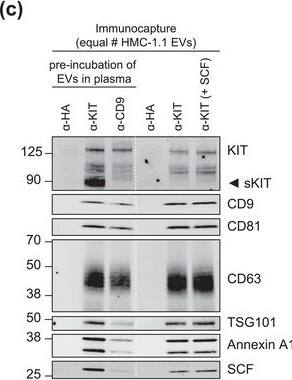
KIT‐EV immunocapture of LAD2 huMC EVs and KIT‐EV recovery from spiked plasma. (A) Cytokine‐starved LAD2 huMCs were treated or not with stem cell factor (SCF; 100 ng/ml) for 2 h in HEPES‐BSA buffer. Cell lysates (30 μg) were analyzed by immunoblotting with the indicated antibodies. (B) EVs released into the supernatant by 18 × 106 LAD2 cells treated or not with SCF for 2 h were sedimented by differential ultracentrifugation into P15 and P120 EVs. KIT‐EV immunocapture was performed (KIT antibody AF332) from all sedimented LAD2 P15 and P120 EVs. The total bead elution was loaded and analyzed by Western blotting with the indicated antibodies. Input EV lysates (5 × 10⁸) were included. Representative blots are shown. (C) HMC‐1.1 cell line‐derived EVs (1.2 × 10¹⁰ EVs) were incubated or not in human normal plasma and captured with a KIT antibody (AF332) or by CD9 antibody‐conjugated beads. A goat HA antibody served as a negative isotype control. Representative blots are shown. sKIT, soluble KIT that is present in plasma. Dashed lines imply lanes from the same blot that were not loaded contiguously Image collected and cropped by CiteAb from the following open publication (https://pubmed.ncbi.nlm.nih.gov/36239715), licensed under a CC-BY license. Not internally tested by R&D Systems.
Detection of Human CD81 by Western Blot
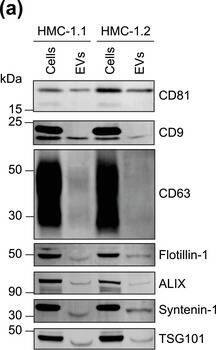
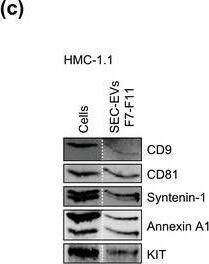
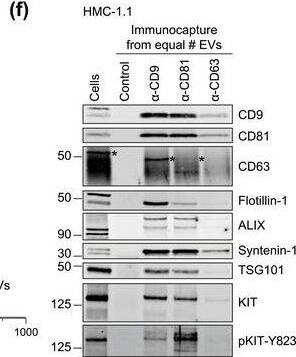
HMC‐1‐derived EVs contain KIT and canonical EV protein markers. (A, B) Detection of canonical EV marker (A) and mast cell marker proteins (B) as well as calreticulin as an exclusion marker in HMC‐1.1 and HMC‐1.2 cells and secreted EVs. 30 μg of protein of cell or EV lysates were separated by SDS‐PAGE, blotted and probed with the indicated antibodies. (C) HMC‐1.1‐derived EVs were separated from soluble protein by size exclusion chromatography (SEC; qEVoriginal70) and eluted as pooled fractions F7‐F11, followed by filter concentration. Cell (30 μg) and EV lysates (15 μg) were analyzed by immunoblotting with the indicated antibodies. The dashed line indicates the samples were run on the same blot, but not in contiguous lanes. (D) A representative graph showing the concentration and size measurement of SEC‐isolated EVs (C) by nanoparticle tracking. The average profile of five workflow repetitions is displayed. (E) Workflow of the immunocapture of EV subpopulations. EVs are bulk‐isolated from pre‐cleared cell culture media by PEG‐precipitation and incubated with antibody‐conjugated beads allowing for immunocapture of specific EV subpopulations. (F) Representative Western blot of CD9‐, CD81‐ and CD63‐immunocaptured EVs. Each bead capture was performed from an equal number of HMC‐1.1‐derived EVs (1.9 × 10¹⁰ EVs). Unconjugated beads served as a negative control. The presence of canonical EV protein markers as well as KIT in the EV subpopulations were determined by immunoblotting. *, signal from previous probing with a flotillin‐1 antibody Image collected and cropped by CiteAb from the following open publication (https://pubmed.ncbi.nlm.nih.gov/36239715), licensed under a CC-BY license. Not internally tested by R&D Systems.
Detection of Human CD81 by Western Blot
The protein loading of KIT‐EVs shifts among vesicle subtypes after cell treatment with SMase inhibitors. (A) Viability assessment of HMC‐1.1 cells at the end of the 16 h treatment with DMSO (vehicle control), 10 μM GW4869 (n‐SMase inhibitor) or 10 μM amitriptyline (a‐SMase inhibitor) to control for potential drug‐induced cell death. Data are presented as mean ± S.D. from three independent experiments, normalized to the control. (B, C) EVs released by control‐ or inhibitor‐treated HMC‐1.1 cells were pelleted as P15 (B) or P120 (C) EVs and evaluated by nanoparticle tracking. The sum of P15 (B) or P120 (C) EVs (ranging from 0 to 250 nm) released under each condition was plotted. Representative data are shown as mean ± S.D. from five repetitions. Ns, not significant; **, 0.0011; ****p < 0.0001 (two‐tailed, unpaired Student t‐test). (D) Total lysates (30 μg) of DMSO‐ or inhibitor‐treated cells were analyzed by immunoblotting with the indicated antibodies. (E,F) KIT‐EVs were captured with an antibody against N‐terminal KIT from P15 (3.4 × 10⁸ EVs) (E) or P120 (2.6 × 10⁹ EVs) (F) vesicles released by control, GW4869‐ or amitriptyline‐treated cells. Total KIT‐EV lysates were evaluated by Western blotting; representative blots are shown. (G,H) Signal intensities of proteins in KIT‐EVs (E,F) were quantified and normalized to the DMSO control. Up‐ or down‐regulation (indicated by arrows) of protein content in P15 and P120 KIT‐EVs in response to GW4869 (G) or amitriptyline (H) is displayed in Volcano graphs (n = 3). The q‐value is the FDR‐adjusted p‐value, and the dashed line indicates the significance threshold. In D, E and F, dashed lines imply lanes from the same blot that were not loaded contiguously Image collected and cropped by CiteAb from the following open publication (https://pubmed.ncbi.nlm.nih.gov/36239715), licensed under a CC-BY license. Not internally tested by R&D Systems.
Detection of Human CD81 by Western Blot
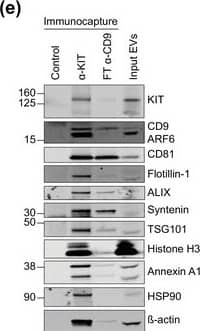
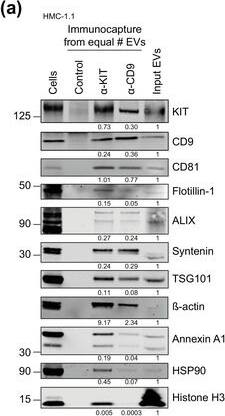
KIT‐captured EVs reveal distinct EV marker profiles compared to CD9‐enriched vesicles. (A) Comparison of KIT‐ vs. CD9‐captured EV populations. Each EV immunoprecipitation was performed from an equal number of EVs (3.5 × 10¹⁰ EVs),&the protein content was assessed by immunoblotting. Unconjugated beads served as a negative control. KIT‐EV immunocapture was performed with an antibody against N‐terminal KIT. Representative blots are shown. Signal intensities of precipitated proteins normalized to the adjusted shown input (the input equalled 8.9% of the starting material of an IP)&indicated below each blot. Cell lysates (30 μg) loaded in the first lane. Image collected & cropped by CiteAb from the following open publication (https://pubmed.ncbi.nlm.nih.gov/36239715), licensed under a CC-BY license. Not internally tested by R&D Systems.
Detection of Human CD81 by Western Blot
KIT‐EV immunocapture of LAD2 huMC EVs and KIT‐EV recovery from spiked plasma. (A) Cytokine‐starved LAD2 huMCs were treated or not with stem cell factor (SCF; 100 ng/ml) for 2 h in HEPES‐BSA buffer. Cell lysates (30 μg) were analyzed by immunoblotting with the indicated antibodies. (B) EVs released into the supernatant by 18 × 106 LAD2 cells treated or not with SCF for 2 h were sedimented by differential ultracentrifugation into P15 and P120 EVs. KIT‐EV immunocapture was performed (KIT antibody AF332) from all sedimented LAD2 P15 and P120 EVs. The total bead elution was loaded and analyzed by Western blotting with the indicated antibodies. Input EV lysates (5 × 10⁸) were included. Representative blots are shown. (C) HMC‐1.1 cell line‐derived EVs (1.2 × 10¹⁰ EVs) were incubated or not in human normal plasma and captured with a KIT antibody (AF332) or by CD9 antibody‐conjugated beads. A goat HA antibody served as a negative isotype control. Representative blots are shown. sKIT, soluble KIT that is present in plasma. Dashed lines imply lanes from the same blot that were not loaded contiguously Image collected and cropped by CiteAb from the following open publication (https://pubmed.ncbi.nlm.nih.gov/36239715), licensed under a CC-BY license. Not internally tested by R&D Systems.
Detection of Human CD81 by Western Blot
HMC‐1‐derived EVs contain KIT and canonical EV protein markers. (A, B) Detection of canonical EV marker (A) and mast cell marker proteins (B) as well as calreticulin as an exclusion marker in HMC‐1.1 and HMC‐1.2 cells and secreted EVs. 30 μg of protein of cell or EV lysates were separated by SDS‐PAGE, blotted and probed with the indicated antibodies. (C) HMC‐1.1‐derived EVs were separated from soluble protein by size exclusion chromatography (SEC; qEVoriginal70) and eluted as pooled fractions F7‐F11, followed by filter concentration. Cell (30 μg) and EV lysates (15 μg) were analyzed by immunoblotting with the indicated antibodies. The dashed line indicates the samples were run on the same blot, but not in contiguous lanes. (D) A representative graph showing the concentration and size measurement of SEC‐isolated EVs (C) by nanoparticle tracking. The average profile of five workflow repetitions is displayed. (E) Workflow of the immunocapture of EV subpopulations. EVs are bulk‐isolated from pre‐cleared cell culture media by PEG‐precipitation and incubated with antibody‐conjugated beads allowing for immunocapture of specific EV subpopulations. (F) Representative Western blot of CD9‐, CD81‐ and CD63‐immunocaptured EVs. Each bead capture was performed from an equal number of HMC‐1.1‐derived EVs (1.9 × 10¹⁰ EVs). Unconjugated beads served as a negative control. The presence of canonical EV protein markers as well as KIT in the EV subpopulations were determined by immunoblotting. *, signal from previous probing with a flotillin‐1 antibody Image collected and cropped by CiteAb from the following open publication (https://pubmed.ncbi.nlm.nih.gov/36239715), licensed under a CC-BY license. Not internally tested by R&D Systems.
Detection of Human CD81 by Western Blot
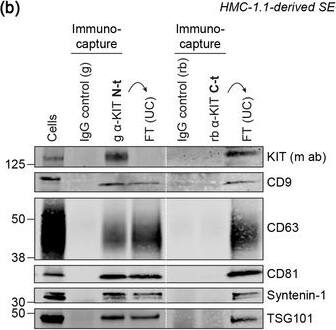
KIT‐containing EVs can be isolated by immunocapture. (B) Representative immunoblots showing the canonical EV marker content of KIT‐EVs captured from HMC‐1.1‐derived EVs that isolated by size exclusion chromatography (SEC). Three different antibodies directed against N‐t, C‐t (left panel) or full‐length (fl) KIT protein (right panel) used for immunocapturing of KIT‐containing EVs. Each pulldown was performed from vesicles secreted by 20 × 106 cells&collected in SEC fractions seven to nine. Unbound EVs in the flow‐through (FT) pelleted by ultracentrifugation (UC) to demonstrate the capture efficiency. Beads conjugated to isotype control antibodies served as negative controls. Cell lysates (30 μg) included. g, goat; rb, rabbit; m, mouse. Dashed lines imply lanes from the same blot that not loaded contiguously. Image collected & cropped by CiteAb from the following open publication (https://pubmed.ncbi.nlm.nih.gov/36239715), licensed under a CC-BY license. Not internally tested by R&D Systems.
Detection of Human CD81 by Western Blot
The protein loading of KIT‐EVs shifts among vesicle subtypes after cell treatment with SMase inhibitors. (A) Viability assessment of HMC‐1.1 cells at the end of the 16 h treatment with DMSO (vehicle control), 10 μM GW4869 (n‐SMase inhibitor) or 10 μM amitriptyline (a‐SMase inhibitor) to control for potential drug‐induced cell death. Data are presented as mean ± S.D. from three independent experiments, normalized to the control. (B, C) EVs released by control‐ or inhibitor‐treated HMC‐1.1 cells were pelleted as P15 (B) or P120 (C) EVs and evaluated by nanoparticle tracking. The sum of P15 (B) or P120 (C) EVs (ranging from 0 to 250 nm) released under each condition was plotted. Representative data are shown as mean ± S.D. from five repetitions. Ns, not significant; **, 0.0011; ****p < 0.0001 (two‐tailed, unpaired Student t‐test). (D) Total lysates (30 μg) of DMSO‐ or inhibitor‐treated cells were analyzed by immunoblotting with the indicated antibodies. (E,F) KIT‐EVs were captured with an antibody against N‐terminal KIT from P15 (3.4 × 10⁸ EVs) (E) or P120 (2.6 × 10⁹ EVs) (F) vesicles released by control, GW4869‐ or amitriptyline‐treated cells. Total KIT‐EV lysates were evaluated by Western blotting; representative blots are shown. (G,H) Signal intensities of proteins in KIT‐EVs (E,F) were quantified and normalized to the DMSO control. Up‐ or down‐regulation (indicated by arrows) of protein content in P15 and P120 KIT‐EVs in response to GW4869 (G) or amitriptyline (H) is displayed in Volcano graphs (n = 3). The q‐value is the FDR‐adjusted p‐value, and the dashed line indicates the significance threshold. In D, E and F, dashed lines imply lanes from the same blot that were not loaded contiguously Image collected and cropped by CiteAb from the following open publication (https://pubmed.ncbi.nlm.nih.gov/36239715), licensed under a CC-BY license. Not internally tested by R&D Systems.


