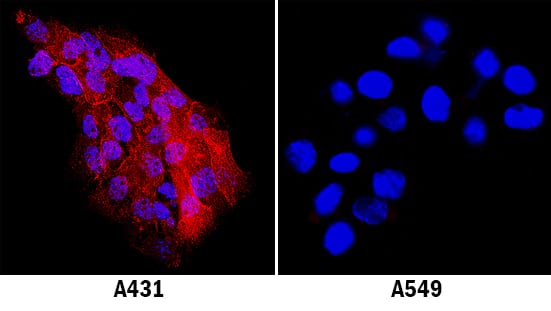
Detection of Human ICAM-1/CD54 by Immunocytochemistry/Immunofluorescence
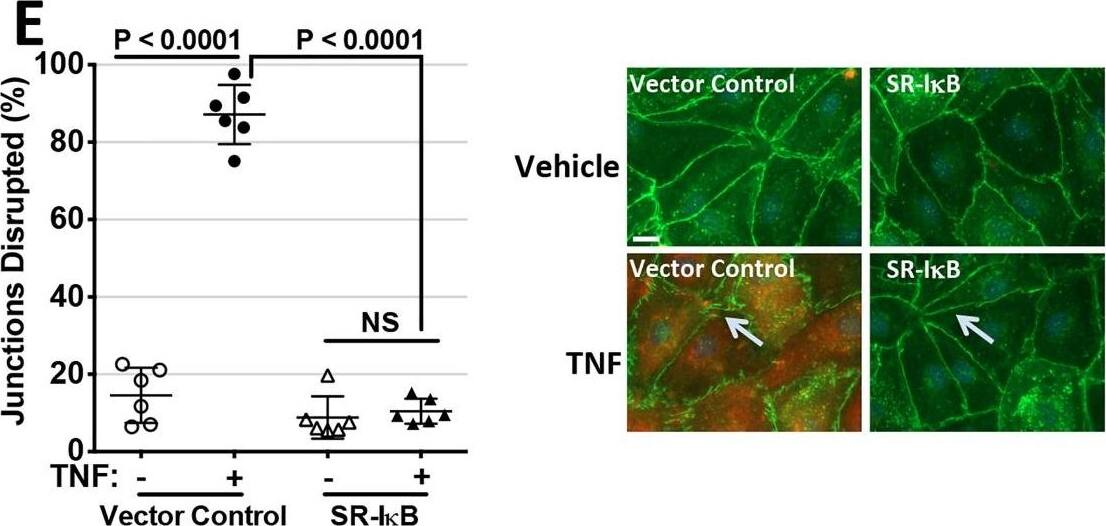
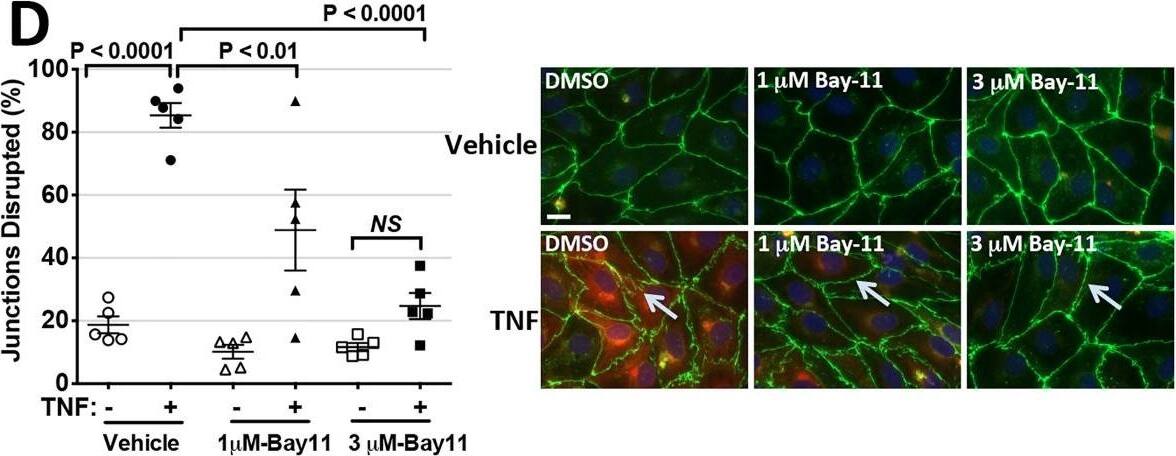
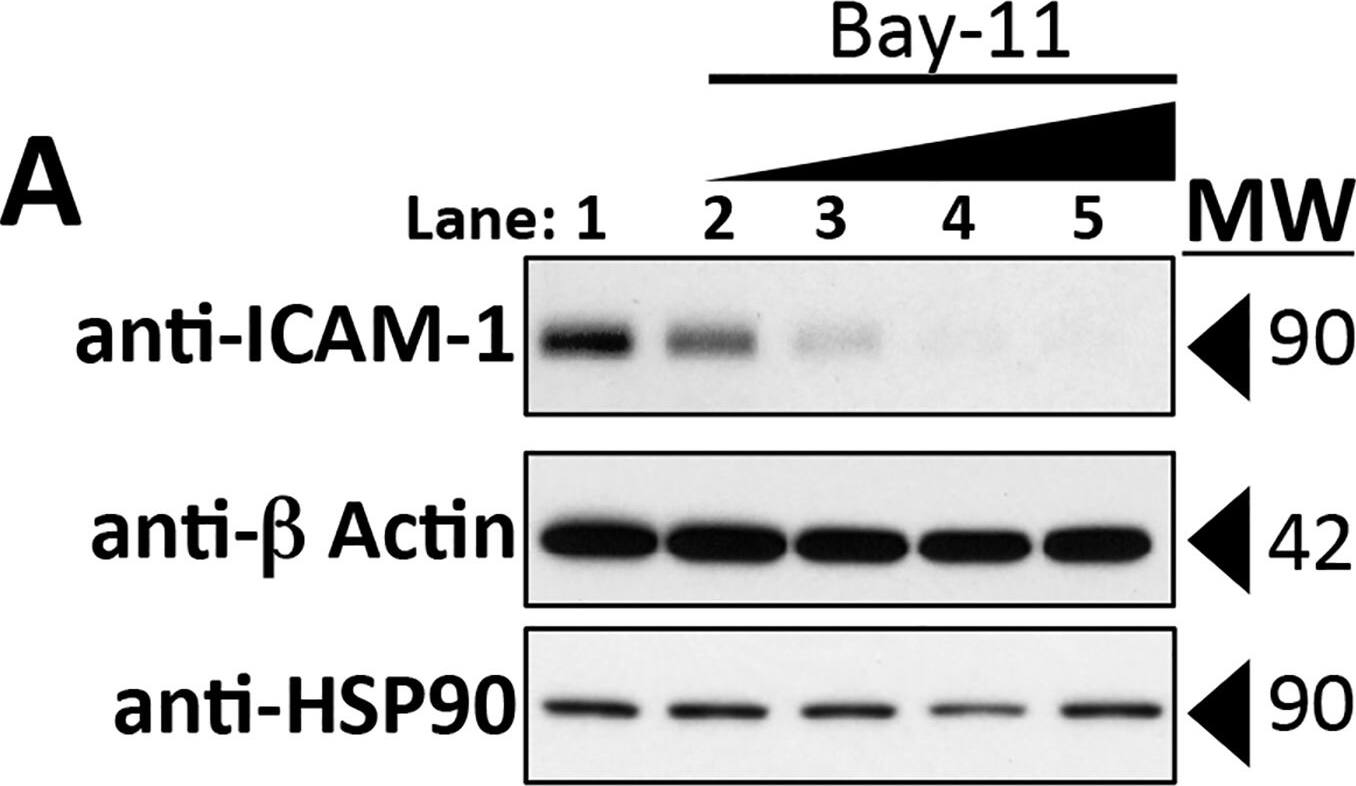
Requirement of NF-kappa B activation for cytokine-mediated reductions in TEER.A: Concentration-dependent inhibition of induction of ICAM-1 expression by I kappaK-beta -inhibitor Bay11, confirming the effect of Bay11 on TNF induction of NF-kappa B-dependent genes. Conditions are lane 1, DMSO Control; lanes, 2, 3, 4 and 5, Bay11 at 0.375, 0.75, 1.5 and 3.0 μM, respectively all after 0.8 ng/ml TNF for 16 hours. B: Effect of Bay11 concentration on the TNF-induced TEER decrease. ECIS analysis. X-axis: Duration of 0.8 ng/ml TNF treatment. Y-axis: TEER (ohms) normalized to basal barrier level prior to addition of TNF. TEER levels were not affected by these concentrations of Bay11 in the absence of TNF (not shown). The corrected basal TEER for this experiment was 69.9 ± 1.3 Ω·cm2. n = 6,6,6,6. C: Effects of SR-I kappaB dominant negative overexpression on HDMEC barrier responses. Upper panel: A time course of TNF treatment (1 ng/ml for 12 h) in control-transduced (black trace) and SR-I kappaB-transduced (red trace) HDMEC. n = 4,4. Lower panel: A time course of thrombin (1 U/ml for 12 h) in control-transduced (black trace) and SR-I kappaB-transduced (red trace) HDMEC. The corrected basal TEER for this experiment was 72.4 ± 0.9 Ω·cm2 for SR-I kappaB-transduced HDMEC and 80.0 ± 0.7 Ω·cm2 for vector control-transduced HDMEC. n = 3,3. Note that the phase 1 and phase 2 decreases initiated by TNF are markedly inhibited in SR-I kappaB-relative to control-transduced HDMEC but that thrombin-induced TEER decreases are similar in the same control- and SR-I kappaB-transduced HDMEC lines. D: Effects of Bay11 (used at 1 or 3 μM as labeled) on disruption of CL5 staining by 6 hours of TNF at 10 ng/ml. Morphometric measurements of TNF-induced disruption of CL5 junctional staining as described in the Methods (left). Immunofluorescence images representative of those used to assess the extent of disruption (right). Anti-CL5 (green), and anti-ICAM (red). Scale bar, 15 μm. E: Effects of SR-I kappaB transduction on disruption of CL5 staining by 6 hours of TNF at 10 ng/ml. Morphometric measurements (left) and representative immunofluorescence (right) images as in (D). Anti-CL5 (green), and anti-ICAM (red). Scale bar, 15 μm. Note that Bay 11 and SR-I kappaB each prevented the induction of ICAM-1 as well as the induction of a disrupted pattern of anti-CL5 immunofluorescence staining (arrows in D and E) by TNF. F: Effects of SR-I kappaB dominant negative overexpression on IL-1 beta-leak (ECIS). Note that IL-1 beta over a 12 hour time course was ineffective at decreasing TEER in SR-I kappaB-transduced HDMEC. The corrected basal TEER for this experiment was 64.5 ± 2.8 Ω·cm2 for SR-I kappaB-transduced HDMEC and 59.6 ± 1.1 Ω·cm2 for vector control-transduced HDMEC. n = 3,3. Representative of 3 (A, B and C) or 2 (D, E and F) independent experiments with similar results. Image collected and cropped by CiteAb from the following publication (https://dx.plos.org/10.1371/journal.pone.0120075), licensed under a CC-BY license. Not internally tested by R&D Systems.
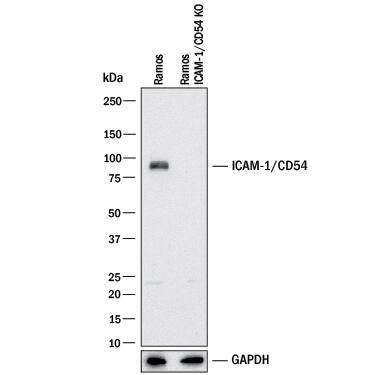
Detection of Human ICAM-1/CD54 by Western Blot
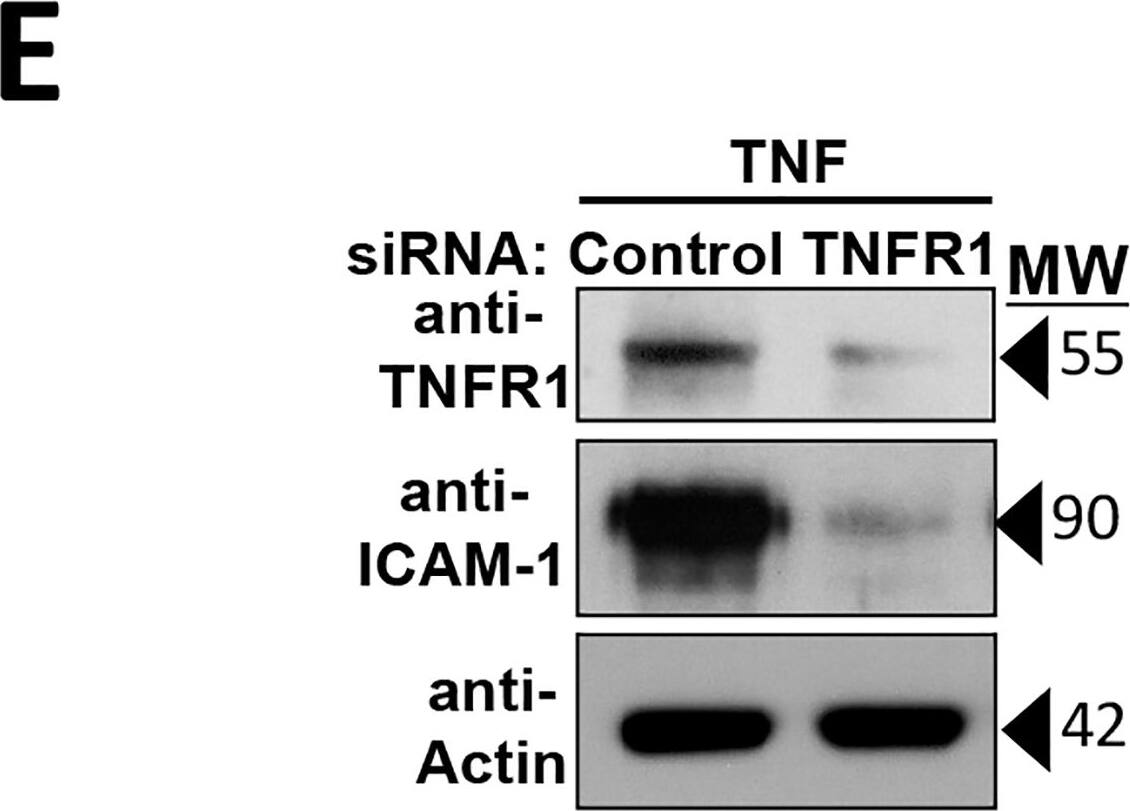
Kinetics and dose response of distinct changes to HDMEC barriers induced by TNF and IL-beta.A: Relationship of the early TNF-induced TEER increase to basal TEER levels. A plot of the percent increase over basal TEER values (measured at the peak of the TNF-induced TEER increase, mean 0.7±0.01 hours; y-axis) vs. basal TEER (reported in ohms and read on a 96W20idf ECIS array; x-axis). TNF concentration was 20 ng/ml. The inverse correlation of basal TEER to the early TEER increase is statistically significant by a two-tailed Pearson analysis (p = 0.021 in 10 independent experiments). B: TNF induction of an early TEER rise and a bi-phasic TEER decrease. Labels indicate the peak of the early TEER increase and two distinct phases of TEER decrease (as nadirs to phases 1 and 2). X-axis, duration of incubation in 20 ng/ml TNF (units, hours); y-axis, in units of normalized TEER calculated as a ratio of TEER measurements taken post-TNF to the basal TEER level read before adding TNF, which is set at 1.0 (for a further explanation, please see Methods). The corrected basal TEER for this experiment was 63.7±1.2 Ω·cm2. n = 4,8 for vehicle, TNF. C: Relationship of TNF concentration to the decrease in TEER measured at the observed nadirs to phase 1 and phase 2. Example of data used to calculate EC50 values. Goodness of the non-linear regression curve fits are expressed as R-squared values. The corrected basal TEER for this experiment was 80.7± 0.8 Ω·cm2. D: Recovery of HDMEC barrier integrity relative to TNF concentration. TEER values show an inverse concentration-dependent recovery from phase 2 nadir levels (red trace) to pre-TNF basal levels in the continuous presence of TNF for 18 hours (black trace). The corrected basal TEER for this experiment was 57.5 ± 0.5 Ω·cm2. E: Effect of TNFR1 siRNA knockdown on TNF leak. Immunoblot analysis of siRNA silencing of TNFR1 expression confirmed by an inhibition of ICAM-1 expression (left) and ECIS analysis of the requirement for TNFR1 in TNF leak (right, y-axis TEER normalized to T0). The corrected basal TEER for this experiment was 75.6 ± 2.2 Ω·cm2 for TNFR1 siRNA-transfected HDMEC and 81.0 ± 1.2 Ω·cm2 for negative control siRNA-transfected HDMEC. Mean values are indicated by horizontal bars, n = 3,3) each at 10 hours of TNF at 0.8 ng/ml. MW, protein apparent molecular weight in kDa. F) Time course of discrete IL-beta -induced changes in TEER (ECIS plot). Note that like TNF, IL-beta (20 ng/ml) produced an initial small rise in TEER followed by two distinct phases of TEER decrease. The corrected basal TEER for this experiment was 72.0 ± 1.5 Ω·cm2. n = 3,3. Representative of 10 (A), 12 (B), 3 (C, D and F) or 2 (E) independent experiments with similar results. Image collected and cropped by CiteAb from the following publication (https://dx.plos.org/10.1371/journal.pone.0120075), licensed under a CC-BY license. Not internally tested by R&D Systems.
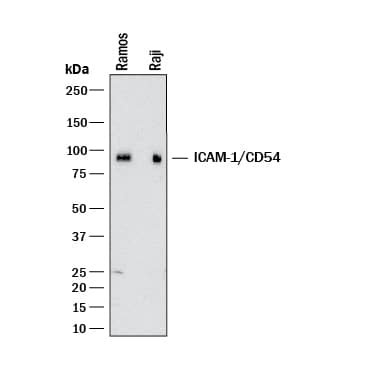
Detection of Human ICAM-1/CD54 by Western Blot
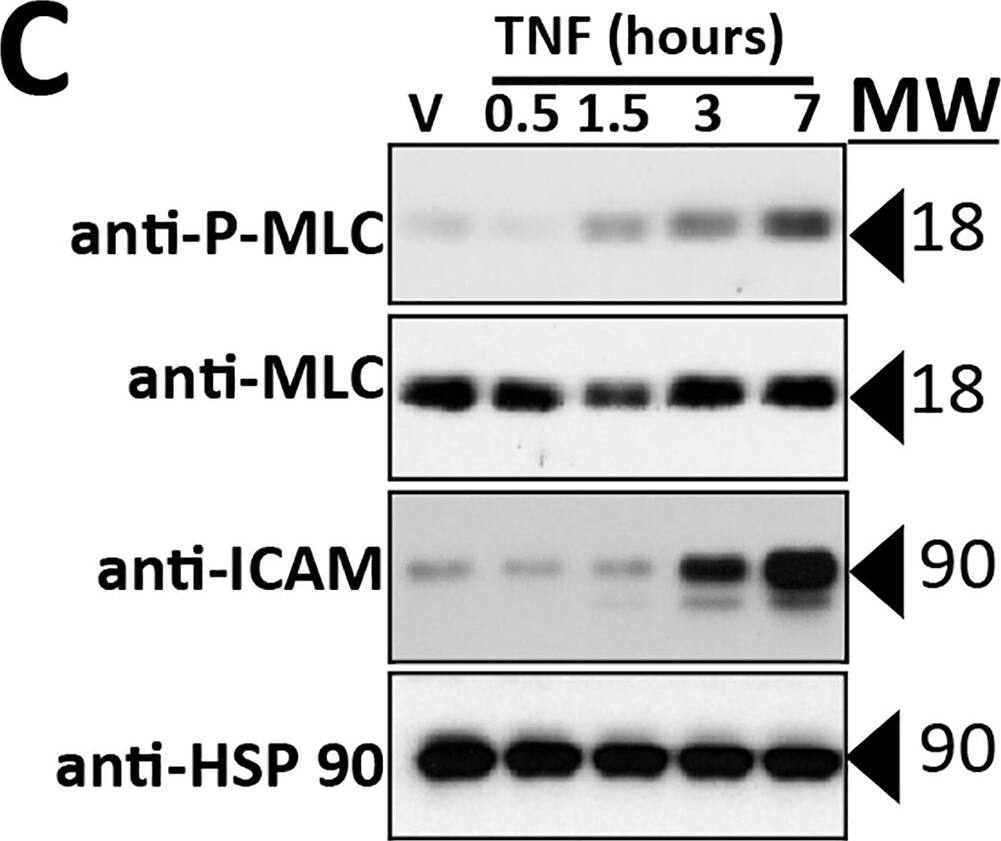
Effects of TNF on the actin cytoskeleton and MLC phosphorylation.A) Analysis of the effects of TNF on actin/CL5 co-localization. Post-confluent HDMEC monolayers immunostained with anti-CL5 and phalloidin-stained for actin were imaged by fluorescence microscopy and analyzed for co-localization as described. Actin/CL5 co-localization was lost after TNF treatment for 8 hours at 0.8 ng/ml, resulting in a statistically significant difference in the Pearson correlation co-efficient (y-axis) by two-tailed t-test. B) Immunofluorescence microscopy representative of the data in Fig. 4. Co-localization of the cortical actin cytoskeleton with junctional CL5 in DMSO control HDMEC (arrow in left panel; phalloidin staining, red; anti-CL5, green) is dissociated by TNF (center panel), a change prevented by Bay11 (right panel). Scale bar, 15 μm. C) Time course of TNF-induced changes in MLC (Thr18/Ser19) phosphorylation and ICAM-1 levels measured by immunoblotting with controls for total MLC and for beta-actin. TNF treatment for the times indicated was at 10 ng/ml. D) Dose response of TNF-induced changes in phospho-MLC levels assessed by immunoblot analysis. HDMEC lysates were harvested at 6 hours of TNF. E) Effect of Bay11 on changes in P-MLC levels induced by TNF. Bay-11 was used at a 3 μM concentration. F) Effect of SR-I kappaB on changes in P-MLC levels induced by TNF. In E and F) TNF treatment was for 6 hours at 0.8 ng/ml. Note that Bay11 and SR-I kappaB each inhibit TNF-induced increases in ICAM-1 protein levels as well as MLC phosphorylation. Representative of 2 (B, E) or 3 (C, D, F) independent experiments with similar results. Image collected and cropped by CiteAb from the following publication (https://dx.plos.org/10.1371/journal.pone.0120075), licensed under a CC-BY license. Not internally tested by R&D Systems.
Detection of Human ICAM-1/CD54 by Western Blot
Requirement of NF-kappa B activation for cytokine-mediated reductions in TEER.A: Concentration-dependent inhibition of induction of ICAM-1 expression by I kappaK-beta -inhibitor Bay11, confirming the effect of Bay11 on TNF induction of NF-kappa B-dependent genes. Conditions are lane 1, DMSO Control; lanes, 2, 3, 4 and 5, Bay11 at 0.375, 0.75, 1.5 and 3.0 μM, respectively all after 0.8 ng/ml TNF for 16 hours. B: Effect of Bay11 concentration on the TNF-induced TEER decrease. ECIS analysis. X-axis: Duration of 0.8 ng/ml TNF treatment. Y-axis: TEER (ohms) normalized to basal barrier level prior to addition of TNF. TEER levels were not affected by these concentrations of Bay11 in the absence of TNF (not shown). The corrected basal TEER for this experiment was 69.9 ± 1.3 Ω·cm2. n = 6,6,6,6. C: Effects of SR-I kappaB dominant negative overexpression on HDMEC barrier responses. Upper panel: A time course of TNF treatment (1 ng/ml for 12 h) in control-transduced (black trace) and SR-I kappaB-transduced (red trace) HDMEC. n = 4,4. Lower panel: A time course of thrombin (1 U/ml for 12 h) in control-transduced (black trace) and SR-I kappaB-transduced (red trace) HDMEC. The corrected basal TEER for this experiment was 72.4 ± 0.9 Ω·cm2 for SR-I kappaB-transduced HDMEC and 80.0 ± 0.7 Ω·cm2 for vector control-transduced HDMEC. n = 3,3. Note that the phase 1 and phase 2 decreases initiated by TNF are markedly inhibited in SR-I kappaB-relative to control-transduced HDMEC but that thrombin-induced TEER decreases are similar in the same control- and SR-I kappaB-transduced HDMEC lines. D: Effects of Bay11 (used at 1 or 3 μM as labeled) on disruption of CL5 staining by 6 hours of TNF at 10 ng/ml. Morphometric measurements of TNF-induced disruption of CL5 junctional staining as described in the Methods (left). Immunofluorescence images representative of those used to assess the extent of disruption (right). Anti-CL5 (green), and anti-ICAM (red). Scale bar, 15 μm. E: Effects of SR-I kappaB transduction on disruption of CL5 staining by 6 hours of TNF at 10 ng/ml. Morphometric measurements (left) and representative immunofluorescence (right) images as in (D). Anti-CL5 (green), and anti-ICAM (red). Scale bar, 15 μm. Note that Bay 11 and SR-I kappaB each prevented the induction of ICAM-1 as well as the induction of a disrupted pattern of anti-CL5 immunofluorescence staining (arrows in D and E) by TNF. F: Effects of SR-I kappaB dominant negative overexpression on IL-1 beta-leak (ECIS). Note that IL-1 beta over a 12 hour time course was ineffective at decreasing TEER in SR-I kappaB-transduced HDMEC. The corrected basal TEER for this experiment was 64.5 ± 2.8 Ω·cm2 for SR-I kappaB-transduced HDMEC and 59.6 ± 1.1 Ω·cm2 for vector control-transduced HDMEC. n = 3,3. Representative of 3 (A, B and C) or 2 (D, E and F) independent experiments with similar results. Image collected and cropped by CiteAb from the following publication (https://dx.plos.org/10.1371/journal.pone.0120075), licensed under a CC-BY license. Not internally tested by R&D Systems.
Detection of Human ICAM-1/CD54 by Western Blot
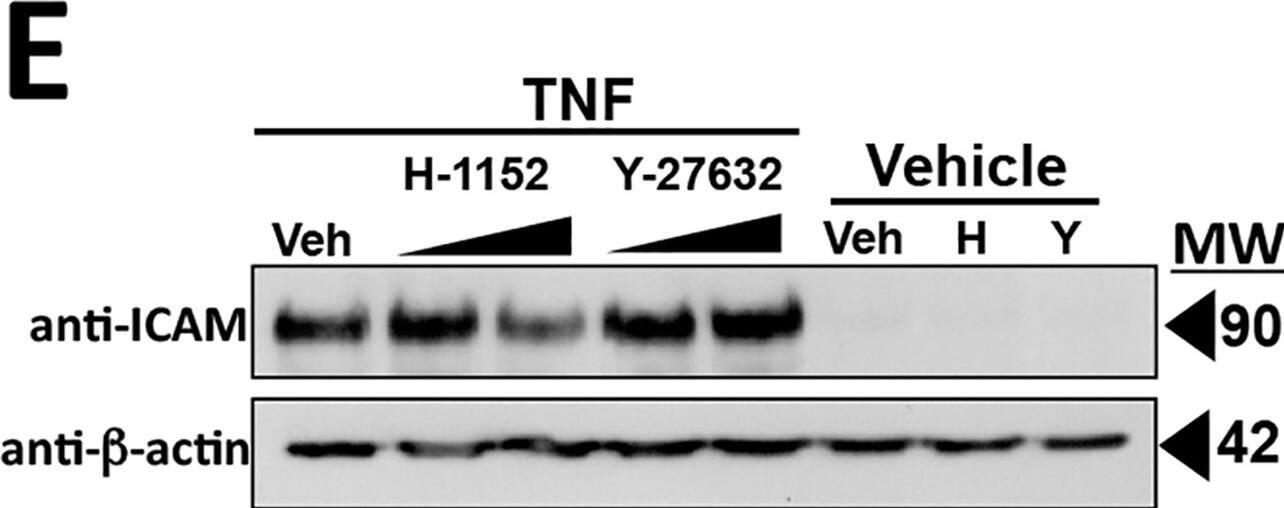
Effects of ROCK inhibitors H-1152 and Y-27632 on TNF-induced MLC phosphorylation, actin and CL5 reorganization and the fall in TEER.A) Immunoblot analysis of the effects of H-1152 (top) or Y-27632 (bottom) concentration on induction of MLC phosphorylation at 6 hours of 0.8 ng/ml TNF. B) Fluorescence microscopy analysis of the effects of H-1152 or Y-27632 (at 10 μM concentrations) on TNF-induced actin re-organization. Actin visualized by phalloidin staining. Note that changes to the peripheral pattern of cortical actin at 6 hours of 0.8 ng/ml TNF treatment are inhibited by H-1152 and by Y-27632 (arrows). Scale bar, 15 μm. C) Top: Morphometric analysis of the effects of H-1152 (at concentrations of 2 or 20 μM, triangles and inverted triangles, respectively), and Y-27632 (at concentrations of 1 or 10 μM, squares and diamonds) on disruption of CL5 junctional staining at 6 hours of 0.8 ng/ml TNF. Open symbols, no TNF, closed symbols, plus TNF. Below: Examples of the morphometrically assessed immunofluorescence microscopy images. Note that CL5 staining disorganized by TNF in vehicle control appears condensed and contiguous in the presence of both ROCK inhibitors (arrows). Scale bar, 15 μm. D) Effects of H-1152 and Y-27632 on the phase 1 and phase 2 TEER decreases induced by TNF. Starting at T0, HDMEC plated on ECIS 96-well arrays received a 1 hour pre-treatment with vehicle (top panel, n = 4, 4) or with a ROCK inhibitor, either H-1152 (at 1 or 10 μM, middle panel, n = 6, 6) or Y-27632 (at 1 or 10 μM, bottom panel, n = 6, 6). One hour later 0.8 ng/ml TNF or (top panel only) vehicle was added, indicated by the vertical dashed lines. The corrected basal TEER for this experiment was 67.8 ± 0.4 Ω·cm2. E) Immunoblot analysis of the effects of H-1152 and Y-27632 on TNF-induced ICAM expression. Protein lysates were from HDMEC pre-treated with H-1152 (1 or 10 μM) or Y-27632 (1 or 10 μM) then TNF, 0.8 ng/ml for 6 h. Representative of 4 (A), 3 (B, D, E) and 2 (C) independent experiments with similar results. Image collected and cropped by CiteAb from the following publication (https://dx.plos.org/10.1371/journal.pone.0120075), licensed under a CC-BY license. Not internally tested by R&D Systems.

