Human PNR/NR2E3 Antibody
R&D Systems, part of Bio-Techne | Catalog # PP-H7223-00

Key Product Details
Species Reactivity
Validated:
Human
Cited:
Human, Mouse
Applications
Validated:
Direct ELISA, Immunohistochemistry, Western Blot
Cited:
Immunocytochemistry, Immunohistochemistry, Immunoprecipitation
Label
Unconjugated
Antibody Source
Monoclonal Mouse IgG2A Clone # H7223
Product Specifications
Clonality
Monoclonal
Host
Mouse
Isotype
IgG2A
Scientific Data Images for Human PNR/NR2E3 Antibody
Detection of Mouse PNR/NR2E3 by Immunocytochemistry/Immunofluorescence
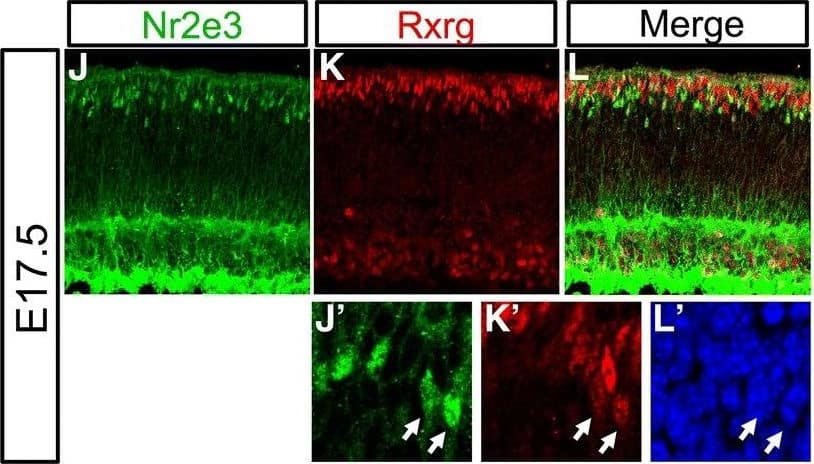
Coexpression of Rxrg and Nr2e3 in the embryonic mouse retina. (A-H) E14.5 mouse retinas electroporated with either the cNr2e3Enh2 or cNr2e3Enh3 plasmid, cultured ex vivo for 2 days, and processed for immunofluorescence confocal imaging of EGFP (green, chicken antibody), Nr2e3 (red, mouse antibody), Rxrg (white, rabbit antibody), and DAPI. Panels in A-H represent maximum projections of z-stacks with the depicted channel shown at the top of the column. The merge column has EGFP, Nr2e3, and Rxrg signals. (A’-H’) Magnified single z-plane images with the signals for (A’,E’) EGFP, (B’,F’) Nr2e3, (C’,G’) Rxrg, and (D’,H’) DAPI. White arrows point to GFP+ cells that also express Nr2e3 and Rxrg. Yellow arrows point to GFP+ cells that express Rxrg, but not Nr2e3. (I) A graph of the average percentage of GFP+ cells when driven by the cNr2e3Enh2 or cNr2e3Enh3 elements that express Nr2e3, Rxrg, or both Nr2e3 and Rxrg. (J-L) Maximum projection of a z-stack image of a E17.5 mouse retina processed for immunofluorescent detection of Nr2e3 (J, green) and Rxrg (K, red) or both (L, Merge). (J’-L’) Magnified single z-plane images of the same area visualized for signals for Nr2e3 (J’), Rxrg (K’), or DAPI (L’). (M) A graph of the average percentage of Nr2e3, Rxrg double-positive (D.P.) cells out of the total Nr2e3+ population (left bar) or the total Rxrg+ population (right bar). In both graphs N ≥ 3 biological replicates. Error bars represent standard error of the mean. All images are oriented with the scleral side of the retina at the top of the image. Scale bar in A represents 20 μm and applies to A-L. Image collected and cropped by CiteAb from the following publication (https://pubmed.ncbi.nlm.nih.gov/30466480), licensed under a CC-BY license. Not internally tested by R&D Systems.Detection of Mouse PNR/NR2E3 by Immunocytochemistry/Immunofluorescence
Coexpression of Rxrg and Nr2e3 in the embryonic mouse retina. (A-H) E14.5 mouse retinas electroporated with either the cNr2e3Enh2 or cNr2e3Enh3 plasmid, cultured ex vivo for 2 days, and processed for immunofluorescence confocal imaging of EGFP (green, chicken antibody), Nr2e3 (red, mouse antibody), Rxrg (white, rabbit antibody), and DAPI. Panels in A-H represent maximum projections of z-stacks with the depicted channel shown at the top of the column. The merge column has EGFP, Nr2e3, and Rxrg signals. (A’-H’) Magnified single z-plane images with the signals for (A’,E’) EGFP, (B’,F’) Nr2e3, (C’,G’) Rxrg, and (D’,H’) DAPI. White arrows point to GFP+ cells that also express Nr2e3 and Rxrg. Yellow arrows point to GFP+ cells that express Rxrg, but not Nr2e3. (I) A graph of the average percentage of GFP+ cells when driven by the cNr2e3Enh2 or cNr2e3Enh3 elements that express Nr2e3, Rxrg, or both Nr2e3 and Rxrg. (J-L) Maximum projection of a z-stack image of a E17.5 mouse retina processed for immunofluorescent detection of Nr2e3 (J, green) and Rxrg (K, red) or both (L, Merge). (J’-L’) Magnified single z-plane images of the same area visualized for signals for Nr2e3 (J’), Rxrg (K’), or DAPI (L’). (M) A graph of the average percentage of Nr2e3, Rxrg double-positive (D.P.) cells out of the total Nr2e3+ population (left bar) or the total Rxrg+ population (right bar). In both graphs N ≥ 3 biological replicates. Error bars represent standard error of the mean. All images are oriented with the scleral side of the retina at the top of the image. Scale bar in A represents 20 μm and applies to A-L. Image collected and cropped by CiteAb from the following publication (https://pubmed.ncbi.nlm.nih.gov/30466480), licensed under a CC-BY license. Not internally tested by R&D Systems.Applications for Human PNR/NR2E3 Antibody
Application
Recommended Usage
Direct ELISA
Immunohistochemistry
5-15 µg/mL
Sample: Perfusion fixed paraffin-embedded sections of rat retina (outer nuclear layer)
Sample: Perfusion fixed paraffin-embedded sections of rat retina (outer nuclear layer)
Western Blot
Formulation, Preparation, and Storage
Formulation
A liquid formulation in physiologic saline with 0.1% NaN3.
Shipping
The product is shipped with dry ice or equivalent. Upon receipt, store it immediately at the temperature recommended below.
Stability & Storage
Store the unopened product at -70 °C. Use a manual defrost freezer and avoid repeated freeze-thaw cycles. Do not use past expiration date.
Background: PNR/NR2E3
Long Name
Photoreceptor-specific Nuclear Receptor
Alternate Names
NR2E3, RNR
Entrez Gene IDs
10002 (Human)
Gene Symbol
NR2E3
Additional PNR/NR2E3 Products
Product Documents for Human PNR/NR2E3 Antibody
Product Specific Notices for Human PNR/NR2E3 Antibody
For research use only
Loading...
Loading...
Loading...

