Detection of Mouse Cathepsin B by Immunocytochemistry/ Immunofluorescence
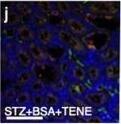
EMT in BSA-induced damaged tubule was associated with increased levels of DPP-4, integrin beta1 and CAV1; TENE treatment ameliorated these alterations. (a–e) Multiplex immunofluorescence microscopy analysis of the EMT program and association with CAV1. Formaldehyde-fixed, paraffin-embedded (FFPE) kidney samples were labeled with epithelial markers for E-cadherin, alphaSMA and CAV1. An immunofluorescence analysis was performed by confocal microscopy. (d) The enlarged image of the inset shown in (c). The alphaSMA-positive damaged tubular cells were surrounded by alphaSMA-positive interstitial cells (f–j). Multiplex immunofluorescence was performed to analyze the crosstalk among DPP-4, integrin beta1 and CAV1 in the BSA-injected diabetic mice. (i) The enlarged image of the inset shown in (h). DPP-4, integrin beta1, and CAV1 were localized at the same location (likely the luminal side of the proximal tubule). The crosstalk occurred more frequently in the damaged tubular cells. Representative images from n = 7 in each group are shown. Image collected and cropped by CiteAb from the following open publication (https://pubmed.ncbi.nlm.nih.gov/31101909), licensed under a CC-BY license. Not internally tested by R&D Systems.
Detection of Mouse Cathepsin B by Immunocytochemistry/ Immunofluorescence
Alteration of the size of lysosomes and the expression of LAMP-1 in in Rab7 deltapan pancreatic acinar cells. (a–d) Immunofluorescence images of wild (a,c) and Rab7 deltapan (b,d) pancreases stained with anti-LAMP1(a,b) or anti-cathepsin B (c,d) antibodies (red). DAPI was used for nuclear staining (blue). Bars: 20 µm. (e) Quantification of the positive signals in immunofluorescence images of LAMP-1 (left panel) and cathepsin B (right panel). *P < 0.05. (f) WB of LAMP-1 using total pancreas homogenate of wild and Rab7 deltapan mice. An antibody against LAMP-1 N-terminal (top panel) and an antibody against LAMP-1 C-terminal (middle panel) were utilized. Anti-LAMP-1 N-terminal antibody revealed the shifting of intense bands to a lower position (top panel, arrow head) than that of full-length LAMP-1 (120 kDa) in Rab7 deltapan pancreas. In contrast, anti-LAMP-1 C-terminal antibody revealed bands at 120 kDa only in both wild and Rab7 deltapan pancreas (middle panel). beta-actin was used as an internal loading control (bottom panel). Image collected and cropped by CiteAb from the following open publication (https://www.nature.com/articles/s41598-017-02988-3), licensed under a CC-BY license. Not internally tested by R&D Systems.
Detection of Mouse Cathepsin B by Immunocytochemistry/ Immunofluorescence
EMT in BSA-induced damaged tubule was associated with increased levels of DPP-4, integrin beta1 and CAV1; TENE treatment ameliorated these alterations. (a–e) Multiplex immunofluorescence microscopy analysis of the EMT program and association with CAV1. Formaldehyde-fixed, paraffin-embedded (FFPE) kidney samples were labeled with epithelial markers for E-cadherin, alphaSMA and CAV1. An immunofluorescence analysis was performed by confocal microscopy. (d) The enlarged image of the inset shown in (c). The alphaSMA-positive damaged tubular cells were surrounded by alphaSMA-positive interstitial cells (f–j). Multiplex immunofluorescence was performed to analyze the crosstalk among DPP-4, integrin beta1 and CAV1 in the BSA-injected diabetic mice. (i) The enlarged image of the inset shown in (h). DPP-4, integrin beta1, and CAV1 were localized at the same location (likely the luminal side of the proximal tubule). The crosstalk occurred more frequently in the damaged tubular cells. Representative images from n = 7 in each group are shown. Image collected and cropped by CiteAb from the following open publication (https://pubmed.ncbi.nlm.nih.gov/31101909), licensed under a CC-BY license. Not internally tested by R&D Systems.
Detection of Mouse Cathepsin B by Immunohistochemistry
BSA-injected diabetic mice exhibited high tubular levels of DPP-4, CAV1 and EMT program; TENE treatment ameliorated these alterations. Immunohistochemical analysis of (a–d) DPP-4, (e–h) CAV1, (i–l) snail and (m–p) AQP-1 from the BSA-injected control or diabetic mice with or without the TENE treatment. Scale bar, 50 μm. Representative images from n = 7 in each group are shown. Each group was analyzed with an unpaired two-tailed t-test. *P < 0.05, **P < 0.01. Data are presented as mean ± s.e.m (q–t). Image collected and cropped by CiteAb from the following open publication (https://pubmed.ncbi.nlm.nih.gov/31101909), licensed under a CC-BY license. Not internally tested by R&D Systems.
Detection of Mouse Cathepsin B by Western Blot
TENE treatment suppressed the crosstalk among DPP-4, integrin beta1 and CAV1 via inhibition of TGF-beta /smad3 signaling pathway in vitro. Duolink in situ analysis of (a-c) DPP-4/integrin beta1, (d–f) DPP-4/CAV1 and (g–i) integrin beta1/CAV1 in HK-2 cells with or without TGF-beta 1 (10 ng/ml) was performed by confocal microscopy (×1260). Scale bar: 50 μm in each panel. (j) Representative western blot analysis. As a densitometric analysis, each protein level was normalized with actin. n = 6 per group were analyzed. (k–n) Duolink in situ analysis of integrin beta1/CAV1 in DPP-4 overexpressed HK-2 cells with or without TENE and SIS3. (o) Immunoprecipitation analysis revealed TGF-beta treatment increased crosstalk among DPP-4, integrin beta1 (ITG beta1) and CAV1. (p) Immunoprecipitation assay revealed TGF-beta neutralization suppressed crosstalk among DPP-4, integrin beta1 and CAV1 induced by DPP-4 overexpression. Image collected and cropped by CiteAb from the following open publication (https://pubmed.ncbi.nlm.nih.gov/31101909), licensed under a CC-BY license. Not internally tested by R&D Systems.
Detection of Mouse Cathepsin B by Immunohistochemistry
BSA-injected diabetic mice exhibited high tubular levels of DPP-4, CAV1 and EMT program; TENE treatment ameliorated these alterations. Immunohistochemical analysis of (a–d) DPP-4, (e–h) CAV1, (i–l) snail and (m–p) AQP-1 from the BSA-injected control or diabetic mice with or without the TENE treatment. Scale bar, 50 μm. Representative images from n = 7 in each group are shown. Each group was analyzed with an unpaired two-tailed t-test. *P < 0.05, **P < 0.01. Data are presented as mean ± s.e.m (q–t). Image collected and cropped by CiteAb from the following open publication (https://pubmed.ncbi.nlm.nih.gov/31101909), licensed under a CC-BY license. Not internally tested by R&D Systems.
Detection of Mouse Cathepsin B by Immunocytochemistry/ Immunofluorescence
EMT in BSA-induced damaged tubule was associated with increased levels of DPP-4, integrin beta1 and CAV1; TENE treatment ameliorated these alterations. (a–e) Multiplex immunofluorescence microscopy analysis of the EMT program and association with CAV1. Formaldehyde-fixed, paraffin-embedded (FFPE) kidney samples were labeled with epithelial markers for E-cadherin, alphaSMA and CAV1. An immunofluorescence analysis was performed by confocal microscopy. (d) The enlarged image of the inset shown in (c). The alphaSMA-positive damaged tubular cells were surrounded by alphaSMA-positive interstitial cells (f–j). Multiplex immunofluorescence was performed to analyze the crosstalk among DPP-4, integrin beta1 and CAV1 in the BSA-injected diabetic mice. (i) The enlarged image of the inset shown in (h). DPP-4, integrin beta1, and CAV1 were localized at the same location (likely the luminal side of the proximal tubule). The crosstalk occurred more frequently in the damaged tubular cells. Representative images from n = 7 in each group are shown. Image collected and cropped by CiteAb from the following open publication (https://pubmed.ncbi.nlm.nih.gov/31101909), licensed under a CC-BY license. Not internally tested by R&D Systems.
Detection of Mouse Cathepsin B by Immunocytochemistry/ Immunofluorescence
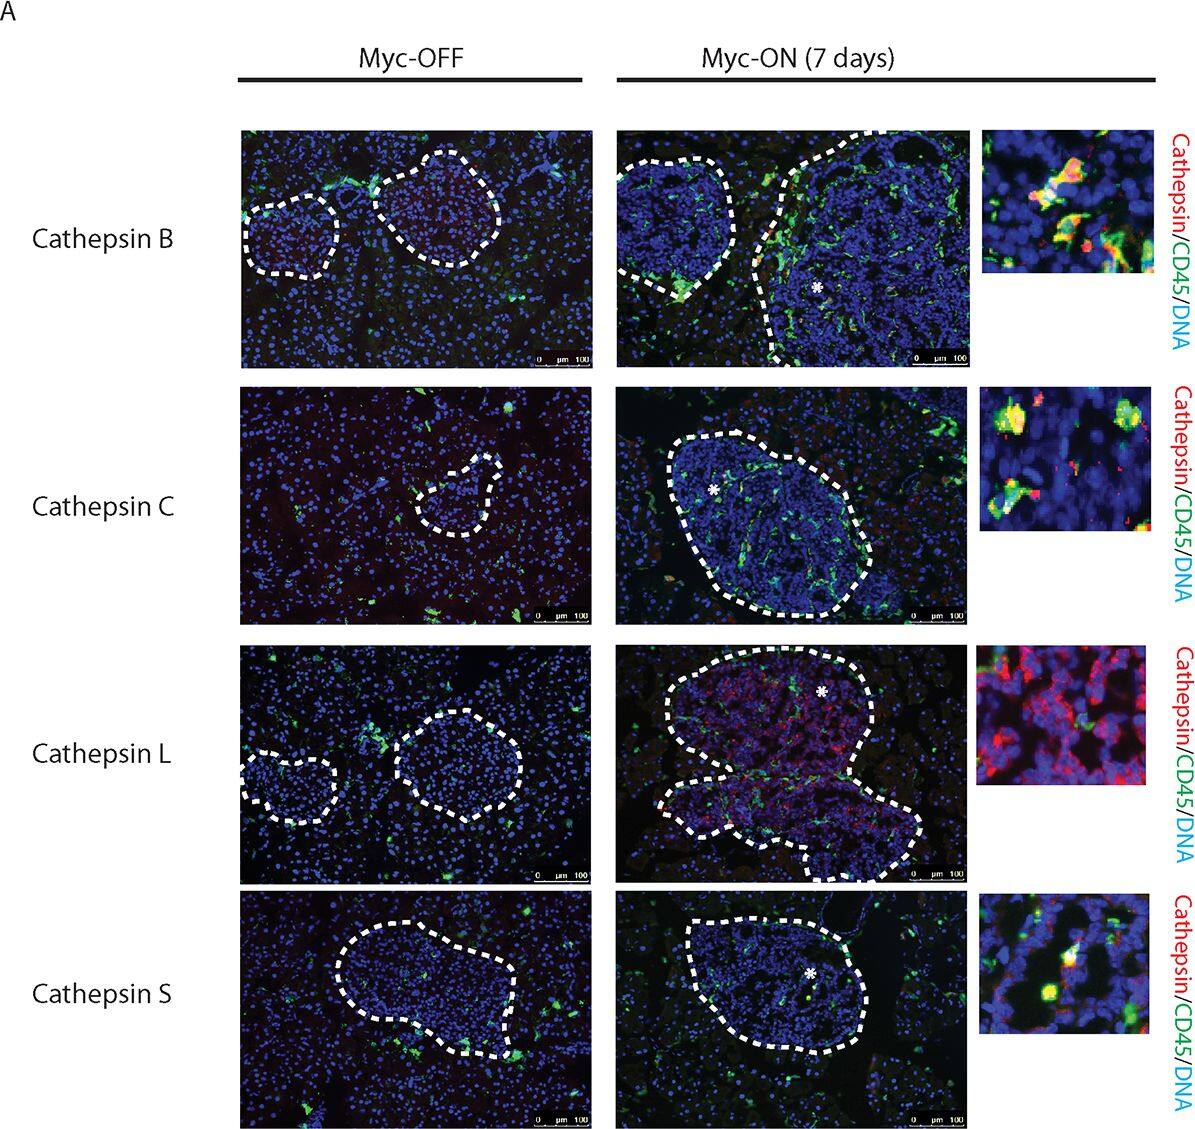
Myc induces cathepsin L expression in beta-cells of pancreatic Islets.(A) Immunohistochemical analyses for CTS B, C, L or S expression (all in red) in combination with staining for the pan-leukocyte marker CD45 (green) in pancreatic islet tumors from the MycERTAM;Bcl-xL animals. Pancreata were harvested from the MycERTAM;Bcl-xL mice treated for 7 d with TAM (Myc-On, 7 days) or control vehicle in place of TAM (Myc-OFF). The islet area is indicated by dotted line. The asterisks indicate the area of tumor represented in the insets. The panels are representatives of at least three animals assayed at each data point, all immunohistochemical analyses were done in duplicate; eight randomized fields per analysis were examined. Scale bars, 100μm. (B) Immunohistochemical analysis for cathepsin L expression in beta-cells of pancreatic islets from MycERTAM;Bcl-xL animals identified by insulin expression. Pancreata were collected from the animals described above. Scale bars represent 25μm. The panels are representatives of three animals assayed at each data point, all immunohistochemical analyses were done in duplicate; ten randomized fields per analysis were examined. Image collected and cropped by CiteAb from the following open publication (https://dx.plos.org/10.1371/journal.pone.0120348), licensed under a CC-BY license. Not internally tested by R&D Systems.
Detection of Cathepsin B by Western Blot
Evaluation of lysosomal activation in SWCNT-exposed cells. Panel a: Epi-fluorescence images of macrophages unexposed (upper line) or exposed (lower line) to 50 μg/ml SWCNT for 24 hours stained with Acridine Orange (for lysosomes, in red) and DAPI (RNA/DNA, in green). Merge: combination of Acridine Orange and DAPI staining (overlapping appeared yellow). Panel b: Cathepsin activity in macrophages exposed to SWCNT for 3 hours. *: p < 0.001 between groups. Panel c: Western Blot images of LAMP-1 (120 kDa) and Cathepsin B (37 kDa) expression in macrophages exposed for 24 hours to SWCNT. beta-Actin is given as internal standard. Panel d: quantification of LAMP-1 and Cathepsin B expression, normalized to beta-Actin expression. *: p < 0.05 between groups. Image collected and cropped by CiteAb from the following open publication (https://pubmed.ncbi.nlm.nih.gov/23800198), licensed under a CC-BY license. Not internally tested by R&D Systems.


