Detection of Mouse GM-CSFR alpha by Flow Cytometry
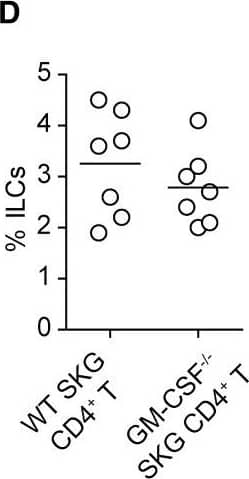
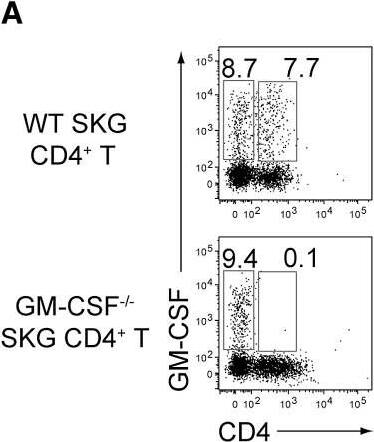
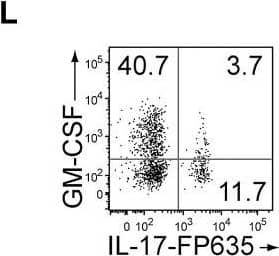
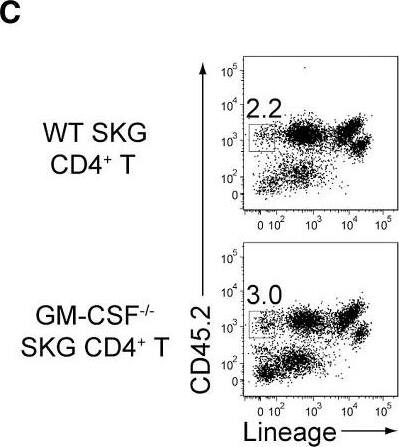
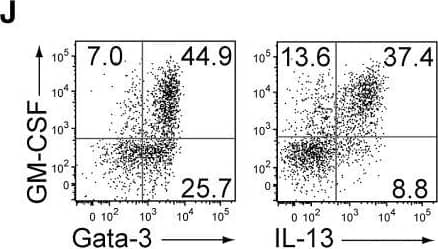
GM-CSF-Producing ILCs in Inflamed Joints(A) Flow cytometry analysis of GM-CSF expression by CD4+ T cells and CD4− cells among CD45+ joint infiltrating cells in Rag2−/− mice transferred with CD4+ T cells from WT or Csf2−/− SKG mice.(B) Quantitative RT-PCR analysis of Csf2, Il1b, and Tnf in CD11b+Ly-6G− (CD11b+), CD11b+Ly-6G+ (Ly-6G+), CD4+ T cells, and ILCs sorted from arthritic joints of mannan-treated SKG mice (n = 3). mRNA expression is presented relative to the expression of Hprt1.(C) Flow cytometry of joint infiltrating cells in Rag2−/− mice transferred with CD4+ T cells from WT or Csf2−/− SKG mice. Cells were stained for CD45.2 and lineage markers (a cocktail of CD3, CD4, CD8, CD11b, CD11c, CD19, and DX-5).(D) Proportion of ILCs in Rag2−/− mice transferred with CD4+ T cells as shown in (C). Each symbol represents an individual mouse. Horizontal bars indicate the means.(E) Total cell number of ILCs from healthy or inflamed joints of SKG mice (n = 3).(F) Flow cytometry of synovial ILCs (CD45.2+ lineage markers-negative Thy1.2+ cells as shown in C) for Ki-67 expression.(G) Flow cytometry of synovial ILCs (CD45.2+ lineage markers-negative Thy1.2+ cells as shown in C) for cell surface expression of IL-7Ra, CD25, CCR6, c-kit, IL-33Ra, CD44, and MHC2.(H) Flow cytometry of synovial ILCs (as shown in C) for intranuclear expression of the transcription factor T-bet, Gata-3, Ror gammat, and Foxp3.(I) Proportion of the transcription factor-expressing synovial ILCs (n = 3) as shown in (H).(J) Flow cytometry of synovial ILCs (as shown in C) for the expression of GM-CSF, Gata-3, and IL-13.(K) Total cell numbers of ILCs from healthy or inflamed joints of C57/BL6 (B6) mice with collagen antibody-induced arthritis (n = 3). Data are representative of two independent experiments.(L) Flow cytometry of synovial ILCs for the expression of GM-CSF and FP635 in arthritic Il17aCre R26RFP635 SKG mice.(M) Quantitative RT-PCR analysis of Csf2 and Bhlhe40 in splenic naive CD25−CD44loCD4+ T cells (naive CD4+ T) and synovial ILCs (n = 3) as shown in (C).(N) The effects of ILC depletion on arthritis development. CD4+ T cells (1 × 10⁶) from Thy1.1+ SKG mice were adoptively transferred into Thy1.2+Rag2−/− mice, which were i.v. injected with 500 μg anti-Thy1.2 mAb or control Rat IgG every week (n = 19 each). The severity of arthritis was monitored every week.∗p < 0.05, ∗∗p < 0.01. Data are representative of three independent experiments in (A)–(C), (E)–(J), (L), and (M) and pooled from more than two experiments in (D), (F), and (N). Vertical bars mean SD in (B), (E), (I), (K), (M), and (N). Image collected and cropped by CiteAb from the following publication (https://linkinghub.elsevier.com/retrieve/pii/S1074761318301468), licensed under a CC-BY license. Not internally tested by R&D Systems.
Detection of Mouse GM-CSFR alpha by Flow Cytometry
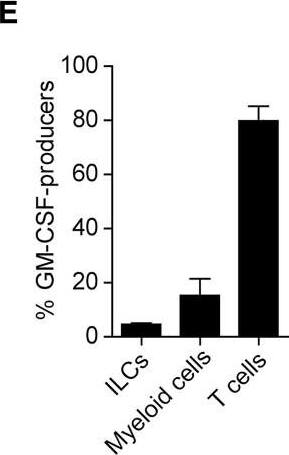
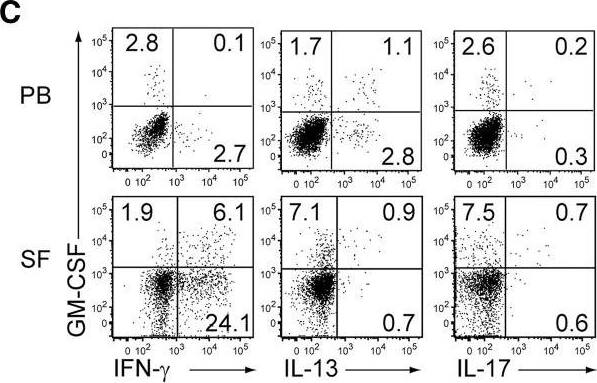
GM-CSF-Producing ILCs in Synovial Fluid of RA Patients(A) The presence of ILCs (defined as CD45+CD3−CD4−CD8−CD11b−CD11c−CD19−CD56−) from peripheral blood (PB) or synovial fluid (SF) of a patient with RA or OA (left). The percentages of ILCs in PB and SF from individual RA (n = 13) or OA (n = 6) patients. The lines indicate the sample pairs of the same patients (right).(B) Total numbers of ILCs in 1 mL of SF from OA and RA patients (n = 6). Vertical bars indicate SD.(C) Flow cytometry analysis of IFN-gamma, IL-13, IL-17, and GM-CSF expression by ILCs (gated as in A) in PB or SF of a RA patient (top). The percentages of cytokine-producing ILCs from individual RA patients (n = 11) (bottom).(D) Gating strategies for GM-CSF+CD45+ lineage markers-negative (ILCs), GM-CSF+CD45+CD3−CD11b+ (myeloid cells), and GM-CSF+CD45+CD11b−CD3+ cells (T cells).(E) Proportion of GM-CSF-producing cells (n = 3). Vertical bars indicate SD. Symbols represent individual samples. Horizontal bars indicate the means.∗p < 0.05, ∗∗p < 0.01. Image collected and cropped by CiteAb from the following publication (https://linkinghub.elsevier.com/retrieve/pii/S1074761318301468), licensed under a CC-BY license. Not internally tested by R&D Systems.
Detection of Mouse GM-CSFR alpha by Flow Cytometry
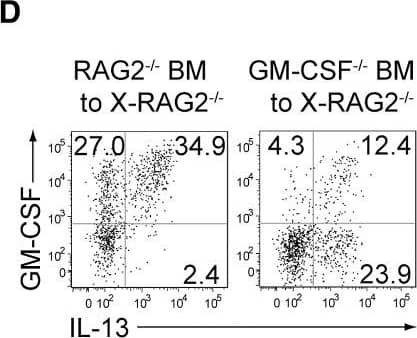
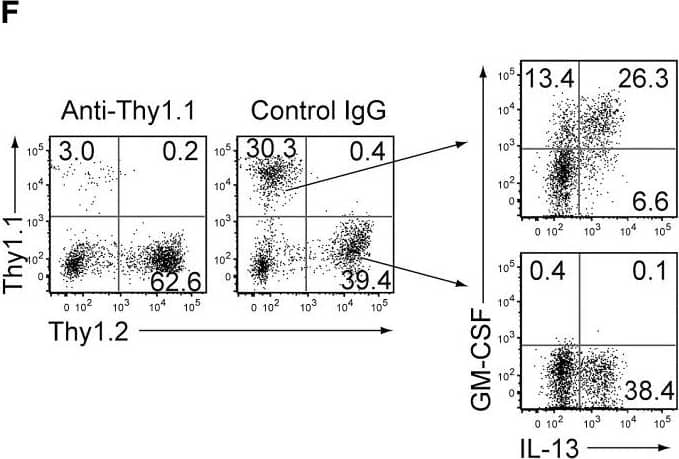
GM-CSF from ILCs and Radio-Resistant Stromal Cells Is Crucial for Autoimmune Arthritis(A) Preparation of experimental groups for assessing arthritogenic effects of GM-CSF from ILCs or radio-resistant stromal cells. Rag2−/− or Csf2−/−Rag2−/− mice were x-irradiated (X-Rag2−/− mice) and transferred with BM cells from Csf2−/− or WT Rag2−/− mice. The resulting four groups of BM chimeras were transferred with CD4+ T cells from Csf2−/− SKG mice 6 weeks after BM reconstitution and assessed for arthritis development 12 weeks later.(B) Arthritis scores of four groups of mice shown in (A).(C) Proportion of total synovial ILCs from x-irradiated Rag2−/− mice reconstituted with Csf2−/− or WT Rag2−/− BM cells.(D) Flow cytometry of synovial ILCs for the expression of GM-CSF and IL-13 in arthritic joints of BM chimeras shown in (C).(E) Proportion of GM-CSF+IL-13−, GM-CSF+IL-13+, and GM-CSF−IL-13+ synovial ILCs (n = 6 each) as shown in (D).(F and G) The effects of ILC depletion on arthritis development. Thy1.1+Rag2−/− mice were x-irradiated and transferred with BM cells from Thy1.1+Rag2−/− and Thy1.2+Csf2−/− SKG mice. The resulting BM chimeras were i.p. injected with 20 mg mannan 6 weeks later, followed by i.v. injection with 500 μg anti-Thy1.1 mAb or control Rat IgG every week. Flow cytometry of synovial ILCs for GM-CSF and IL-13 expression (F). Arthritis scores in each group of mice monitored every week (G). Vertical bars mean SD (n = 8 each).∗p < 0.05, ∗∗p < 0.01. Data are representative of three independent experiments in (D) and (F), and pooled from three experiments in (B), (C), (E), and (G). Horizontal bars indicate the means in (B), (C), and (E). Image collected and cropped by CiteAb from the following publication (https://linkinghub.elsevier.com/retrieve/pii/S1074761318301468), licensed under a CC-BY license. Not internally tested by R&D Systems.
Detection of Mouse GM-CSFR alpha by Flow Cytometry
GM-CSF-Producing ILCs in Inflamed Joints(A) Flow cytometry analysis of GM-CSF expression by CD4+ T cells and CD4− cells among CD45+ joint infiltrating cells in Rag2−/− mice transferred with CD4+ T cells from WT or Csf2−/− SKG mice.(B) Quantitative RT-PCR analysis of Csf2, Il1b, and Tnf in CD11b+Ly-6G− (CD11b+), CD11b+Ly-6G+ (Ly-6G+), CD4+ T cells, and ILCs sorted from arthritic joints of mannan-treated SKG mice (n = 3). mRNA expression is presented relative to the expression of Hprt1.(C) Flow cytometry of joint infiltrating cells in Rag2−/− mice transferred with CD4+ T cells from WT or Csf2−/− SKG mice. Cells were stained for CD45.2 and lineage markers (a cocktail of CD3, CD4, CD8, CD11b, CD11c, CD19, and DX-5).(D) Proportion of ILCs in Rag2−/− mice transferred with CD4+ T cells as shown in (C). Each symbol represents an individual mouse. Horizontal bars indicate the means.(E) Total cell number of ILCs from healthy or inflamed joints of SKG mice (n = 3).(F) Flow cytometry of synovial ILCs (CD45.2+ lineage markers-negative Thy1.2+ cells as shown in C) for Ki-67 expression.(G) Flow cytometry of synovial ILCs (CD45.2+ lineage markers-negative Thy1.2+ cells as shown in C) for cell surface expression of IL-7Ra, CD25, CCR6, c-kit, IL-33Ra, CD44, and MHC2.(H) Flow cytometry of synovial ILCs (as shown in C) for intranuclear expression of the transcription factor T-bet, Gata-3, Ror gammat, and Foxp3.(I) Proportion of the transcription factor-expressing synovial ILCs (n = 3) as shown in (H).(J) Flow cytometry of synovial ILCs (as shown in C) for the expression of GM-CSF, Gata-3, and IL-13.(K) Total cell numbers of ILCs from healthy or inflamed joints of C57/BL6 (B6) mice with collagen antibody-induced arthritis (n = 3). Data are representative of two independent experiments.(L) Flow cytometry of synovial ILCs for the expression of GM-CSF and FP635 in arthritic Il17aCre R26RFP635 SKG mice.(M) Quantitative RT-PCR analysis of Csf2 and Bhlhe40 in splenic naive CD25−CD44loCD4+ T cells (naive CD4+ T) and synovial ILCs (n = 3) as shown in (C).(N) The effects of ILC depletion on arthritis development. CD4+ T cells (1 × 10⁶) from Thy1.1+ SKG mice were adoptively transferred into Thy1.2+Rag2−/− mice, which were i.v. injected with 500 μg anti-Thy1.2 mAb or control Rat IgG every week (n = 19 each). The severity of arthritis was monitored every week.∗p < 0.05, ∗∗p < 0.01. Data are representative of three independent experiments in (A)–(C), (E)–(J), (L), and (M) and pooled from more than two experiments in (D), (F), and (N). Vertical bars mean SD in (B), (E), (I), (K), (M), and (N). Image collected and cropped by CiteAb from the following publication (https://linkinghub.elsevier.com/retrieve/pii/S1074761318301468), licensed under a CC-BY license. Not internally tested by R&D Systems.
Detection of Mouse GM-CSFR alpha by Flow Cytometry
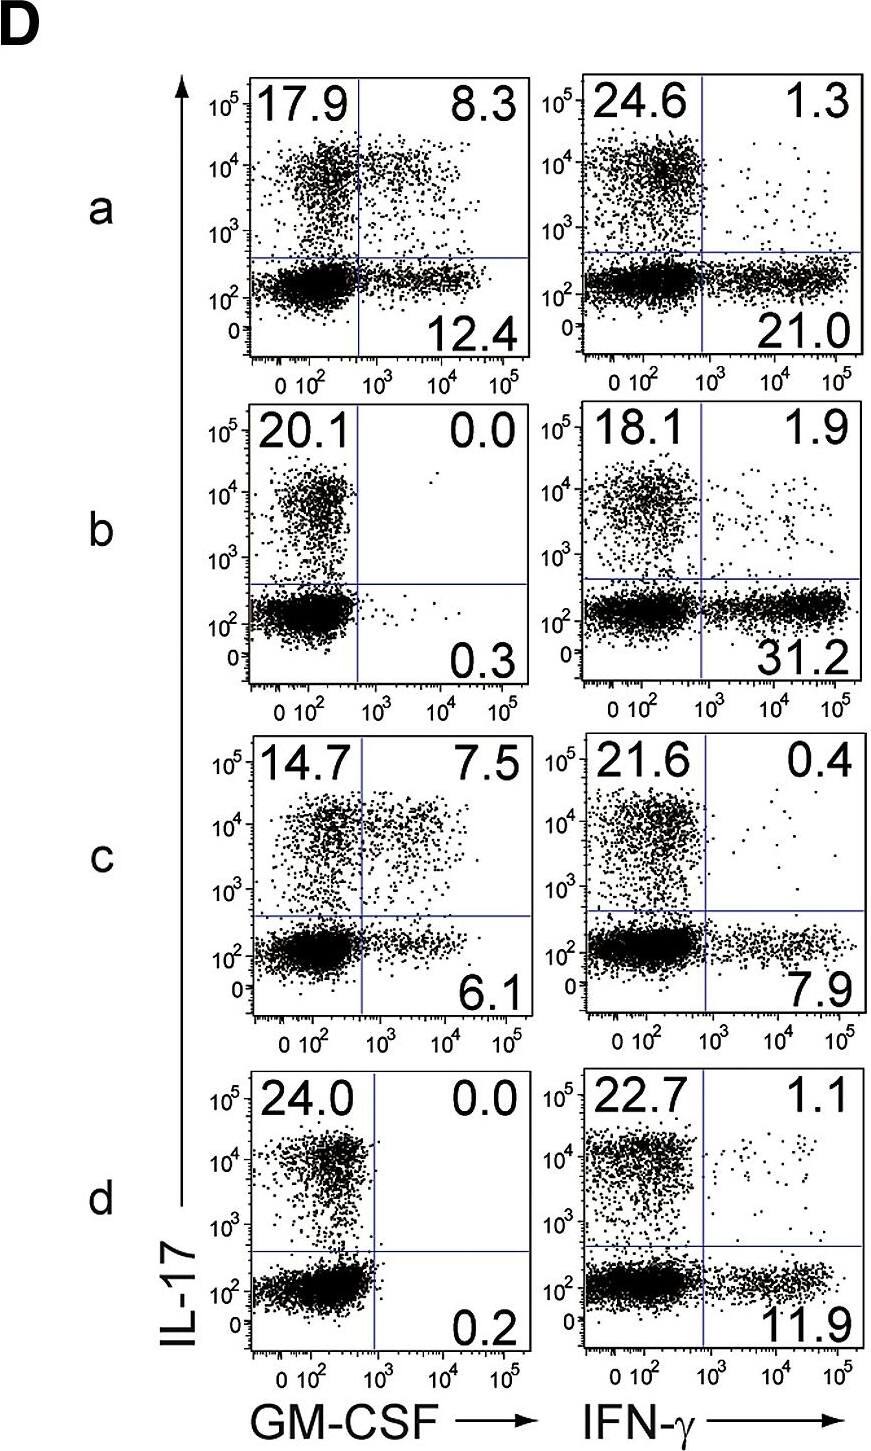
GM-CSF from Non-T Cells Is Crucial for the Initiation of Autoimmune Arthritis(A) Experimental design of adoptive transfer of CD4+ T cells from WT or Csf2−/− SKG mice into Rag2−/− or Csf2−/−Rag2−/− mice. Arthritis scores of four groups (a–d) of mice were assessed 3 months after transfer of 1 × 10⁶ CD4+ T cells.(B) Arthritis scores of the four groups mice (n = 15 or 16 each) shown in (A). Horizontal bars indicate the means.(C) Representative joint histology of the groups shown in (A). Scale bars indicate 200 μm.(D) Flow cytometry of splenic CD4+ T cells stained for intracellular IL-17 and GM-CSF or IFN-gamma.(E) Proportion of IL-17-producing CD4+ T cells from individual mice as shown in (D). Vertical bars mean SD (n = 3).∗∗p < 0.01. Data are representative of three independent experiments (C–E) or pooled from three independent experiments (B). Image collected and cropped by CiteAb from the following publication (https://linkinghub.elsevier.com/retrieve/pii/S1074761318301468), licensed under a CC-BY license. Not internally tested by R&D Systems.
Detection of Mouse GM-CSFR alpha by Flow Cytometry
GM-CSF-Producing ILCs in Synovial Fluid of RA Patients(A) The presence of ILCs (defined as CD45+CD3−CD4−CD8−CD11b−CD11c−CD19−CD56−) from peripheral blood (PB) or synovial fluid (SF) of a patient with RA or OA (left). The percentages of ILCs in PB and SF from individual RA (n = 13) or OA (n = 6) patients. The lines indicate the sample pairs of the same patients (right).(B) Total numbers of ILCs in 1 mL of SF from OA and RA patients (n = 6). Vertical bars indicate SD.(C) Flow cytometry analysis of IFN-gamma, IL-13, IL-17, and GM-CSF expression by ILCs (gated as in A) in PB or SF of a RA patient (top). The percentages of cytokine-producing ILCs from individual RA patients (n = 11) (bottom).(D) Gating strategies for GM-CSF+CD45+ lineage markers-negative (ILCs), GM-CSF+CD45+CD3−CD11b+ (myeloid cells), and GM-CSF+CD45+CD11b−CD3+ cells (T cells).(E) Proportion of GM-CSF-producing cells (n = 3). Vertical bars indicate SD. Symbols represent individual samples. Horizontal bars indicate the means.∗p < 0.05, ∗∗p < 0.01. Image collected and cropped by CiteAb from the following publication (https://linkinghub.elsevier.com/retrieve/pii/S1074761318301468), licensed under a CC-BY license. Not internally tested by R&D Systems.
Detection of Mouse GM-CSFR alpha by Flow Cytometry
GM-CSF-Producing ILCs in Inflamed Joints(A) Flow cytometry analysis of GM-CSF expression by CD4+ T cells and CD4− cells among CD45+ joint infiltrating cells in Rag2−/− mice transferred with CD4+ T cells from WT or Csf2−/− SKG mice.(B) Quantitative RT-PCR analysis of Csf2, Il1b, and Tnf in CD11b+Ly-6G− (CD11b+), CD11b+Ly-6G+ (Ly-6G+), CD4+ T cells, and ILCs sorted from arthritic joints of mannan-treated SKG mice (n = 3). mRNA expression is presented relative to the expression of Hprt1.(C) Flow cytometry of joint infiltrating cells in Rag2−/− mice transferred with CD4+ T cells from WT or Csf2−/− SKG mice. Cells were stained for CD45.2 and lineage markers (a cocktail of CD3, CD4, CD8, CD11b, CD11c, CD19, and DX-5).(D) Proportion of ILCs in Rag2−/− mice transferred with CD4+ T cells as shown in (C). Each symbol represents an individual mouse. Horizontal bars indicate the means.(E) Total cell number of ILCs from healthy or inflamed joints of SKG mice (n = 3).(F) Flow cytometry of synovial ILCs (CD45.2+ lineage markers-negative Thy1.2+ cells as shown in C) for Ki-67 expression.(G) Flow cytometry of synovial ILCs (CD45.2+ lineage markers-negative Thy1.2+ cells as shown in C) for cell surface expression of IL-7Ra, CD25, CCR6, c-kit, IL-33Ra, CD44, and MHC2.(H) Flow cytometry of synovial ILCs (as shown in C) for intranuclear expression of the transcription factor T-bet, Gata-3, Ror gammat, and Foxp3.(I) Proportion of the transcription factor-expressing synovial ILCs (n = 3) as shown in (H).(J) Flow cytometry of synovial ILCs (as shown in C) for the expression of GM-CSF, Gata-3, and IL-13.(K) Total cell numbers of ILCs from healthy or inflamed joints of C57/BL6 (B6) mice with collagen antibody-induced arthritis (n = 3). Data are representative of two independent experiments.(L) Flow cytometry of synovial ILCs for the expression of GM-CSF and FP635 in arthritic Il17aCre R26RFP635 SKG mice.(M) Quantitative RT-PCR analysis of Csf2 and Bhlhe40 in splenic naive CD25−CD44loCD4+ T cells (naive CD4+ T) and synovial ILCs (n = 3) as shown in (C).(N) The effects of ILC depletion on arthritis development. CD4+ T cells (1 × 10⁶) from Thy1.1+ SKG mice were adoptively transferred into Thy1.2+Rag2−/− mice, which were i.v. injected with 500 μg anti-Thy1.2 mAb or control Rat IgG every week (n = 19 each). The severity of arthritis was monitored every week.∗p < 0.05, ∗∗p < 0.01. Data are representative of three independent experiments in (A)–(C), (E)–(J), (L), and (M) and pooled from more than two experiments in (D), (F), and (N). Vertical bars mean SD in (B), (E), (I), (K), (M), and (N). Image collected and cropped by CiteAb from the following publication (https://linkinghub.elsevier.com/retrieve/pii/S1074761318301468), licensed under a CC-BY license. Not internally tested by R&D Systems.


