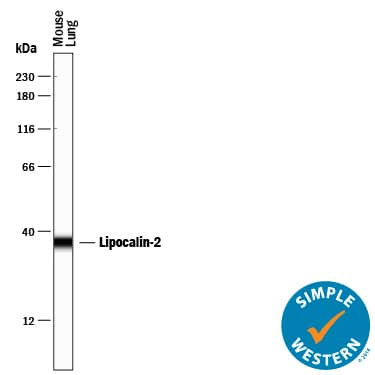
Detection of Mouse Lipocalin-2/NGAL by Western Blot
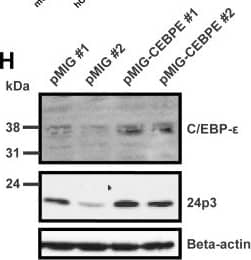
Human and murine C/EBP-epsilon induces expression of HNP-1 in primary bone marrow (BM) cells from transgenic HNP-1 mice.Murine BM cells from seven transgenic HNP-1 mice were isolated and early granulocyte precursors isolated by density centrifugation on a discontinuous Percoll 1.072 gradient. Cells were retrovirally transduced with an empty expression vector (pMIG) or with a vector expressing either human or murine C/EBP-epsilon (pMIG-CEBPE or pMIG-Cebpe respectively). Cells were incubated for 48 hours. (A) Green fluorescent protein (GFP) was used as reporter gene in the vectors and transduction efficiency evaluated by flow cytometry. (B–G) Comparative quantification of mRNA for CCAAT/enhancer binding protein-epsilon (human CEBPE or murine Cebpe), human neutrophil peptide-1 (DEFA1), cathelicidin antimicrobial peptide (Camp), and lipocalin-2 (Lcn2) was done by real-time PCR using Gapdh as normalizer. Error bars depict standard deviation. (B, E–G) Levels are shown as fold induction by either murine Cebpe (mCebpe) or human CEBPE (hCEBPE) compared to levels from negative control transduction (pMIG). (C) Relative quantification of human CEBPE in murine bone marrow cells from four transgenic HNP-1 mice transduced with control vector (pMIG) or human CEBPE. (D) Expression of murine Cebpe in Cebpe transduced cells were compared to human CEBPE in CEBPE transduced cells by comparing Delta Ct between the transduced gene and Gapdh. The transduced mouse with the lowest expression of C/EBP-epsilon was used as calibrator. (H) Western blotting of C/EBP-epsilon, 24p3, and beta-actin in transduced cells from two mice. (I–J) Cells were fixed in formaldehyde. Cell and nuclear membranes were lysed before fragmentation of DNA by sonication. Chromatin was immunoprecipitated using protein A/G magnetic beads and an antibody against C/EBP-epsilon, C/EBP-alpha, or negative control rabbit IgG. After washing procedures, immune complexes were eluted and reversed and DNA recovered. DNA was used as a template for quantitative PCR. Primers used were specific for putative C/EBP sites in the DEFA1 promoter and promoters of the specific granule protein cathelin-related antimicrobial peptide (Camp). Levels are depicted as fold enrichment compared to negative control IgG immunoprecipitation. Image collected and cropped by CiteAb from the following publication (https://dx.plos.org/10.1371/journal.pone.0092471), licensed under a CC-BY license. Not internally tested by R&D Systems.
Detection of Mouse Lipocalin-2/NGAL by Immunocytochemistry/Immunofluorescence
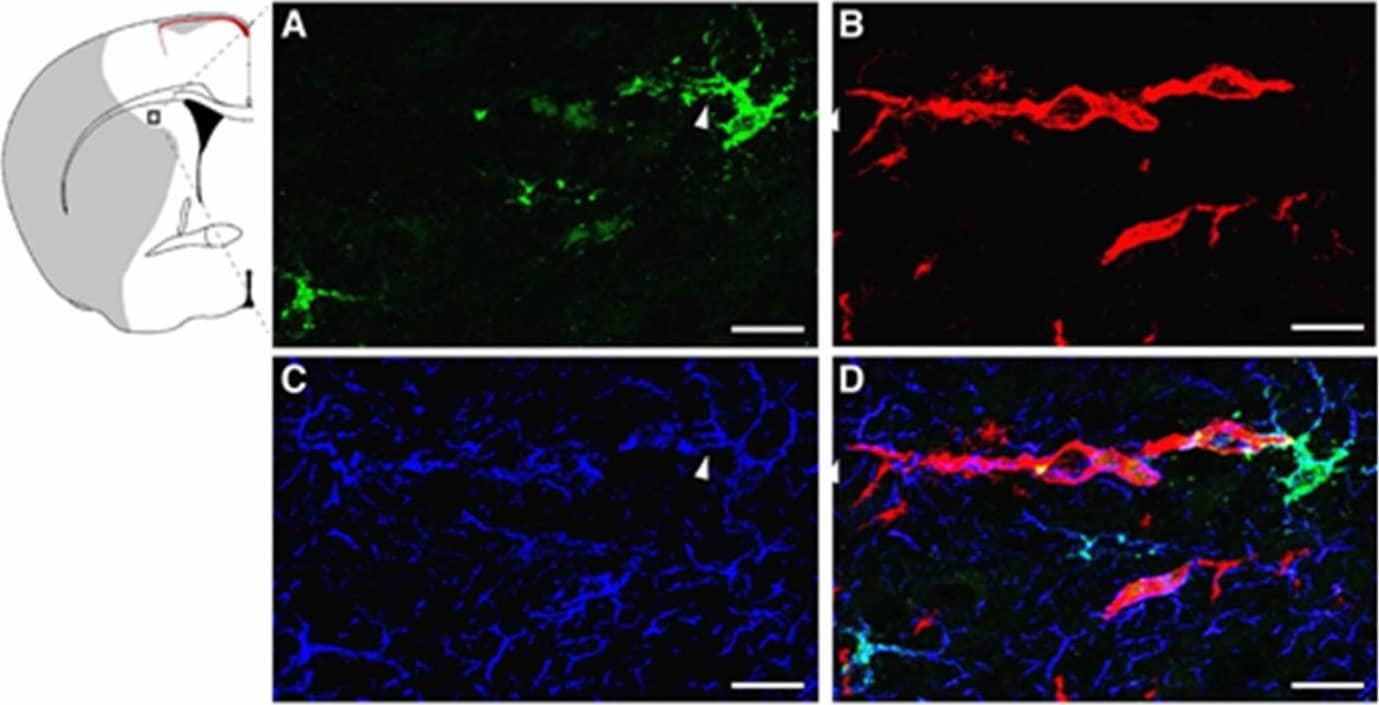
Immunolocalization of LCN2 in astrocytes and neutrophils in the ipsilateral cortex after tMCAo. Mouse brain slices isolated at 23 h after tMCAo were labeled with LCN2 antibody (green, A), Tomato Lectin (red, blood vessel, B), and GFAP antibody (blue, astrocyte, C). (D) Merged image showing the expression of LCN2 in an astrocyte whose end-feet encircle blood vessels (arrowheads). Brain slices isolated at 23 h after tMCAo were stained with antibodies recognizing LCN2 (green, E) and a specific marker for neutrophils (anti-Ly-6B.2 clone 7/4) (red, F). Nuclei were labeled with DAPI (blue, G). (H) Merged image showing the colocalization of LCN2 with 7/4 in yellow. The shaded area in the inset indicates the infarcted region. (I) The percentage of LCN2-positive cell types (n = 5). Scale bars, 10 μm (A–D), 50 μm (E–H). Image collected and cropped by CiteAb from the following publication (https://pubmed.ncbi.nlm.nih.gov/32872405), licensed under a CC-BY license. Not internally tested by R&D Systems.
Detection of Mouse Lipocalin-2/NGAL by Western Blot
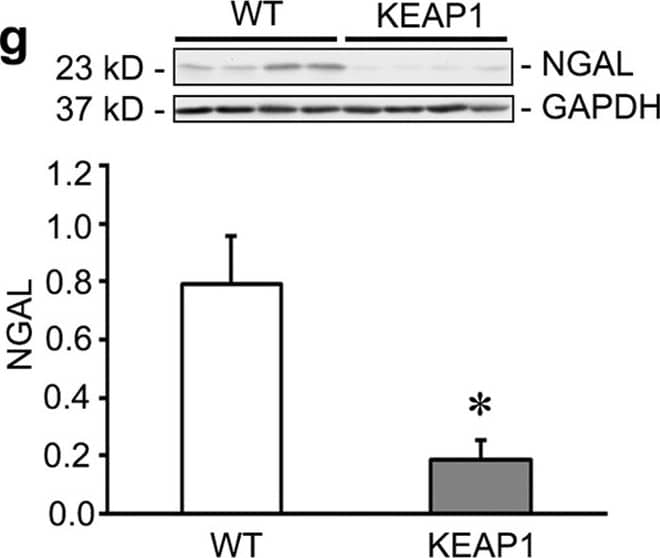
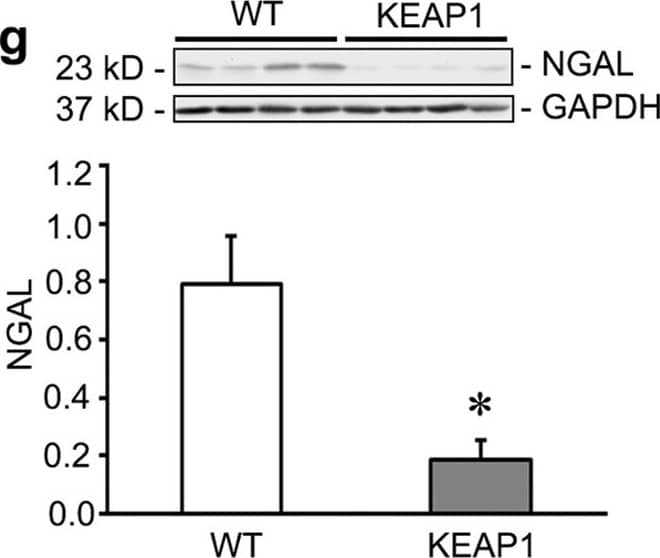
Keap1 hypomorphs demonstrated unequivocal protection 10 days after ischemia-reperfusion injury (IRI).Keap1 hypomorphs (KEAP1) and wild type (WT) mice were subjected to unilateral renal IRI, with a contralateral nephrectomy performed 24 hours prior to sacrifice at 10 days. (a) Kidney sections were subjected to Masson’s Trichrome staining to evaluate for fibrosis development (collagen appears blue). WT mice also had more inflammatory cells. Low powered views are shown along with an enlarged inset of the boxed area. Bar equals 100 μm. Picrosirius red was also performed – under light microscopy collagen and other cellular components stain red. With polarized light of the same sections shown on light microscopy, birefringence is highly specific for collagen. (b) Keap1 hypomorphs had significantly decreased fibrosis, which was confirmed with fibrosis scoring (n = 5–6 for each group). (c,d) Serum creatinine and BUN were significantly reduced in the hypomorphs. Each dot represents an individual mouse with the mean ± SEM superimposed. (e,f) qRT-PCR for KIM-1 and NGAL shows significant reduction in these tubular injury markers in IRI KEAP1 kidneys compared to IRI WT kidneys. Brackets show significant differences, P < 0.05. (g) NGAL was significantly suppressed in the IRI KEAP1 kidneys compared to IRI WT kidneys, confirming the qRT-PCR result in (f). (P < 0.05, compared to similarly treated WT group). Image collected and cropped by CiteAb from the following publication (https://www.nature.com/articles/srep36185), licensed under a CC-BY license. Not internally tested by R&D Systems.
Detection of Mouse Lipocalin-2/NGAL by Western Blot
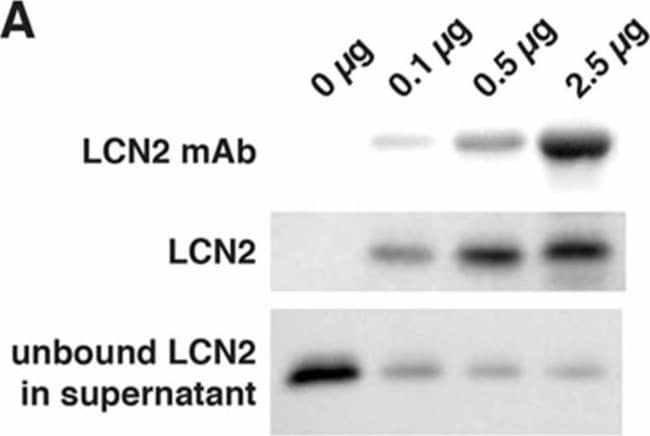
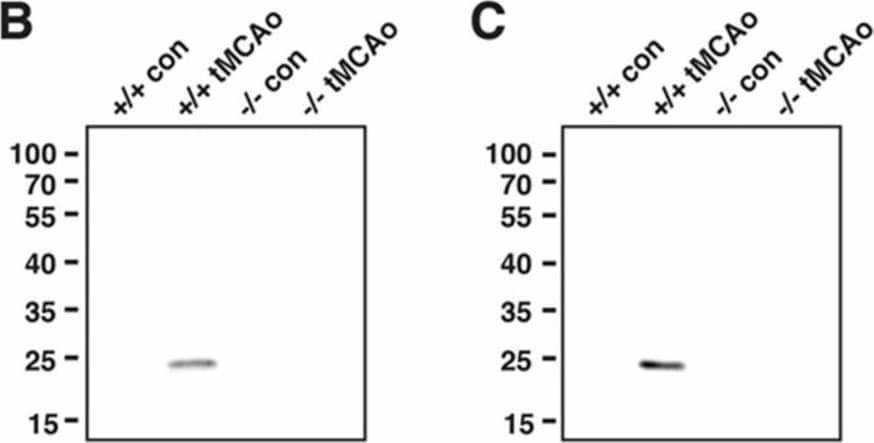
LCN2 monoclonal antibody (mAb) specifically immunoprecipitated recombinant and endogenous LCN2 proteins. (A) Representative Western blots showing that LCN2 mAb reduced the level of LCN2 protein by immunoprecipitation. Increasing concentrations of LCN2 mAb (0, 0.1, 0.5, and 2.5 μg) bound to the Dynabeads were incubated with a fixed amount of mouse recombinant LCN2 protein (0.1 μg). LCN2 mAb bound to the Dynabeads, immunoprecipitated LCN2 protein, and unbound LCN2 protein in the supernatant after the immunoprecipitation are shown in the top, middle, and bottom panels, respectively; (B,C) LCN2 mAb specifically immunoprecipitated the LCN2 protein that was induced after tMCAo. Ipsilateral hemisphere lysates (B) and blood sera (C) collected from naive LCN2+/+ and LCN2−/− mice (+/+ con and −/− con) and at 23 h after tMCAo (+/+ tMCAo and −/− tMCAo) were immunoprecipitated with LCN2 mAb and analyzed by Western blotting using a polyclonal antibody that recognized LCN2 protein; (D) Total RNA isolated from ipsilateral hemispheres of naive LCN2+/+ and LCN2−/− mice (+/+ con and −/− con), at 23 h after tMCAo (+/+ tMCAo and −/− tMCAo), and LCN2+/+ mice treated with LCN2 mAb at 4 h after tMCAo (+/+ tMCAo LCN2 mAb) was analyzed by real-time RT-PCR (n = 6 per group). Relative mRNA expression of LCN2 in the brain homogenates was compared between the mice groups using a one-way ANOVA and Newman–Keuls post hoc tests. LCN2 mRNA levels were significantly induced after tMCAo (*** p < 0.001) as compared with those in naive LCN2+/+ mice. LCN2 mRNA levels in mice that were treated with LCN2 mAb were significantly reduced (* p < 0.05) as compared those in LCN2+/+ mice after tMCAo; (E,F) Mice were treated with an isotype control IgG (con) or LCN2 mAb at 4 h after tMCAo. We analyzed the concentration of LCN2 in the ipsilateral hemispheres (n = 5 per group, E) and blood sera (n = 9–10 per group, F) at 23 h after reperfusion using ELISA. The concentration of LCN2 in the brains of mice treated with LCN2 mAb were significantly decreased (* p < 0.05) as compared with that in the brains of mice that received the control IgG (one-tailed, unpaired t test). The serum concentration of LCN2 in mice that received LCN2 mAb were also significantly decreased (** p < 0.01) as compared with that in mice that received the control IgG (two-tailed, unpaired t-test). Image collected and cropped by CiteAb from the following publication (https://pubmed.ncbi.nlm.nih.gov/32872405), licensed under a CC-BY license. Not internally tested by R&D Systems.
Detection of Mouse Lipocalin-2/NGAL by Western Blot
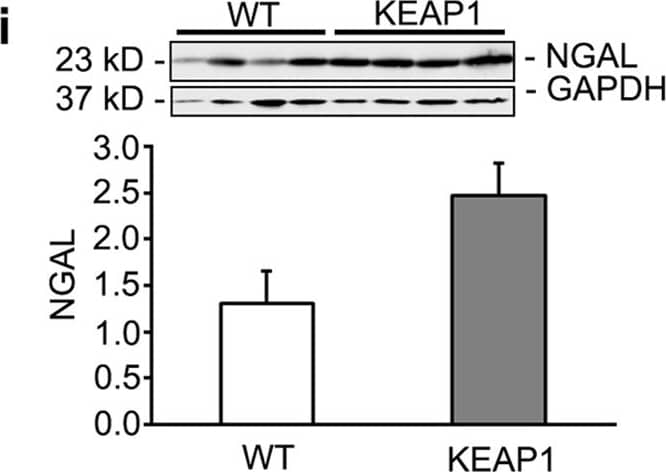
Keap1 hypomorphs have improved renal function 3 days after ischemia-reperfusion injury (IRI).Wild type (WT) and hypomorph mice (KEAP1) were subjected to unilateral renal IRI, with a contralateral nephrectomy performed 24 hours prior to sacrifice at 3 days. (a,b) Histologic assessment of kidneys showed significant tubular injury with no perceptible difference between groups. Bar equals 100 μm. (c,d) Serum creatinine and BUN were significantly improved in the hypomorphs in spite of the lack of histologic differences. Each dot represents an individual animal with mean ± SEM shown. (e,f) qRT-PCR showed no significant reductions in proinflammatory mediators (n = 4–5 in each group). (g,h) qRT-PCR analysis of tubular injury markers KIM-1 and NGAL showed a significant increase (KIM-1) or trend to increase (NGAL) in injured kidneys vs CTL uninjured kidneys, but no significant difference between injured WT and KEAP1 kidneys. (j) Western blot and densitometry for NGAL confirms no decrease in NGAL in injured KEAP1 kidneys compared to injured WT kidneys. (*P < 0.05 compared to the wild type group. **P < 0.05 compared to either CTL group). Image collected and cropped by CiteAb from the following publication (https://www.nature.com/articles/srep36185), licensed under a CC-BY license. Not internally tested by R&D Systems.
Detection of Mouse Lipocalin-2/NGAL by Immunocytochemistry/Immunofluorescence
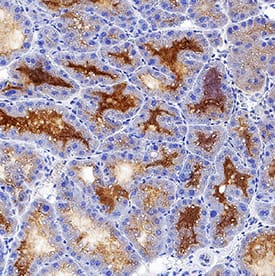
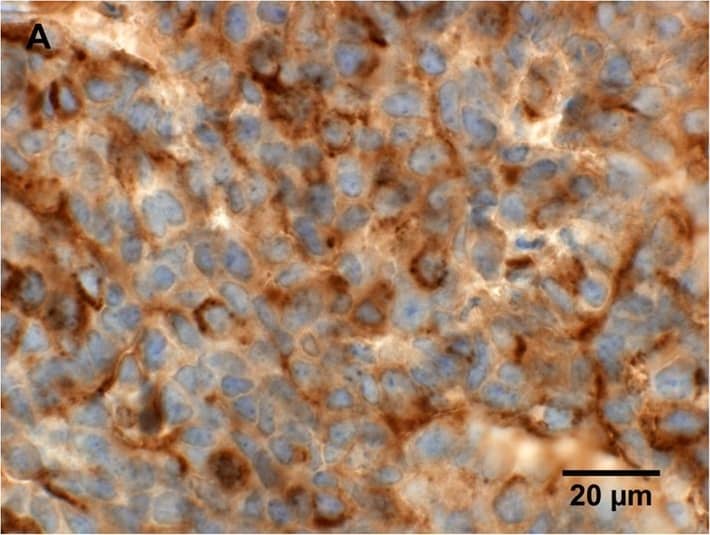
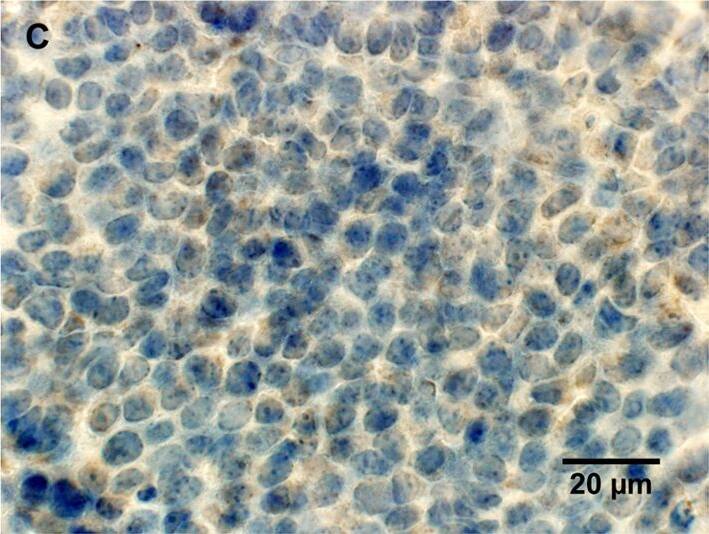
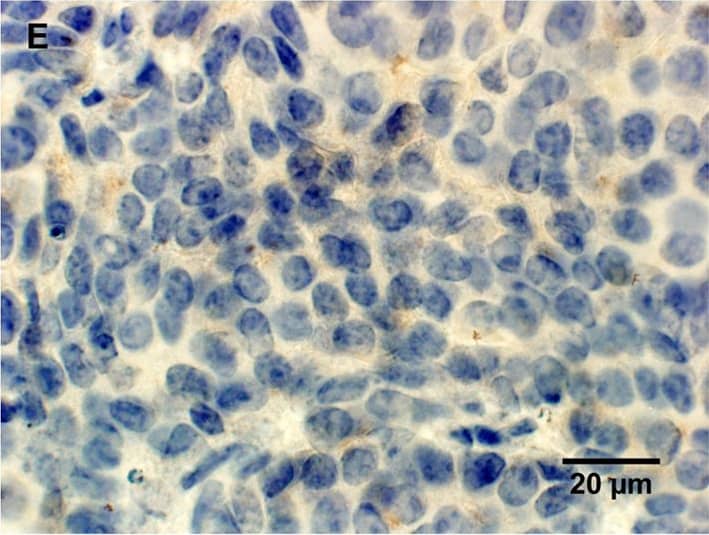
Histological characterization of mammary tumors.A, C, E, immunohistochemical staining for lipocalin-2 in mammary tumor in (A) PyMT, Lcn2+/+ mouse, (C) PyMT, Lcn2−/−, and (E) PyMT, Lcn2+/+ mouse as negative control, where no primary antibody was added. B, D, F, immunohistochemical staining for MMP-9 in mammary tumor in (B) PyMT, Lcn2+/+ mouse, (D) PyMT, Lcn2−/−, and (F) PyMT, Lcn2+/+ mouse as negative control, where no primary antibody was added. Original magnification x600. G, H+E staining of tumor from a PyMT, Lcn2+/+ mouse representing largest metastasis volume. F, H+E staining of tumor from PyMT, Lcn2−/− mouse representing largest metastasis volume. In both G and F strongly atypical tumor cells with numerous mitoses are seen, and surrounded by slender strands of collagen tissue. Original magnification x630. Abbreviations: PyMT: MMTV-PyMT. Image collected and cropped by CiteAb from the following publication (https://dx.plos.org/10.1371/journal.pone.0039646), licensed under a CC-BY license. Not internally tested by R&D Systems.
Detection of Mouse Lipocalin-2/NGAL by Immunocytochemistry/Immunofluorescence
Immunolocalization of LCN2 in astrocytes and neutrophils in the ipsilateral cortex after tMCAo. Mouse brain slices isolated at 23 h after tMCAo were labeled with LCN2 antibody (green, A), Tomato Lectin (red, blood vessel, B), and GFAP antibody (blue, astrocyte, C). (D) Merged image showing the expression of LCN2 in an astrocyte whose end-feet encircle blood vessels (arrowheads). Brain slices isolated at 23 h after tMCAo were stained with antibodies recognizing LCN2 (green, E) and a specific marker for neutrophils (anti-Ly-6B.2 clone 7/4) (red, F). Nuclei were labeled with DAPI (blue, G). (H) Merged image showing the colocalization of LCN2 with 7/4 in yellow. The shaded area in the inset indicates the infarcted region. (I) The percentage of LCN2-positive cell types (n = 5). Scale bars, 10 μm (A–D), 50 μm (E–H). Image collected and cropped by CiteAb from the following publication (https://pubmed.ncbi.nlm.nih.gov/32872405), licensed under a CC-BY license. Not internally tested by R&D Systems.
Detection of Mouse Lipocalin-2/NGAL by Western Blot
LCN2 monoclonal antibody (mAb) specifically immunoprecipitated recombinant and endogenous LCN2 proteins. (A) Representative Western blots showing that LCN2 mAb reduced the level of LCN2 protein by immunoprecipitation. Increasing concentrations of LCN2 mAb (0, 0.1, 0.5, and 2.5 μg) bound to the Dynabeads were incubated with a fixed amount of mouse recombinant LCN2 protein (0.1 μg). LCN2 mAb bound to the Dynabeads, immunoprecipitated LCN2 protein, and unbound LCN2 protein in the supernatant after the immunoprecipitation are shown in the top, middle, and bottom panels, respectively; (B,C) LCN2 mAb specifically immunoprecipitated the LCN2 protein that was induced after tMCAo. Ipsilateral hemisphere lysates (B) and blood sera (C) collected from naive LCN2+/+ and LCN2−/− mice (+/+ con and −/− con) and at 23 h after tMCAo (+/+ tMCAo and −/− tMCAo) were immunoprecipitated with LCN2 mAb and analyzed by Western blotting using a polyclonal antibody that recognized LCN2 protein; (D) Total RNA isolated from ipsilateral hemispheres of naive LCN2+/+ and LCN2−/− mice (+/+ con and −/− con), at 23 h after tMCAo (+/+ tMCAo and −/− tMCAo), and LCN2+/+ mice treated with LCN2 mAb at 4 h after tMCAo (+/+ tMCAo LCN2 mAb) was analyzed by real-time RT-PCR (n = 6 per group). Relative mRNA expression of LCN2 in the brain homogenates was compared between the mice groups using a one-way ANOVA and Newman–Keuls post hoc tests. LCN2 mRNA levels were significantly induced after tMCAo (*** p < 0.001) as compared with those in naive LCN2+/+ mice. LCN2 mRNA levels in mice that were treated with LCN2 mAb were significantly reduced (* p < 0.05) as compared those in LCN2+/+ mice after tMCAo; (E,F) Mice were treated with an isotype control IgG (con) or LCN2 mAb at 4 h after tMCAo. We analyzed the concentration of LCN2 in the ipsilateral hemispheres (n = 5 per group, E) and blood sera (n = 9–10 per group, F) at 23 h after reperfusion using ELISA. The concentration of LCN2 in the brains of mice treated with LCN2 mAb were significantly decreased (* p < 0.05) as compared with that in the brains of mice that received the control IgG (one-tailed, unpaired t test). The serum concentration of LCN2 in mice that received LCN2 mAb were also significantly decreased (** p < 0.01) as compared with that in mice that received the control IgG (two-tailed, unpaired t-test). Image collected and cropped by CiteAb from the following publication (https://pubmed.ncbi.nlm.nih.gov/32872405), licensed under a CC-BY license. Not internally tested by R&D Systems.
Detection of Mouse Lipocalin-2/NGAL by Immunocytochemistry/Immunofluorescence
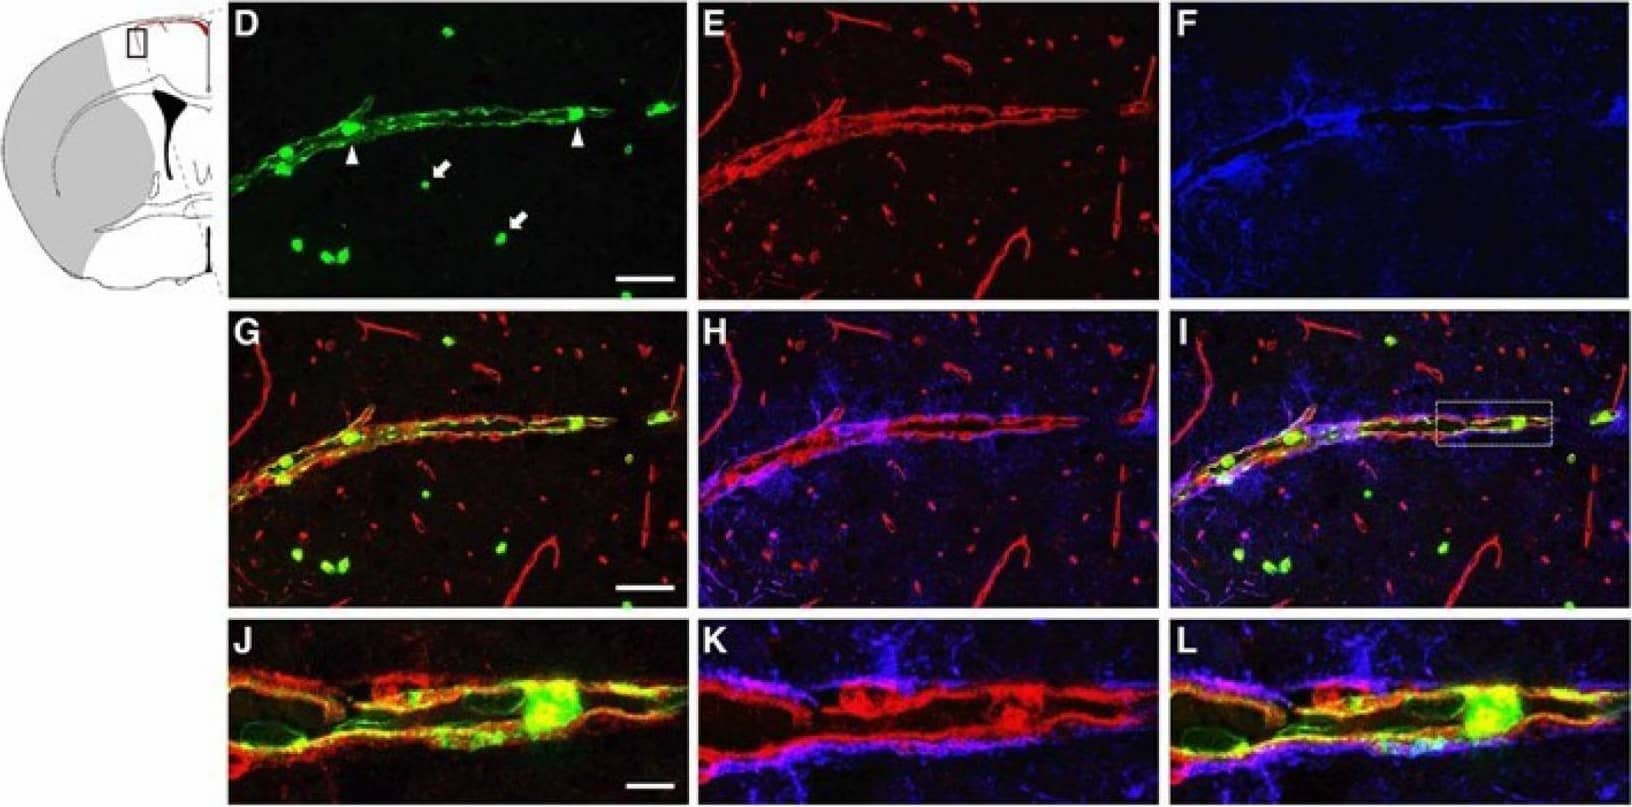
Immunolocalization of LCN2 in vascular endothelial cells in the ipsilateral cortex after transient middle cerebral artery occlusion (tMCAo). Brain slices isolated from naive mice (A–C) and at 23 h after tMCAo (D–L) were labeled with LCN2 antibody (green), tomato lectin (red, blood vessel), and GFAP antibody (blue, astrocyte). (D) Neutrophils detected within the blood vessel (arrowheads) and in ischemic brain parenchyma (arrows) labeled with LCN2 antibody (green). (G–L) Merged and amplified images showing the induction of LCN2 (green) on the inner surface of vascular endothelial cells (red) surrounded by astrocytic end-feet (blue). The shaded area in the inset indicates the infarcted region. Scale bars, 50 μm for the main images (A–I), and 10 μm for the amplified images (J–L). Image collected and cropped by CiteAb from the following publication (https://pubmed.ncbi.nlm.nih.gov/32872405), licensed under a CC-BY license. Not internally tested by R&D Systems.
Detection of Mouse Lipocalin-2/NGAL by Immunocytochemistry/Immunofluorescence
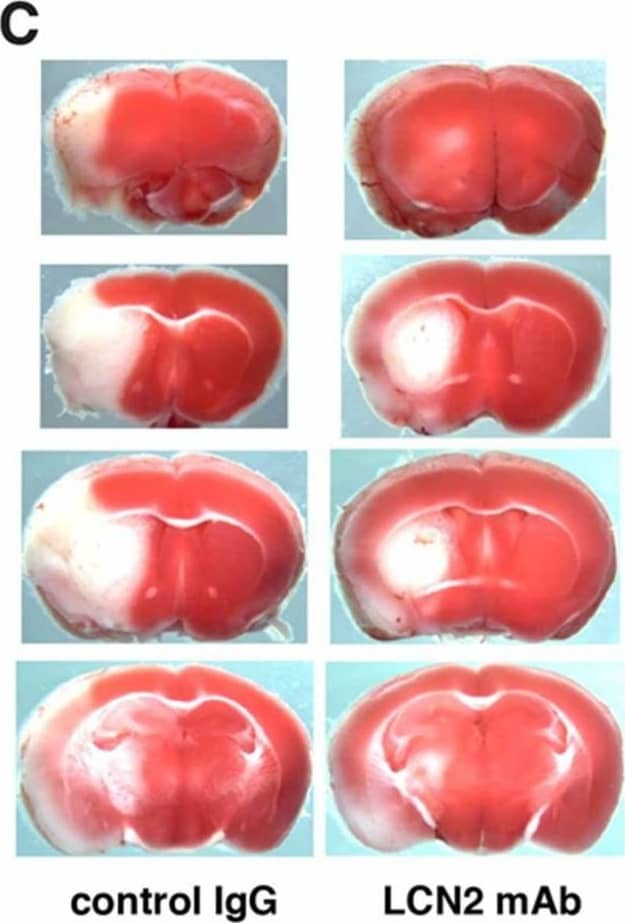
LCN2 mAb attenuated neurological deficits and cerebral infarction after tMCAo. Neurological deficit scoring (A) and corner test (B) were performed at 20 h after one hour of tMCAo in mice treated with isotype control IgG (con) and LCN2 mAb (n = 7 per group). (C) Representative images of TTC-stained brain slices from mice treated with control IgG and LCN2 mAb after 23 h of reperfusion. Viable tissue is stained in red color, whereas the infarcted area remains unstained (white). Total infarct volume (D) and brain swelling percentage (E) in mice treated with LCN2 mAb were significantly decreased 23 h after reperfusion as compared with those in mice treated with the control IgG (n = 5 per group). ** p < 0.01, *** p < 0.001 compared with treatments with control IgG (two-tailed, unpaired t-test). Image collected and cropped by CiteAb from the following publication (https://pubmed.ncbi.nlm.nih.gov/32872405), licensed under a CC-BY license. Not internally tested by R&D Systems.
Detection of Mouse Lipocalin-2/NGAL by Immunocytochemistry/Immunofluorescence
Histological characterization of mammary tumors.A, C, E, immunohistochemical staining for lipocalin-2 in mammary tumor in (A) PyMT, Lcn2+/+ mouse, (C) PyMT, Lcn2−/−, and (E) PyMT, Lcn2+/+ mouse as negative control, where no primary antibody was added. B, D, F, immunohistochemical staining for MMP-9 in mammary tumor in (B) PyMT, Lcn2+/+ mouse, (D) PyMT, Lcn2−/−, and (F) PyMT, Lcn2+/+ mouse as negative control, where no primary antibody was added. Original magnification x600. G, H+E staining of tumor from a PyMT, Lcn2+/+ mouse representing largest metastasis volume. F, H+E staining of tumor from PyMT, Lcn2−/− mouse representing largest metastasis volume. In both G and F strongly atypical tumor cells with numerous mitoses are seen, and surrounded by slender strands of collagen tissue. Original magnification x630. Abbreviations: PyMT: MMTV-PyMT. Image collected and cropped by CiteAb from the following publication (https://dx.plos.org/10.1371/journal.pone.0039646), licensed under a CC-BY license. Not internally tested by R&D Systems.
Detection of Mouse Mouse Lipocalin-2/NGAL Antibody by Western Blot
Keap1 hypomorphs demonstrated unequivocal protection 10 days after ischemia-reperfusion injury (IRI).Keap1 hypomorphs (KEAP1) and wild type (WT) mice were subjected to unilateral renal IRI, with a contralateral nephrectomy performed 24 hours prior to sacrifice at 10 days. (a) Kidney sections were subjected to Masson’s Trichrome staining to evaluate for fibrosis development (collagen appears blue). WT mice also had more inflammatory cells. Low powered views are shown along with an enlarged inset of the boxed area. Bar equals 100 μm. Picrosirius red was also performed – under light microscopy collagen and other cellular components stain red. With polarized light of the same sections shown on light microscopy, birefringence is highly specific for collagen. (b) Keap1 hypomorphs had significantly decreased fibrosis, which was confirmed with fibrosis scoring (n = 5–6 for each group). (c,d) Serum creatinine and BUN were significantly reduced in the hypomorphs. Each dot represents an individual mouse with the mean ± SEM superimposed. (e,f) qRT-PCR for KIM-1 and NGAL shows significant reduction in these tubular injury markers in IRI KEAP1 kidneys compared to IRI WT kidneys. Brackets show significant differences, P < 0.05. (g) NGAL was significantly suppressed in the IRI KEAP1 kidneys compared to IRI WT kidneys, confirming the qRT-PCR result in (f). (P < 0.05, compared to similarly treated WT group). Image collected and cropped by CiteAb from the following publication (https://pubmed.ncbi.nlm.nih.gov/27804998), licensed under a CC-BY license. Not internally tested by R&D Systems.


