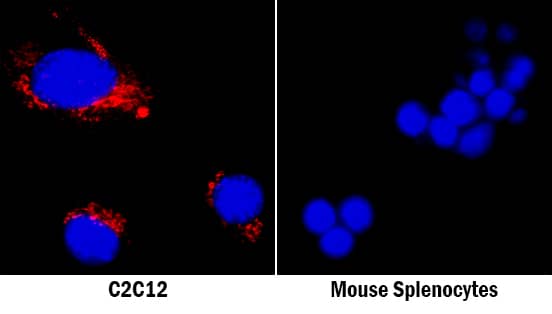
Detection of Mouse Osteopontin/OPN by Immunocytochemistry/Immunofluorescence
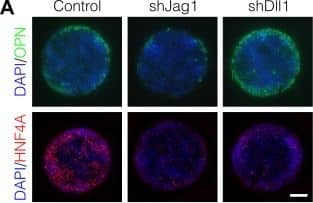
Notch ligands Jag1 and Dll1 are both required for segregation of hepatocytic fate centrally and biliary fate peripherally.(A) Immunolabeling for OPN and HNF4A of BMEL cells presented with DLL4 on 30 kPa substrates. Control cells were transduced with an shRNA vector coding for a non-mammalian target. shJag1 and shDll1 cells were transduced with shRNA vectors targeting Jag1 and Dll1, respectively. Scale bar is 150 µm. (B) Confocal imaging of immunolabeled SOX9 and HNF4A in control, shJag1, and shDll1 cells presented with DLL4 on 30 kPa substrates. Scale bar is 75 µm. (C) Quantification of OPN+ cell counts of control, shJag1, and shDll1 cells presented with DLL4 on 30 kPa substrates. (D) Quantification of SOX9 and HNF4A intensity of control, shJag1, and shDll1 cells presented with DLL4 on 30 kPa substrates. (C, D) Mean ± 95% CI.10.7554/eLife.38536.024Figure 7—source data 1.Summary table for OPN data in Figure 7C.10.7554/eLife.38536.025Figure 7—source data 2.Summary table for SOX9 and HNF4A data in Figure 7D.Summary table for OPN data in Figure 7C.Summary table for SOX9 and HNF4A data in Figure 7D.Regression analysis of OPN+ cell counts.Data in Figure 7B were separated into peripheral and central subsets for which dimensionless radius was greater than 0.75 (R>0.75) and less than 0.75 (R<0.75). Separate multiple regression models were generated for each data subset for which coefficient estimates (corresponding to mean change in cell counts) and 95% CI were plotted. For each factor, 95% CI that do not intersect with the dashed line indicate regression coefficient estimates for which P<0.05. Control, shJag1, and shDll1 cells were presented with DLL4 on 30 kPa substrates. Image collected and cropped by CiteAb from the following publication (https://pubmed.ncbi.nlm.nih.gov/30589410), licensed under a CC-BY license. Not internally tested by R&D Systems.
Detection of Mouse Osteopontin/OPN by Western Blot
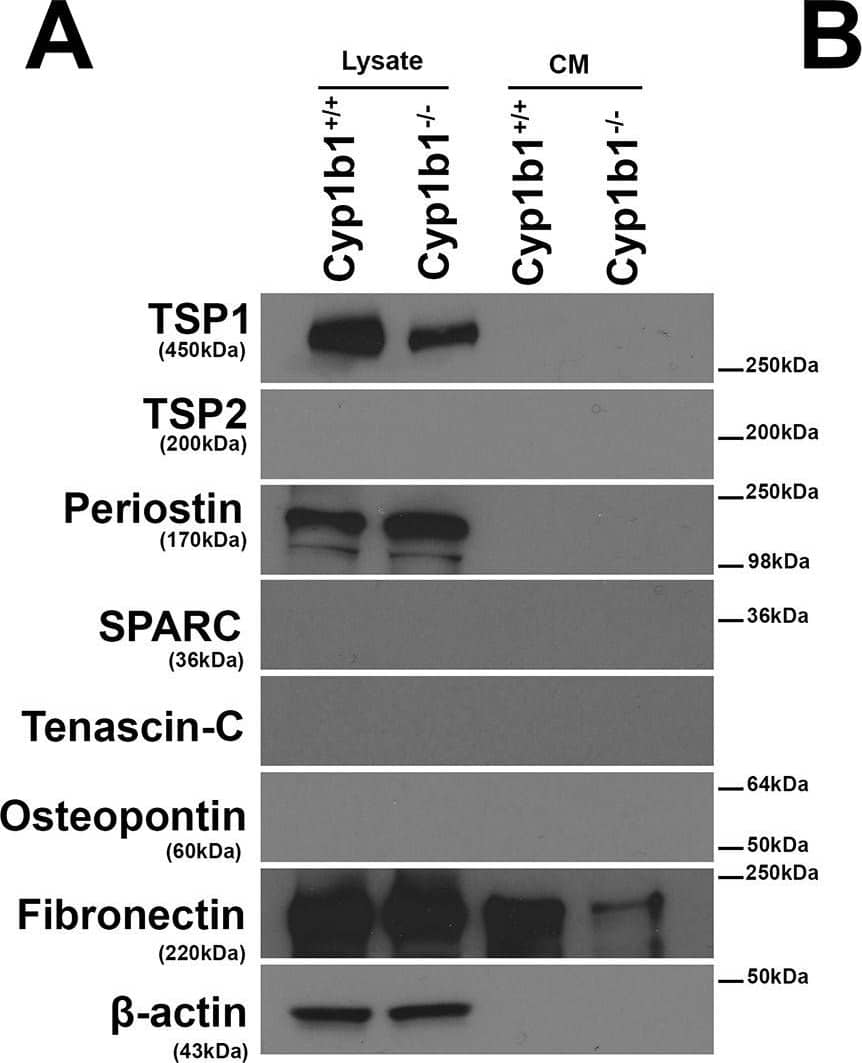
Altered expression of ECM proteins in Cyp1b1-/- LSEC.Western blot analysis of ECM proteins in the conditioned medium (CM) and cell lysates from LSEC was performed. (A) The levels of SPARC, Tenascin-C, TSP2, and Osteopontin were below the level of detection. Cyp1b1 LSEC produced TSP1, periostin, and fibronectin. (B) The quantitative assessment of the data. TSP1 level was significantly decreased in lysates from Cyp1b1-/- LSEC (***P
Detection of Mouse Osteopontin/OPN by Immunocytochemistry/Immunofluorescence
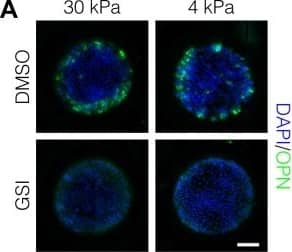
Peripheral biliary differentiation is dependent on both Notch signaling and substrate stiffness.(A) Immunolabeling for OPN of BMEL cells presented with DLL4 on 30 kPa and 4 kPa substrates. Cells were treated with vehicle control (DMSO) or an inhibitor of Notch signaling ( gamma-secretase inhibitor X, GSI, 5 µM). (B) Quantification of OPN+ cell counts on 30 kPa and 4 kPa substrates after treatment with DMSO or GSI. (C) Immunolabeling for SOX9 and HNF4A of BMEL cells on 30 kPa and 4 kPa substrates. (D) Quantification of SOX9 and HNF4A intensity on 30 kPa and 4 kPa substrates. (E) RNA in situ hybridization for Jag1, Dll1, and Notch2 on 30 kPa and 4 kPa substrates. Cells were exogenously presented with IgG or DLL4. (A, C, E) Scale bars indicate 150 µm. (B, D) Mean ± 95% CI.10.7554/eLife.38536.013Figure 2—source data 1.Summary table for OPN data in Figure 2B and Figure 2—figure supplement 1.10.7554/eLife.38536.014Figure 2—source data 2.Summary table for SOX9 and HNF4A data in Figure 2D.Summary table for OPN data in Figure 2B and Figure 2—figure supplement 1.Summary table for SOX9 and HNF4A data in Figure 2D.Quantification of OPN+ cell counts in arrayed patterns.Cells were cultured on 30 kPa and 4 kPa substrates and presented with IgG, DLL1, DLL4, and JAG1. Treatments included vehicle control (DMSO) or an inhibitor of Notch signaling ( gamma-secretase inhibitor X, GSI, 5 µM).Regression analysis of OPN+ and ALB+ cell counts.Data in Figure 2B were separated into peripheral and central subsets for which dimensionless radius was greater than 0.75 (R>0.75) and less than 0.75 (R<0.75). Separate multiple regression models were generated for each data subset for which coefficient estimates (corresponding to mean change in cell counts) and 95% CI were plotted for OPN+ (A) and ALB+ (B) cells. For each factor, 95% CI that do not intersect with the dashed line indicate regression coefficient estimates for which P<0.05. Cells were cultured on 30 kPa and 4 kPa substrates and presented with IgG, DLL1, DLL4, and JAG1. Treatments included vehicle control (DMSO) or an inhibitor of Notch signaling ( gamma-secretase inhibitor X, GSI, 5 µM).Quantification of ALB+ cell counts in arrayed patterns.Cells were cultured on 30 kPa substrates and presented with IgG, DLL1, DLL4, and JAG1. Treatments included vehicle control (DMSO) or an inhibitor of Notch signaling ( gamma-secretase inhibitor X, GSI, 5 µM). Image collected and cropped by CiteAb from the following publication (https://pubmed.ncbi.nlm.nih.gov/30589410), licensed under a CC-BY license. Not internally tested by R&D Systems.
Detection of Mouse Osteopontin/OPN by Immunocytochemistry/Immunofluorescence
Characterisation of mouse liver progenitor cell lines.(A) Mouse liver progenitor cell (LPC) lines (BMOL1.2, BMOL-TAT) were stained using immunofluorescence to determine expression of LPC marker Osteopontin (OPN) (red). IgG isotype control images obtained using identical imaging conditions. DAPI, blue. (B) LPCs (BMOL1.2) were shown to express full-length primary cilium (Pc) structures by immunofluorescence detection of axoneme ( alpha-acetylated tubulin, green) and basal body ( gamma-tubulin, red) markers. This was also confirmed by scanning electron microscopy (SEM). BMOL-TAT cells were also confirmed to express Pc via immunofluorescence and EM studies (data not shown). (C) Nuclear GLI2 (red) expression in LPC lines (BMOL1.2, BMOL-TAT) via immunofluorescence staining. DAPI, blue. Confocal microscopy, 63x objective. Image collected and cropped by CiteAb from the following publication (https://dx.plos.org/10.1371/journal.pone.0171480), licensed under a CC-BY license. Not internally tested by R&D Systems.
Detection of Mouse Osteopontin/OPN by Western Blot
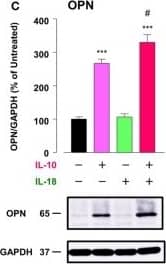
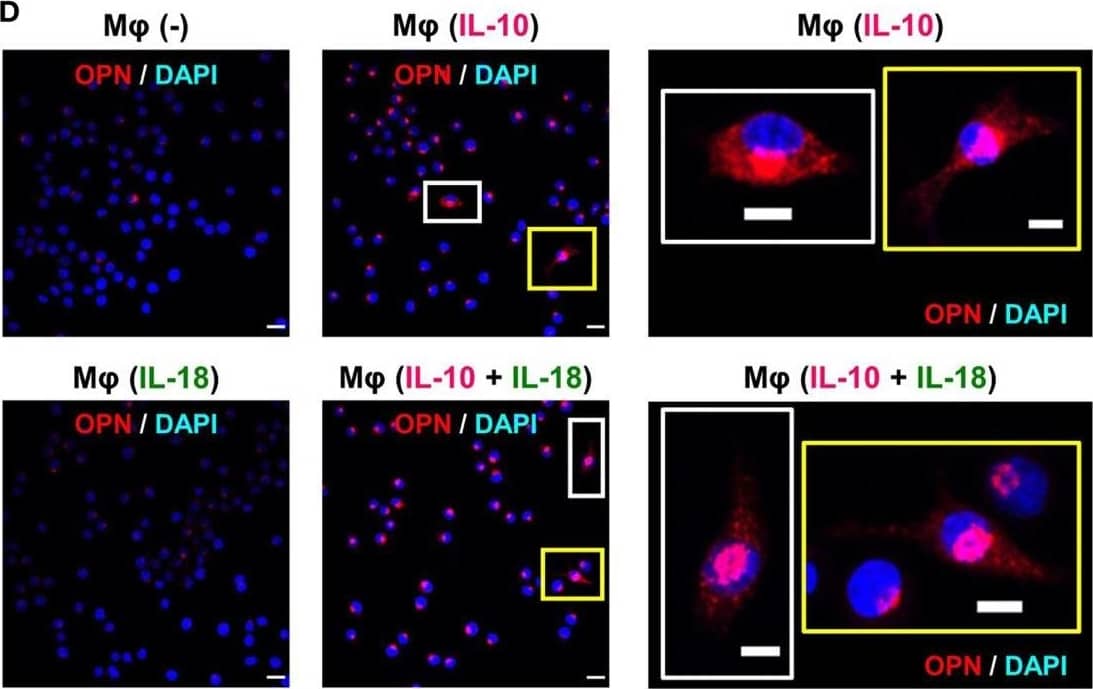
Osteopontin (OPN) drives enhancement in macrophage (Mφ) M2 polarization and angiogenic capacity. (A) Representative images of protein expression profiles obtained by comprehensive protein array in each Mφ subset. Red arrowheads indicate OPN. (B) The mRNA expression level of Spp1 relative to glyceraldehyde-3-phosphate dehydrogenase (Gapdh) was analyzed by real-time reverse transcription polymerase chain reaction in each Mφ subset and was normalized to Mφ (–), n = 6 [***p < 0.001 vs. untreated, #p < 0.05 vs. interleukin (IL)-10 alone]. (C) The protein expression level of OPN relative to GAPDH was measured by western blotting and was normalized to Mφ (–), n = 10. Lower panels are typical images of each protein (***p < 0.001 vs. untreated, #p < 0.05 vs. IL-10 alone). (D) Representative confocal laser scanning immunofluorescence overlay images of OPN (red) and DAPI (blue) in each Mφ subset. Scale bar represents 20 µm. Images in the right row are magnified regions from white or yellow rectangles in the panels of corresponding groups. Scale bar represents 10 µm. (E) Relative mean fluorescence intensity (MFI) of CD163 was measured by FACS analysis in each Mφ subset. An anti-OPN antibody (Ab) and its isotype-matched control Ab were used at 3 µg/mL, n = 4 (***p < 0.001 vs. untreated, ##p < 0.01, #p < 0.05 vs. IL-10 alone, †††p < 0.001 vs. IL-10 + IL-18). (F) The total areas and lengths of tube-like structures were determined by the Matrigel tube formation assay where b.End5 was cocultured with each Mφ subset, n = 12 (***p < 0.001, **p < 0.01, *p < 0.05 vs. untreated, #p < 0.05 vs. IL-10 alone, †††p < 0.001 vs. IL-10 + IL-18). All data are expressed as means ± SEM and were analyzed by a one-way ANOVA followed by Tukey’s test. Image collected and cropped by CiteAb from the following publication (https://pubmed.ncbi.nlm.nih.gov/29559970), licensed under a CC-BY license. Not internally tested by R&D Systems.
Detection of Mouse Osteopontin/OPN by Immunocytochemistry/Immunofluorescence
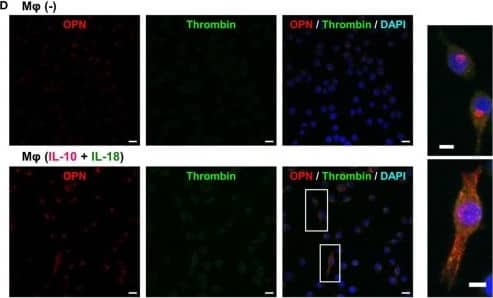
Thrombin contributes to macrophage (Mφ) M2 polarization and angiogenic capacity through proteolytic modification for osteopontin (OPN). (A) The mRNA expression level of Prothrombin relative to glyceraldehyde-3-phosphate dehydrogenase (Gapdh) was analyzed by reverse transcription polymerase chain reaction in each Mφ subset and were normalized to Mφ (–), n = 7 [***p < 0.001, **p < 0.01 vs. untreated, ##p < 0.01 vs. interleukin (IL)-10 alone]. (B,C) The protein expression levels of (B) thrombin or (C) OPN N-Half relative to GAPDH were measured by western blotting in each Mφ subset and were normalized to Mφ (–). Lower panels are typical images of each protein. (B)n = 8 (***p < 0.001, *p < 0.05 vs. untreated, #p < 0.05 vs. IL-10 alone). (C)n = 16 (***p < 0.001, *p < 0.05 vs. untreated, ##p < 0.01, #p < 0.05 vs. IL-10 alone, †††p < 0.001 vs. IL-10 + IL-18). (D) Representative confocal laser scanning immunofluorescence images of OPN (red), thrombin (green), and their merge with DAPI (blue) in each Mφ subset. Scale bar represents 20 µm. Higher magnification images are from the white rectangle region in merged panel of Mφ (IL-10 + IL-18). Scale bar represents 10 µm. (E) Relative mean fluorescence intensity (MFI) of CD163 was measured by FACS analysis in each Mφ subset. Hirudin, a specific thrombin inhibitor, was used at 1 µg/mL, n = 3 (***p < 0.001 vs. untreated, ###p < 0.001 vs. IL-10 alone, †††p < 0.001 vs. IL-10 + IL-18). (F) The total areas and lengths of tube-like structures were determined by the Matrigel tube formation assay where b.End5 were cocultured with each Mφ subset. Hirudin was used at 1 µg/mL, n = 6 (***p < 0.001, **p < 0.01 vs. untreated, ##p < 0.01, #p < 0.05 vs. IL-10 alone, †††p < 0.001 vs. IL-10 + IL-18). All data are expressed as means ± SEM and were analyzed by a one-way ANOVA followed by Tukey’s test. Image collected and cropped by CiteAb from the following publication (https://pubmed.ncbi.nlm.nih.gov/29559970), licensed under a CC-BY license. Not internally tested by R&D Systems.
Detection of Mouse Osteopontin/OPN by Immunocytochemistry/Immunofluorescence
Osteopontin (OPN) drives enhancement in macrophage (Mφ) M2 polarization and angiogenic capacity. (A) Representative images of protein expression profiles obtained by comprehensive protein array in each Mφ subset. Red arrowheads indicate OPN. (B) The mRNA expression level of Spp1 relative to glyceraldehyde-3-phosphate dehydrogenase (Gapdh) was analyzed by real-time reverse transcription polymerase chain reaction in each Mφ subset and was normalized to Mφ (–), n = 6 [***p < 0.001 vs. untreated, #p < 0.05 vs. interleukin (IL)-10 alone]. (C) The protein expression level of OPN relative to GAPDH was measured by western blotting and was normalized to Mφ (–), n = 10. Lower panels are typical images of each protein (***p < 0.001 vs. untreated, #p < 0.05 vs. IL-10 alone). (D) Representative confocal laser scanning immunofluorescence overlay images of OPN (red) and DAPI (blue) in each Mφ subset. Scale bar represents 20 µm. Images in the right row are magnified regions from white or yellow rectangles in the panels of corresponding groups. Scale bar represents 10 µm. (E) Relative mean fluorescence intensity (MFI) of CD163 was measured by FACS analysis in each Mφ subset. An anti-OPN antibody (Ab) and its isotype-matched control Ab were used at 3 µg/mL, n = 4 (***p < 0.001 vs. untreated, ##p < 0.01, #p < 0.05 vs. IL-10 alone, †††p < 0.001 vs. IL-10 + IL-18). (F) The total areas and lengths of tube-like structures were determined by the Matrigel tube formation assay where b.End5 was cocultured with each Mφ subset, n = 12 (***p < 0.001, **p < 0.01, *p < 0.05 vs. untreated, #p < 0.05 vs. IL-10 alone, †††p < 0.001 vs. IL-10 + IL-18). All data are expressed as means ± SEM and were analyzed by a one-way ANOVA followed by Tukey’s test. Image collected and cropped by CiteAb from the following publication (https://pubmed.ncbi.nlm.nih.gov/29559970), licensed under a CC-BY license. Not internally tested by R&D Systems.
Detection of Mouse Osteopontin/OPN by Immunocytochemistry/Immunofluorescence
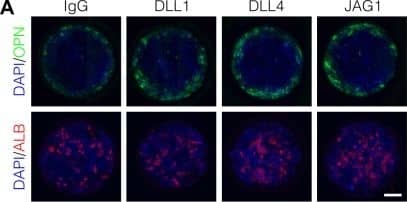
Localized differentiation of liver progenitors in arrayed patterns.(A) Immunolabeling of BMEL cells for the biliary marker OPN and hepatocyte marker ALB on arrayed collagen I patterns with control IgG or Fc-recombinant Notch ligands DLL1, DLL4, and JAG1. (B) Quantification of OPN+ cell counts as a function of radial distance from the centroid of each island. (C) Quantification of ALB+ cell counts as a function of radial distance from the centroid of each island. (D) Immunolabeling of BMEL cells presented with DLL4 for the biliary transcription factor SOX9 and hepatocyte transcription factor HNF4A. Arrow in each image indicates the same SOX9+/HNF4A− cell. Scale bar indicates 75 µm. (E, F) Regression analysis of OPN+ and ALB+ cell counts. Data in Figure 1B and Figure 1C were separated into peripheral and central subsets for which dimensionless radius was greater than 0.75 (R>0.75) and less than 0.75 (R<0.75). Separate multiple regression models were generated for each data subset for which coefficient estimates (corresponding to mean change in cell counts) and 95% CI were plotted for OPN+ (E) and ALB+ (F) cells. For each factor, 95% CI that do not intersect with the dashed line indicate regression coefficient estimates for which P<0.05. (A, E) Scale bars indicate 150 µm.10.7554/eLife.38536.007Figure 1—source data 1.Summary table for OPN data in Figure 1B.10.7554/eLife.38536.008Figure 1—source data 2.Summary table for ALB data in Figure 1C.Summary table for OPN data in Figure 1B.Summary table for ALB data in Figure 1C.Immunolabeling and quantification of CK19.(A) Immunolabeling of BMEL cells presented with IgG for the biliary marker CK19. (B) Quantification of CK19 intensity in BMEL cells presented with IgG as a function of radial distance from the centroid of each island. Asterisk (*) indicates P<0.001 for peak intensity (R>0.9) compared with central intensity (R<0.1) using Welch’s t-test.Immunolabeling of OPN and CK19 at t=24h and cell density with radius at t=72h.(A) Immunolabeling at t=24h of BMEL cells on 30 kPa substrates presented with IgG and DLL4 for the biliary markers OPN and CK19. Scale bar indicates 75 µm. (B) Measurement of cell density with radius for 30 kPa and 4 kPa substrates at t=72h. Vertical black bars indicate computed mean radius using the most central 95% of cells within the data set.Immunolabeling for OPN with 300, 600, and 1000 µm diameter patterns.(A) Immunolabeling for OPN of BMEL cells presented with DLL4 on 30 kPa substrates at t=72h. Both 300 µm and 1000 µm pattern diameters were included in this experiment in addition to the 600 µm pattern diameter. Scale bars indicate 150 µm. (B) Quantification of peak OPN+ cell counts for 300, 600, and 1000 µm diameter pattern. Boxplots show median, 25th and 75th percentiles (hinges), and 1.5 × IQR (whiskers). Image collected and cropped by CiteAb from the following publication (https://pubmed.ncbi.nlm.nih.gov/30589410), licensed under a CC-BY license. Not internally tested by R&D Systems.
Detection of Osteopontin/OPN by Immunohistochemistry
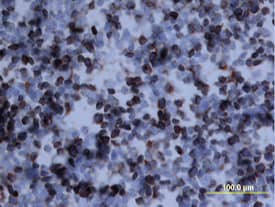
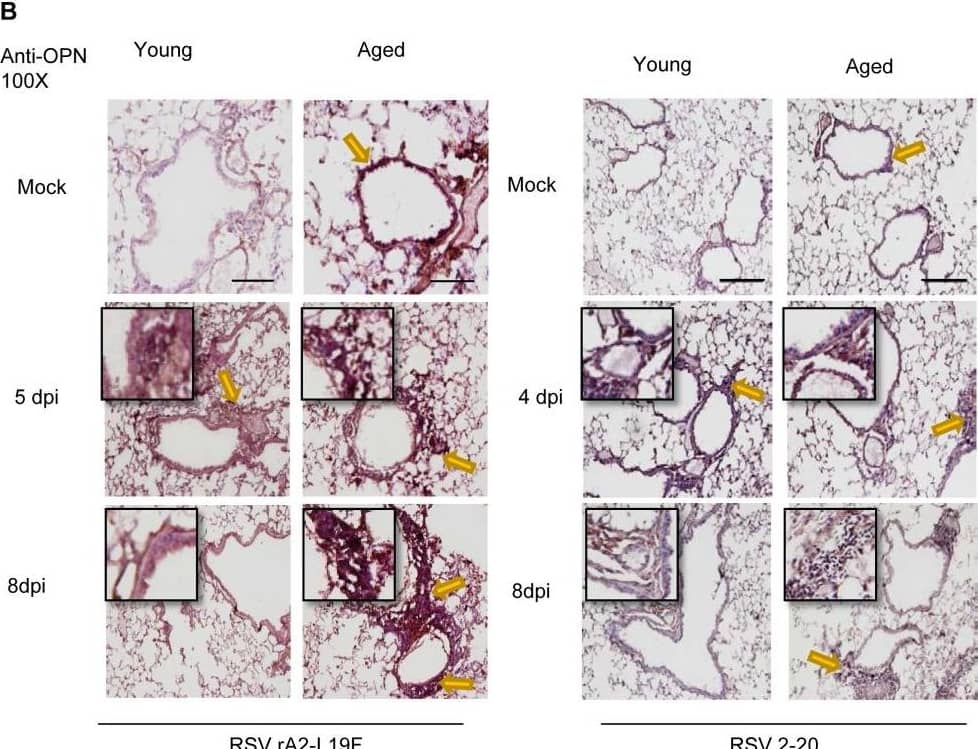
Aging results in diminished OPN production in response to 2-20 RSV infection.Young and aged BALB/c mice (n = 4/group) were intranasally infected with a dose of 106 pfu/mouse of A2 or 105 pfu/mouse of 2-20) and total lung RNA was collected on time points indicated. (A-B) RNA transcripts of OPN were analyzed with qRT-PCR and represented as a relative ratio of target gene expression to endogenous mouse HPRT and examined with rA2-L19F, 2-20, or A2. (B) 5 µm lung sections obtained at 4, 5 and 8 dpi with either rA2-L19F, 2-20, or A2 infected young and aged mice. Lung sections were immunostained for anti-mouse OPN and nickel-DAB reagent before counterstaining with hematoxylin and eosin. Representative images shown are at 100x magnification with inset [400x] displaying nickel-DAB (dark brown/black staining) positive cells and contrast the hematoxylin (light blue) nuclear stain. Representative images are shown with scale bar indicating 100 µm. (C) Enumeration of OPN-positive cells was performed with ImmunoRatio ImageJ analysis on 200X magnified lung sections from 8 dpi and values are shown as a percentage of total hematoxylin-stained cells in an individual box plot with mean interval bars. Within a single frame, at least 5 frames per mouse (n = 4/group) were collected and individual dot plots are shown of either aged or young mice with interval bars and significance, determined with ANOVA and Fisher's test (p<0.05). (D) qRT-PCR was performed on total lung RNA from young and aged 2–20 RSV infected mice for mRNA expression of OPN receptor CD44. Statistical significance was determine with ANOVA 2-way analysis with p<0.05. All experiments were performed in triplicate. Image collected and cropped by CiteAb from the following open publication (https://pubmed.ncbi.nlm.nih.gov/24558422), licensed under a CC-BY license. Not internally tested by R&D Systems.

