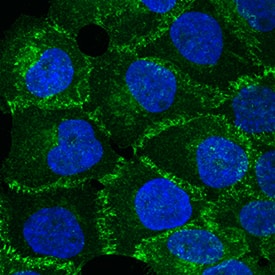
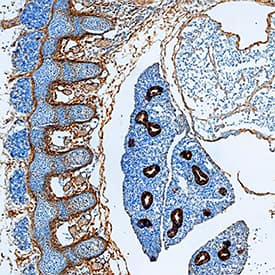
Detection of P-Cadherin in Human Liver.
P-Cadherin was detected in immersion fixed paraffin-embedded sections of human liver using Goat Anti-Mouse P-Cadherin Antigen Affinity-purified Polyclonal Antibody (Catalog # AF761) at 0.5 µg/ml for 1 hour at room temperature followed by incubation with the Anti-Goat IgG VisUCyte™ HRP Polymer Antibody (Catalog #
VC004). Before incubation with the primary antibody, tissue was subjected to heat-induced epitope retrieval using VisUCyte Antigen Retrieval Reagent-Basic (Catalog #
VCTS021). Tissue was stained using DAB (brown) and counterstained with hematoxylin (blue). Specific staining was localized to the cell membrane of hepatocytes. View our protocol for IHC Staining with VisUCyte HRP Polymer Detection Reagents.
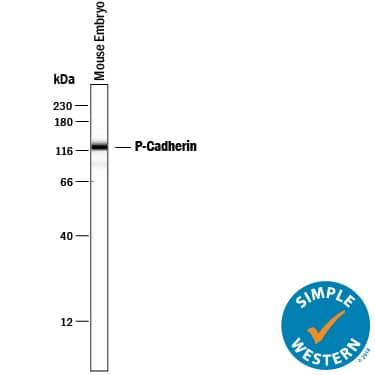
Detection of Mouse P‑Cadherin by Simple WesternTM.
Simple Western lane view shows lysates of mouse embryo tissue, loaded at 0.2 mg/mL. A specific band was detected for P-Cadherin at approximately 115 kDa (as indicated) using 25 µg/mL of Goat Anti-Mouse P-Cadherin Antigen Affinity-purified Polyclonal Antibody (Catalog # AF761) followed by 1:50 dilution of HRP-conjugated Anti-Goat IgG Secondary Antibody (
HAF109). This experiment was conducted under reducing conditions and using the 12-230 kDa separation system.
Detection of Mouse P-Cadherin by Western Blot
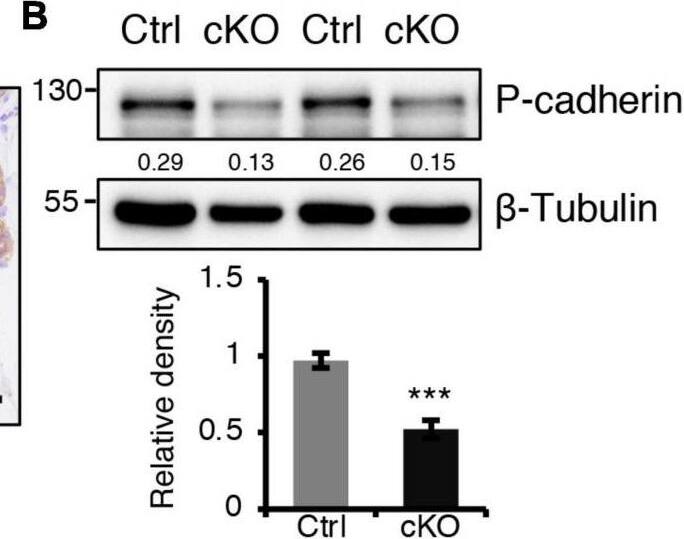
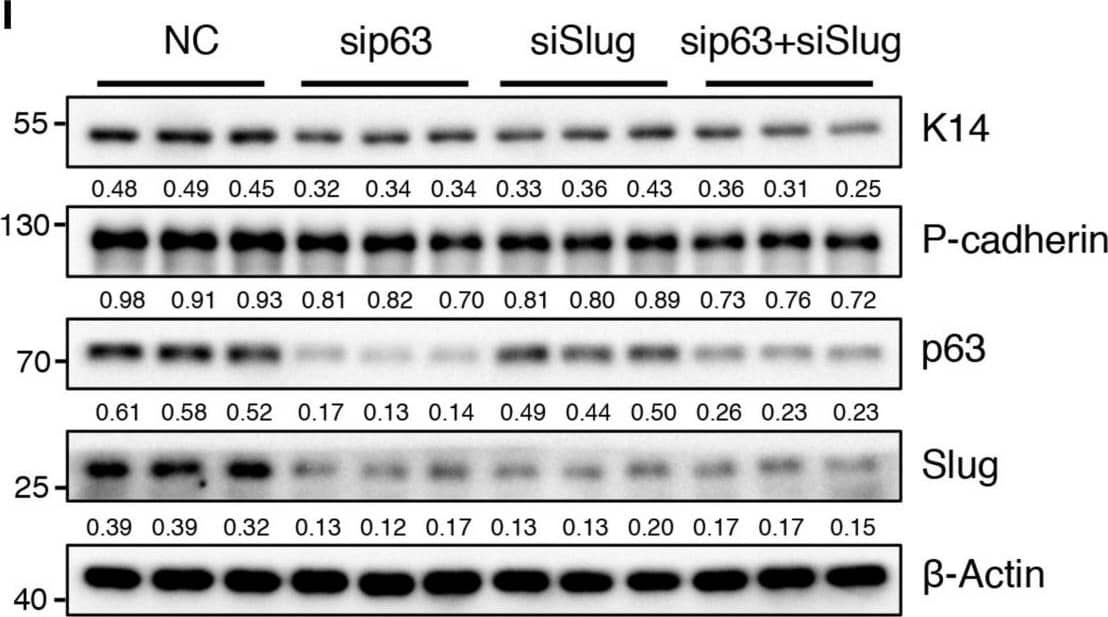
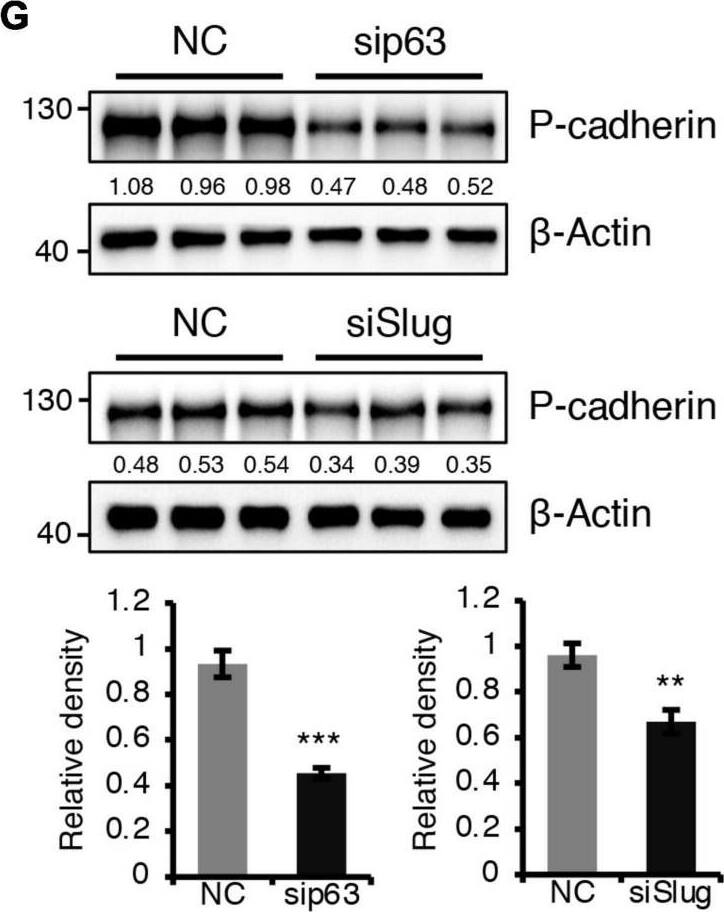
BMPR1a regulated P-cadherin expression via p63 and Slug. (A) Immunohistochemistry staining for P-cadherin in control (n = 4 mice) and cKO (n = 3 mice) mammary glands at pregnancy day 14.5. Scale bar, 50 μm. (B) Western blotting for P-cadherin in mammary epithelial cells isolated from control and cKO mice at pregnancy day 14.5. beta-Tubulin was used as a loading control. Statistical analysis the expression of P-cadherin/ beta-Tubulin. n = 3 mice. (C) qRT-PCR analysis of Cdh3 in FACS-sorted control and cKO myoepithelial cells at pregnancy day 14.5. n = 4 biological replicates. (D) P-cadherin (red) and K14 (green) double immunofluorescence staining in HC11 mammary epithelial cells treated with BMP4 (50 ng/mL) for 24 h. n = 3 biological replicates. Scale bar, 25 μm. (E) Western blotting for P-cadherin in HC11 mammary epithelial cells treated with BMP4 (50 ng/mL) for 24 h. beta-Tubulin was used as a loading control. Statistical analysis the expression of P-cadherin/ beta-Tubulin. n = 3 biological replicates. (F) Scatter plot showing the correlation between BMPR1A and CDH3 expression in mammary glands from TCGA and GTEx data. Pearson’s coefficient test was performed to assess statistical significance. (G) Western blotting for P-cadherin in HC11 cells treated with p63 siRNA (sip63)/Slug siRNA (siSlug) and scramble RNA (NC) at 48 h. beta-Actin was used as a loading control. Statistical analysis the expression of P-cadherin/ beta-Actin. n = 3 biological replicates. (H) Immunofluorescence for P-cadherin (green) in HC11 cells treated with p63 siRNA (sip63)/Slug siRNA (siSlug) and scramble RNA (NC) at 48 h. n = 3 biological replicates. Scale bar, 25 μm. (I) Western blotting for K14, P-cadherin, p63 and Slug in HC11 cells treated with scramble RNA, p63 siRNA, Slug siRNA, or p63 siRNA and Slug siRNA at 48 h. beta-Actin was used as a loading control. Statistical analysis the expression of K14/ beta-Actin, P-cadherin/ beta-Actin, p63/ beta-Actin and Slug/ beta-Actin. n = 3 biological replicates. Data were presented as means ± SD. ∗p < 0.05, ∗∗p < 0.01, ∗∗∗p < 0.001. Image collected and cropped by CiteAb from the following open publication (https://pubmed.ncbi.nlm.nih.gov/34336839), licensed under a CC-BY license. Not internally tested by R&D Systems.
Detection of Mouse P-Cadherin by Immunohistochemistry
Additional analysis of epidermal perturbations upon Mettl3 cKO. (E) Images of P0 back skin sagittal sections immulabeled for K10, involucrin (iNV), loricrin (LOR)&filaggrin (FLG) demonstrating the expression pattern of standard differentiation markers is not severely interrupted by Mettl3 cKO (scale bars: 50 µm). Solid&dashed lines as in (B). Image collected & cropped by CiteAb from the following open publication (https://pubmed.ncbi.nlm.nih.gov/32845239), licensed under a CC-BY license. Not internally tested by R&D Systems.
Detection of Mouse P-Cadherin by Immunohistochemistry
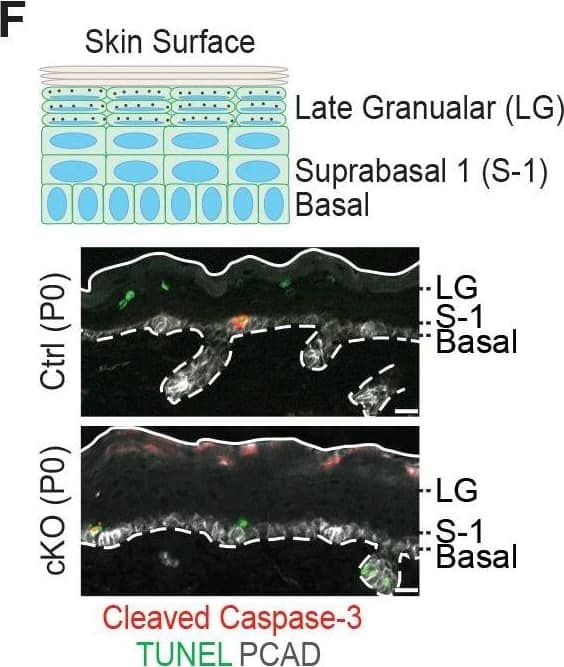
Additional analysis of epidermal perturbations upon Mettl3 cKO. (F) Representative images of P0 back skin sagittal sections with cleaved Caspase-3 immunostaining&TUNEL staining (scale bars: 20 µm). White solid lines indicate skin surface&dashed lines indicate dermal-epithelial border. Quantification of TUNEL+&cleaved Caspase-3+ cells in the designated layers at P0. Only double-positive cells denote apoptosis; TUNEL+ only cells are typically seen as granular cells lose their nuclei&transition as dead flattened cells to the stratum corneum. This is defective in Mettl3 cKO skin. The TUNEL+ cells in the suprabasal 1 layer likely correspond to the occasional cytolytic suprabasal cells that we saw at the ultrastructural level (not shown). Quantification of the labeled cells is shown (error bars: standard deviation, for each condition n = 3 biological replicates × 10 images per replicate, *p<0.05 and **p<0.01 by unpaired two-tailed Student’s t-test).Figure 6—figure supplement 2—source data 1.Quantification of PCAD, ECAD immunofluorescence signals in (A).Figure 6—figure supplement 2—source data 2.Quantification of EdU+ cells&the suprabasal/basal cell number ratio in (B).Figure 6—figure supplement 2—source data 3.Quantification of cell sizes by cytospin in (C).Figure 6—figure supplement 2—source data 4.Quantification of cell death events in epidermis in (F).Quantification of PCAD, ECAD immunofluorescence signals in (A).Quantification of EdU+ cells&the suprabasal/basal cell number ratio in (B).Quantification of cell sizes by cytospin in (C).Quantification of cell death events in epidermis in (F). Image collected & cropped by CiteAb from the following open publication (https://pubmed.ncbi.nlm.nih.gov/32845239), licensed under a CC-BY license. Not internally tested by R&D Systems.
Detection of Mouse P-Cadherin by Immunohistochemistry
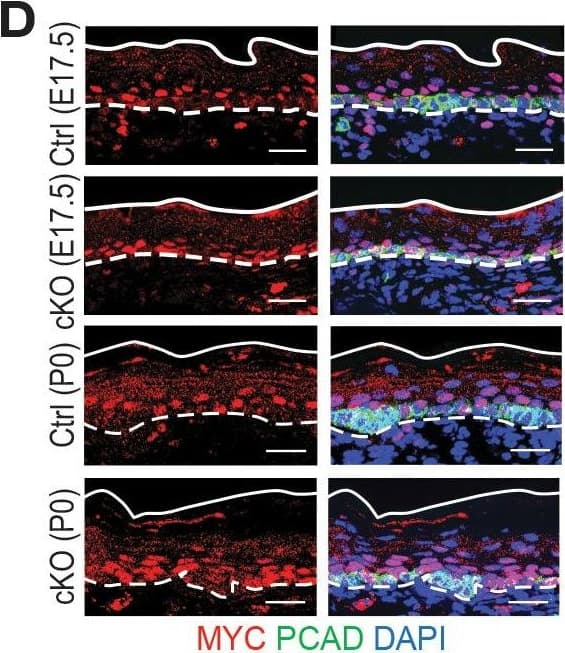
Additional analysis of features affected by the upregulated genes upon Mettl3 cKO.(A) ECDF plots of the Z score (cKO/Ctrl) from scRNA-seq demonstrate transcripts with higher levels of m6A modification (assessed by the coding sequence SN-uTPM per nt value from miCLIP) in wild-type tend to be more upregulated upon METTL3 loss. The p values were calculated through Wilcoxon rank sum test. (B, C) Violin plots illustrating the relative expression levels of Bmyc and Myc mRNA in corresponding groups of Mettl3 cKO versus control cells. Z score assessment of expressional difference between cKO and control [Z (cKO/Ctrl)] and false discovery rate (FDR) is calculated by MAST. The upregulation is verified with qPCR on total RNA samples extracted from YFP+ skin epithelial cells FACS isolated from E16.5 embryos with Tbp mRNA as internal control (error bars: standard deviation, for each condition n = 3 biological replicates, **p<0.01 by unpaired two-tailed Student’s t-test). (D) Images from E17.5 and P0 sagittal sections immunolabeled for MYC and PCAD (scale bars: 25 µm). White solid lines denote skin surface and dashed lines denote dermal:epidermal border. Quantifications of MYC immunofluorescence specifically in the Epi basal cells (identified based on PCAD staining) reveals the upregulation of MYC in cKO samples (for each condition n = 3 biological replicates ×7 images per replicate, *p<0.05 and ***p<0.001 by unpaired two-tailed Student’s t-test).Figure 7—figure supplement 1—source data 1.Bmyc qPCR in (B).Figure 7—figure supplement 1—source data 2.Myc qPCR in (C).Figure 7—figure supplement 1—source data 3.Quantification of MYC immunofluorescence signals in (D).Bmyc qPCR in (B).Myc qPCR in (C).Quantification of MYC immunofluorescence signals in (D). Image collected and cropped by CiteAb from the following open publication (https://pubmed.ncbi.nlm.nih.gov/32845239), licensed under a CC-BY license. Not internally tested by R&D Systems.
Detection of Mouse P-Cadherin by Immunohistochemistry
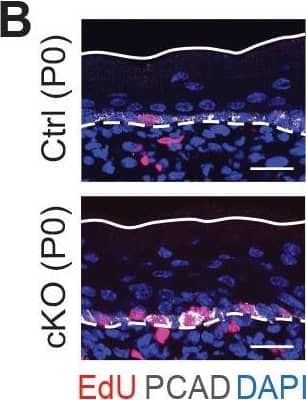
Additional analysis of epidermal perturbations upon Mettl3 cKO. (B) Left panel: representative images from P0 sagittal sections with a 45-min EdU pulse prior to tissue collection (scale bars: 25 µm). Solid lines, skin surface boundary; dashed lines, dermal-epidermal border. Middle panel: quantification of the ratio of EdU+ cells among all basal cells (for each condition n = 3 biological replicates ×10 images per replicate, ***p<0.001 by unpaired two-tailed Student’s t-test). Right panel: quantification of the suprabasal cell number/basal cell number ratio according to DAPI staining of the nuclei (for each condition n = 5 biological replicates ×10 images per replicate, ***p<0.001 by unpaired two-tailed Student’s t-test). Image collected & cropped by CiteAb from the following open publication (https://pubmed.ncbi.nlm.nih.gov/32845239), licensed under a CC-BY license. Not internally tested by R&D Systems.
Detection of Mouse P-Cadherin by Immunohistochemistry
Loss of m6A results in diminished WNT signaling&signs of perturbed HF fate.(A) Left panel: representative images from E17.5 sagittal sections immunolabeled for LEF1&PCAD (scale bars: 50 µm). White solid lines denote skin surface&dashed lines denote dermal-epidermal border. Right panel: quantification of LEF1 immunofluorescence at indicated compartments (for each condition n = 3 biological replicates ×7 images per replicate, *p<0.05&***p<0.001 by unpaired two-tailed Student’s t-test). Image collected & cropped by CiteAb from the following open publication (https://pubmed.ncbi.nlm.nih.gov/32845239), licensed under a CC-BY license. Not internally tested by R&D Systems.
Detection of Mouse P-Cadherin by Immunohistochemistry
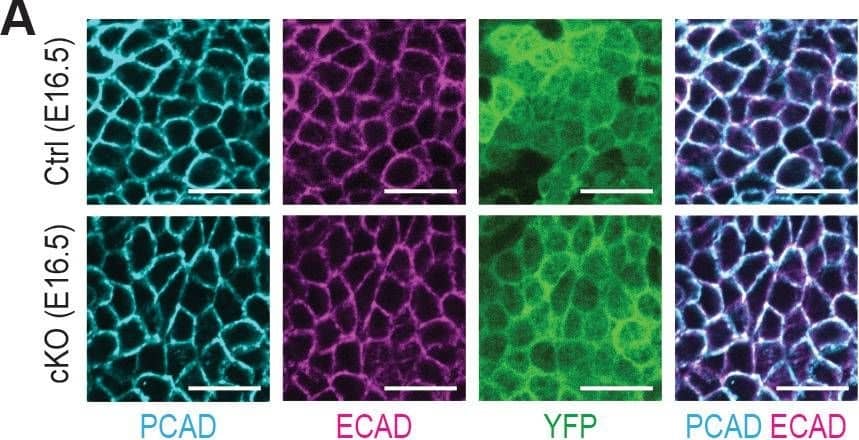
Additional analysis of epidermal perturbations upon Mettl3 cKO.(A) Confocal images of E16.5 whole-mount back skin immunolabeled for PCAD, ECAD&YFP (scale bars: 20 µm). PCAD&ECAD expression was quantified in the basal progenitors of skin epithelium (middle line corresponds to the median; for each condition the data are from two biological replicates; ****p<0.0001 by Mann Whitney test). Image collected & cropped by CiteAb from the following open publication (https://pubmed.ncbi.nlm.nih.gov/32845239), licensed under a CC-BY license. Not internally tested by R&D Systems.
Detection of Mouse P-Cadherin by Immunohistochemistry
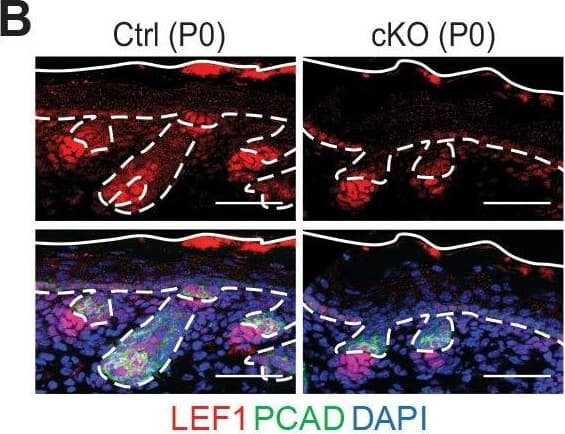
Loss of m6A results in diminished WNT signaling&signs of perturbed HF fate. (B) Left panel: representative images from P0 sagittal sections immunolabeled for LEF1&PCAD (scale bars: 50 µm). Solid&dashed lines as in (A). Right panel: quantifications of LEF1 immunofluorescence in indicated compartments (for each condition n = 3 biological replicates ×7 images per replicate, *p<0.05&***p<0.001 by unpaired two-tailed Student’s t-test). Image collected & cropped by CiteAb from the following open publication (https://pubmed.ncbi.nlm.nih.gov/32845239), licensed under a CC-BY license. Not internally tested by R&D Systems.
Detection of Mouse P-Cadherin by Immunohistochemistry
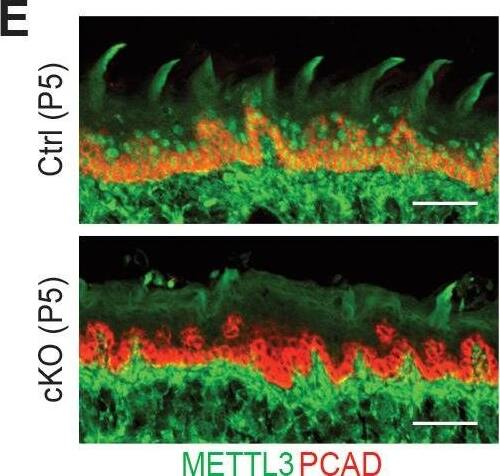
Additional information on the Mettl3 cKO phenotypes.(A) Representative pictures of P6 control and cKO littermates (scale bars: 1 cm). (B) Quantification of body weights of control and cKO littermates (error bars: standard deviation, for each condition n = 5 biological replicates from three litters). (C) Measurements of TEWL (error bars: standard deviation, for each condition n = 4 biological replicates, for the comparison between control and cKO at each time point, p>0.05 by unpaired two-tailed Student’s t-test). (D) Representative pictures of P5 pups’ mouths demonstrating the growth of the teeth (black arrows). (E) Images of P5 tongue sagittal sections immunolabeled for METTL3 and PCAD demonstrating the tongue surface of the Mettl3 cKO animals tends to be smoother than that of the control animals, which suggests filiform papillae are not well-formed in the cKO animals (scale bars: 50 µm). (F) Hematoxylin and eosin (H and E) stained P6 back skin sagittal sections (scale bars: 100 µm).Figure 2—figure supplement 2—source data 1.Quantification of neonates' body weights in (B).Figure 2—figure supplement 2—source data 2.Quantification of TEWL in (C).Quantification of neonates' body weights in (B).Quantification of TEWL in (C). Image collected and cropped by CiteAb from the following open publication (https://pubmed.ncbi.nlm.nih.gov/32845239), licensed under a CC-BY license. Not internally tested by R&D Systems.
Detection of Mouse P-Cadherin by Immunohistochemistry
Krt14-Cre driven conditional Mettl3 knockout mice display severe defects in HF morphogenesis. (B) Confocal images of E16.5 whole-mount back skin immunolabeled for P-cadherin (PCAD), METTL3&YFP (scale bars: 20 µm). Note that nuclear METTL3 immunofluorescence is selectively depleted from the YFP+ cells in cKO skin. White dashed lines denote the dermal-epidermal border. Image collected & cropped by CiteAb from the following open publication (https://pubmed.ncbi.nlm.nih.gov/32845239), licensed under a CC-BY license. Not internally tested by R&D Systems.


