Mouse Rae-1 Pan Specific Antibody
R&D Systems, part of Bio-Techne | Catalog # AF1136

Key Product Details
Species Reactivity
Validated:
Cited:
Applications
Validated:
Cited:
Label
Antibody Source
Product Specifications
Immunogen
Leu29-Ser231
Accession # O08604
Specificity
Clonality
Host
Isotype
Endotoxin Level
Scientific Data Images for Mouse Rae-1 Pan Specific Antibody
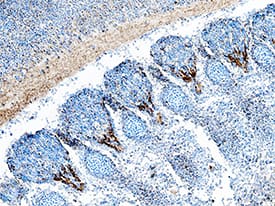
Rae‑1 in Mouse Embryo.
Rae-1 was detected in immersion fixed frozen sections of mouse embryo (13 d.p.c.) using Goat Anti-Mouse Rae-1 Pan Specific Antigen Affinity-purified Polyclonal Antibody (Catalog # AF1136) at 5 µg/mL overnight at 4 °C. Tissue was stained using the Anti-Goat HRP-DAB Cell & Tissue Staining Kit (brown; Catalog # CTS008) and counterstained with hematoxylin (blue). Specific staining was localized to axons of primary sensory neurons. View our protocol for Chromogenic IHC Staining of Frozen Tissue Sections.Detection of Mouse Rae-1 by Western Blot
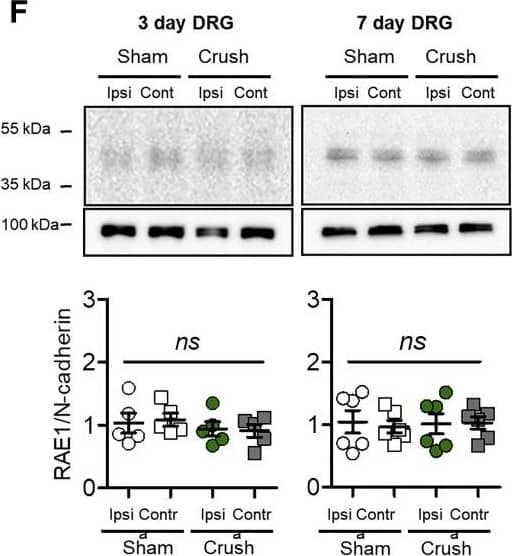
Sciatic Nerve Crush Increases RAE1 in Peripheral Nerve Axons(A) Schematic diagram of sciatic nerve crush injury site in relation to lumbar DRGs (L3, L4, and L5).(B) Raet1 mRNA expression in ipsilateral L3–5 DRG 3 and 7 days after surgery by qPCR. Two-way ANOVA: effect of injury, F(1,8) = 180.95, p < 0.0001; effect of time, F(1,8) = 8.04, p = 0.0220. Bonferroni post-test: 3 days, t = 7.507, ∗∗∗p < 0.001; 7 days, t = 11.52, ∗∗∗p < 0.001. n = 3 mice per surgery per time point.(C) In situ hybridization with Raet1 probe (red) in L4 DRG immunolabeled for NeuN (blue) 6 days after partial sciatic nerve crush injury. Scale bar, 50 μm.(D) Distribution of Raet1 in situ spots in L4 DRG ipsi and contralateral to sciatic crush. Kolmogorov-Smirnov (KS) test: ∗∗∗p < 0.0001, KS D-value 0.2297. n = 3 mice, n = 3 sections per ipsi and contralateral DRG per mouse.(E) (Top) Pan-RAE1 western blot of sciatic nerve tissue (40 μg protein loading) 3 days after sciatic nerve crush or sham surgery. Neuronal cadherin control is shown. (Bottom) Relative expression of RAE1 protein in ipsilateral versus contralateral sciatic nerves 3 and 7 days after sham or crush surgery. One-way ANOVA, 3 days: F(3,16) = 8.505, p = 0.0013. Bonferroni post-test: sham ipsi versus contra, t = 0.2025, ns p > 0.05; crush ipsi versus contra, t = 3.678, ∗p < 0.05; ipsi sham versus crush, t = 4.438, ∗∗p < 0.01. One-way ANOVA, 7 days: F(3,16) = 5.119, p = 0.0113. Bonferroni post-test: sham ipsi versus contra, t = 0.1438, ns p > 0.05; crush ipsi versus contra, t = 3.342, ∗p < 0.05; ipsi sham versus crush, t = 3.043, ∗p < 0.05 (n = 5 mice per surgery group per time point).(F) (Top) Pan-RAE1 western blot of DRG (L3–5) tissue (40 μg protein loading) 3 days after sciatic nerve crush or sham surgery. Neuronal cadherin control. (Bottom) Relative expression of RAE1 protein in ipsilateral versus contralateral DRG 3 and 7 days after sham or crush surgery. One-way ANOVA: 3 days, F(3,16) = 0.438, p = 0.7288; 7 days, F(3,20) = 0.053, p = 0.983 (n = 5–6 mice per surgery group per time point).(G) Composite images of RAE1 immunolabeling in full-length contralateral and ipsilateral sciatic nerves taken from three individual mice 3 days after tight sciatic nerve ligation. Arrow, ligation site; arrowhead, proximal to ligation.(H) Maximum projection images of RAE1 (green) co-localization with axonal marker beta-tubulin III (magenta) in sciatic nerve 3 days after tight ligation. Scale bars, 50 μm.See also Figures S3 and S4. Image collected and cropped by CiteAb from the following open publication (https://pubmed.ncbi.nlm.nih.gov/30712871), licensed under a CC-BY license. Not internally tested by R&D Systems.Detection of Mouse Rae-1 by Western Blot
Sciatic Nerve Crush Increases RAE1 in Peripheral Nerve Axons(A) Schematic diagram of sciatic nerve crush injury site in relation to lumbar DRGs (L3, L4, and L5).(B) Raet1 mRNA expression in ipsilateral L3–5 DRG 3 and 7 days after surgery by qPCR. Two-way ANOVA: effect of injury, F(1,8) = 180.95, p < 0.0001; effect of time, F(1,8) = 8.04, p = 0.0220. Bonferroni post-test: 3 days, t = 7.507, ∗∗∗p < 0.001; 7 days, t = 11.52, ∗∗∗p < 0.001. n = 3 mice per surgery per time point.(C) In situ hybridization with Raet1 probe (red) in L4 DRG immunolabeled for NeuN (blue) 6 days after partial sciatic nerve crush injury. Scale bar, 50 μm.(D) Distribution of Raet1 in situ spots in L4 DRG ipsi and contralateral to sciatic crush. Kolmogorov-Smirnov (KS) test: ∗∗∗p < 0.0001, KS D-value 0.2297. n = 3 mice, n = 3 sections per ipsi and contralateral DRG per mouse.(E) (Top) Pan-RAE1 western blot of sciatic nerve tissue (40 μg protein loading) 3 days after sciatic nerve crush or sham surgery. Neuronal cadherin control is shown. (Bottom) Relative expression of RAE1 protein in ipsilateral versus contralateral sciatic nerves 3 and 7 days after sham or crush surgery. One-way ANOVA, 3 days: F(3,16) = 8.505, p = 0.0013. Bonferroni post-test: sham ipsi versus contra, t = 0.2025, ns p > 0.05; crush ipsi versus contra, t = 3.678, ∗p < 0.05; ipsi sham versus crush, t = 4.438, ∗∗p < 0.01. One-way ANOVA, 7 days: F(3,16) = 5.119, p = 0.0113. Bonferroni post-test: sham ipsi versus contra, t = 0.1438, ns p > 0.05; crush ipsi versus contra, t = 3.342, ∗p < 0.05; ipsi sham versus crush, t = 3.043, ∗p < 0.05 (n = 5 mice per surgery group per time point).(F) (Top) Pan-RAE1 western blot of DRG (L3–5) tissue (40 μg protein loading) 3 days after sciatic nerve crush or sham surgery. Neuronal cadherin control. (Bottom) Relative expression of RAE1 protein in ipsilateral versus contralateral DRG 3 and 7 days after sham or crush surgery. One-way ANOVA: 3 days, F(3,16) = 0.438, p = 0.7288; 7 days, F(3,20) = 0.053, p = 0.983 (n = 5–6 mice per surgery group per time point).(G) Composite images of RAE1 immunolabeling in full-length contralateral and ipsilateral sciatic nerves taken from three individual mice 3 days after tight sciatic nerve ligation. Arrow, ligation site; arrowhead, proximal to ligation.(H) Maximum projection images of RAE1 (green) co-localization with axonal marker beta-tubulin III (magenta) in sciatic nerve 3 days after tight ligation. Scale bars, 50 μm.See also Figures S3 and S4. Image collected and cropped by CiteAb from the following open publication (https://pubmed.ncbi.nlm.nih.gov/30712871), licensed under a CC-BY license. Not internally tested by R&D Systems.Applications for Mouse Rae-1 Pan Specific Antibody
Blockade of Receptor-ligand Interaction
Immunohistochemistry
Sample: Immersion fixed frozen sections of mouse embryo (13 d.p.c.)
Western Blot
Sample: Recombinant Mouse Rae-1 gamma Fc Chimera (Catalog # 1136-RA)
Formulation, Preparation, and Storage
Purification
Reconstitution
Formulation
Shipping
Stability & Storage
- 12 months from date of receipt, -20 to -70 °C as supplied.
- 1 month, 2 to 8 °C under sterile conditions after reconstitution.
- 6 months, -20 to -70 °C under sterile conditions after reconstitution.
Background: Rae-1
Rae-1 gamma is a member of a family of cell-surface proteins that function as ligands for mouse NKG2D. Other family members are designated Rae-1 alpha, beta, delta and epsilon. Amino acid sequence identity within this family ranges from 88‑95%. The Rae-1 proteins are distantly related to MHC class I proteins, but they possess only the alpha1 and alpha2 Ig-like domains, and they have no capacity to bind peptide or interact with beta2-microglobulin. The genes encoding these proteins are not found within the Major Histocompatibility Complex on mouse chromosome 17, but rather map to mouse chromosome 10. The Rae-1 proteins are anchored to the membrane via a GPI-linkage. The name of this family derives from the original identification of these proteins as the product of retinoic acid early inducible transcripts. Rae-1 expression is developmentally controlled. Transcripts were observed in the brain/head region of day 10‑14 embryos but disappeared by day 18. Rae-1 transcripts were detected in several transformed cell lines but are absent from most normal adult tissues. All Rae-1 family members bind to mouse NKG2D, an activating receptor expressed on NK cells and some T cell subsets, resulting in the activation of cytolytic activity and/or cytokine production by these effector cells. Ectopic expression of Rae-1 on mouse tumor cell lines resulted in the in vivo rejection of the tumors (1‑6).
References
- Zou, Z. et al. (1996) J. Biochem (Tokyo) 119:319.
- Diefenbach, A. et al. (2000) Nature Immunol. 1:119.
- Cerwenka, A. et al. (2000) Immunity 12:721.
- Cerwenka, A. et al. (2001) Proc. Natl. Acad. Sci. USA 98:11521.
- Diefenbach, A. et al. (2001) Nature 413:165.
- NKG2D and its Ligands, www.RnDSystems.com.
Long Name
Alternate Names
Gene Symbol
UniProt
Additional Rae-1 Products
Product Documents for Mouse Rae-1 Pan Specific Antibody
Product Specific Notices for Mouse Rae-1 Pan Specific Antibody
For research use only


