Detection of Normal Goat IgG Control by Immunocytochemistry/ Immunofluorescence
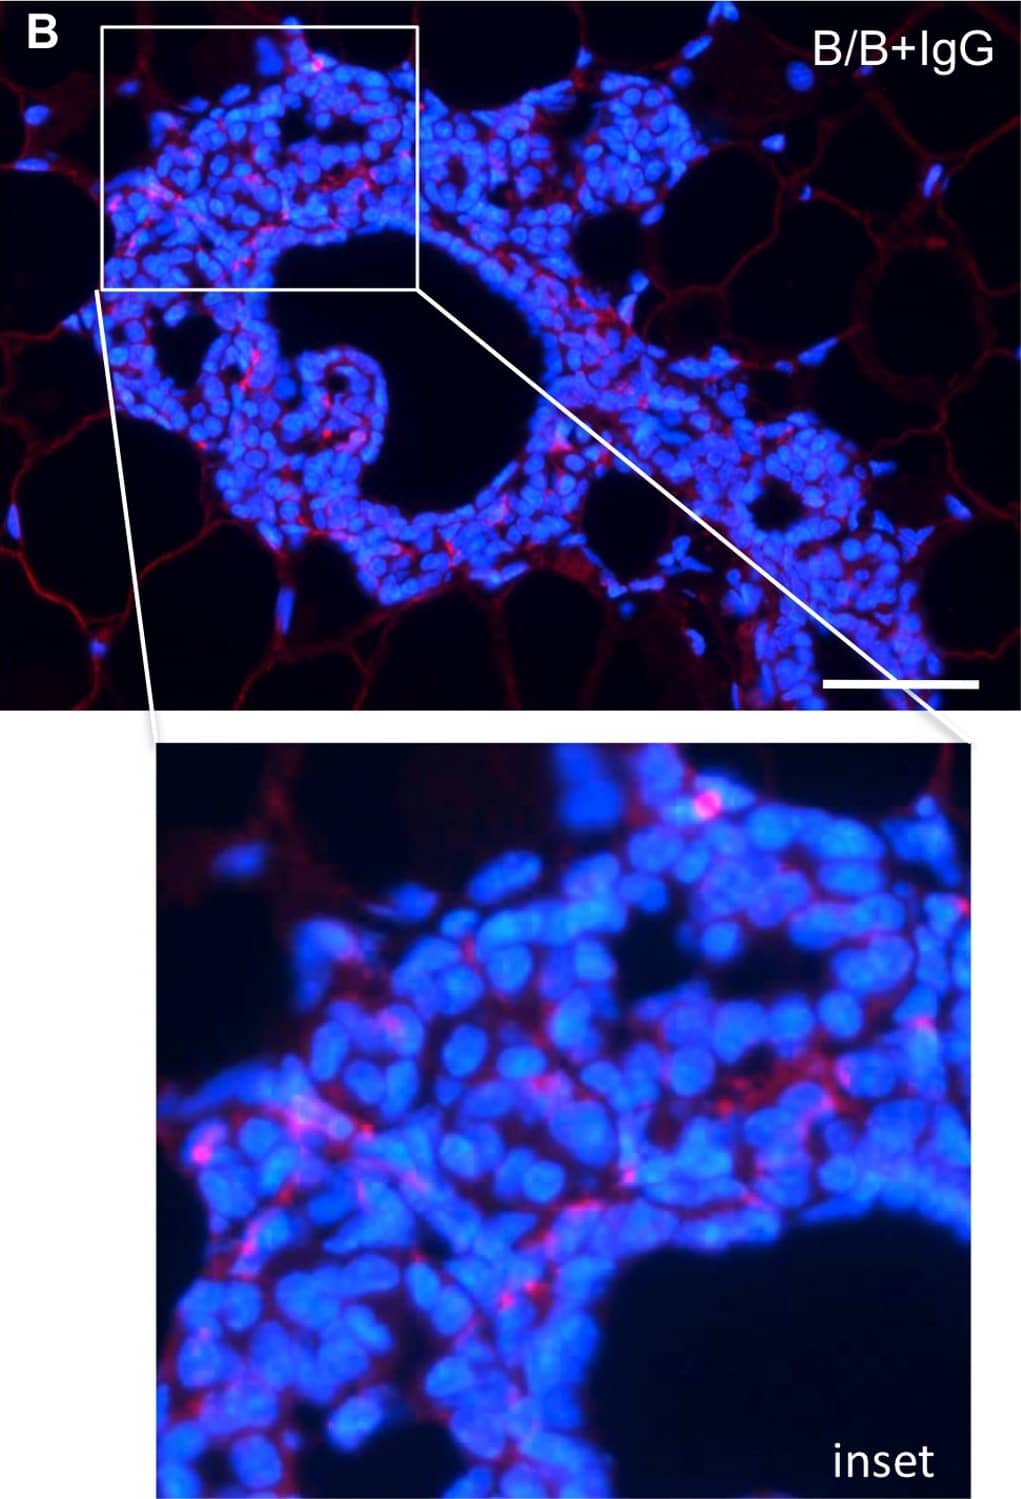
iFGFR1 activation in vivo promotes recruitment of CX3CR1-positive macrophages.MMTV-iFGFR1 transgenic mice were treated with B/B in order to analyze the population of macrophages that are recruited to the mammary epithelium during early stages of iFGFR1-induced mammary tumorigenesis. A) MMTV-iFGFR1 mice treated with B/B demonstrated an increase in macrophage recruitment after 10 days as indicated by an increased in the number of F4/80 positive cells. MMTV-iFGFR1 mice treated with anti-CX3CR1 in conjunction with B/B demonstrated a reduction in macrophage recruitment at 10 days indicating that iFGFR1 activation is responsible for recruiting a subset of macrophages that express CX3CR1. ***p<0.0001. Error bars represent SEM. B) Representative image of macrophages associated with budding epithelial structures in mammary glands from mice treated with control IgG antibody. C) Representative image of macrophages associated with budding epithelial structures in mammary glands from mice treated with anti-CX3CR1. Red = F4/80 staining, blue = DAPI. Scale bars represent 50 µM. Results in each figure panel are representative of a minimum of three different mice for each treatment group and genotype. Image collected and cropped by CiteAb from the following open publication (https://dx.plos.org/10.1371/journal.pone.0045877), licensed under a CC-BY license. Not internally tested by R&D Systems.
Detection of Rat Normal Goat IgG Control by Immunocytochemistry/ Immunofluorescence
Blocking the tissue inhibitor of metalloproteinase type 1 (TIMP-1) in MSC-CM reduced its pro-oligodendroglial activity on cultured aNSCs. Representative immunocytochemical staining of 2′,3′-cyclic-nucleotide 3′-phosphodiesterase (CNPase)- (A) and GFAP-positive (B) cells treated either with control (no antibody), anti-TIMP-1, or immunoglobulin G (IgG) control pre-incubated with alpha-MEM or MSC-CM after 3 days in culture. (C) Quantification of CNPase- and GFAP-positive (D) cell numbers. Number of experiments n = 4. Statistical significance was calculated using a two-way ANOVA with Bonferroni posttest: * p ≤ 0.05, ** p ≤ 0.01, *** p ≤ 0.001. Image collected and cropped by CiteAb from the following publication (https://pubmed.ncbi.nlm.nih.gov/32570968), licensed under a CC-BY license. Not internally tested by R&D Systems.
Detection of Human Normal Goat IgG Control by Western Blot
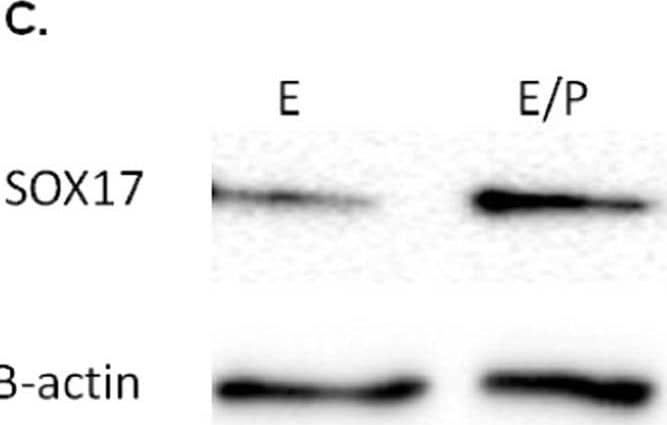
Localisation of Sox17 staining in proliferative and secretory phase endometrial tissue and regulation by hormones. Within the proliferative (A) and secretory (B) endometrium, Sox17 localized to the glandular (open arrowheads) and luminal (closed arrowheads) epithelium, with staining appearing in an irregular, patchy, pattern. Smaller inset boxes show relevant IgG negative controls. Imaged at 20x magnification, scale bar = 50 μm. Treatment of endometrial luminal epithelial (ECC-1) cells with 10−8 M estrogen (estradiol)/10−7 M progesterone (medroxyprogesterone acetate) (, *p < 0.05) resulted in an upregulation of Sox17 protein, when compared to untreated, estradiol only (■, E) treatment groups. (C,D) Data presented as mean ± SEM, n = 5. Representative Western immunoblot shown. Image collected and cropped by CiteAb from the following publication (https://pubmed.ncbi.nlm.nih.gov/31664088), licensed under a CC-BY license. Not internally tested by R&D Systems.
Detection of Human Normal Goat IgG Control by Western Blot
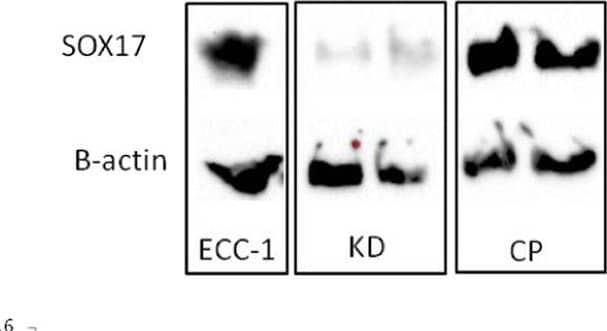
Knockdown of SOX17 results in reduced expression in endometrial luminal epithelial cells. Transfection of ECC-1 cells with a CRISPR/Cas9 SOX17 knock down plasmid resulted in decreased SOX17 expression (KD1-5) when compared to untransfected control ECC-1 cells (ECC-1) and ECC-1 cells transfected with a control plasmid (CP). Analysed by Western immunoblot, representative blot shown. Image collected and cropped by CiteAb from the following publication (https://pubmed.ncbi.nlm.nih.gov/31664088), licensed under a CC-BY license. Not internally tested by R&D Systems.
Detection of Human Normal Goat IgG Control by Immunohistochemistry
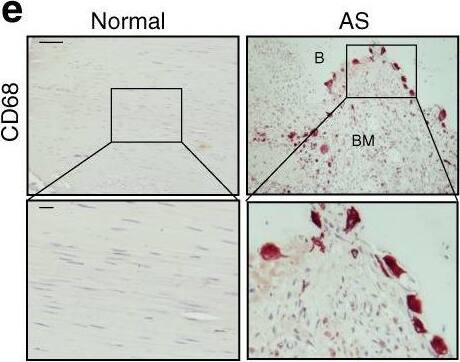
Osteoclast resorption of bony interspinous ligaments releases active TGF-beta to drive the progression of ossification in AS patients. e Immunostaining and f quantitative analysis of CD68-positive cells (brown) in the normal and HO-formed interspinous ligaments (sagittal view). The bottom panels show magnified views of the boxed area in the top panels. Scale bar: 100 μm (top panel); 25 μm (bottom panel). Image collected and cropped by CiteAb from the following publication (https://pubmed.ncbi.nlm.nih.gov/33731675), licensed under a CC-BY license. Not internally tested by R&D Systems.
Detection of Human Normal Goat IgG Control by Immunohistochemistry
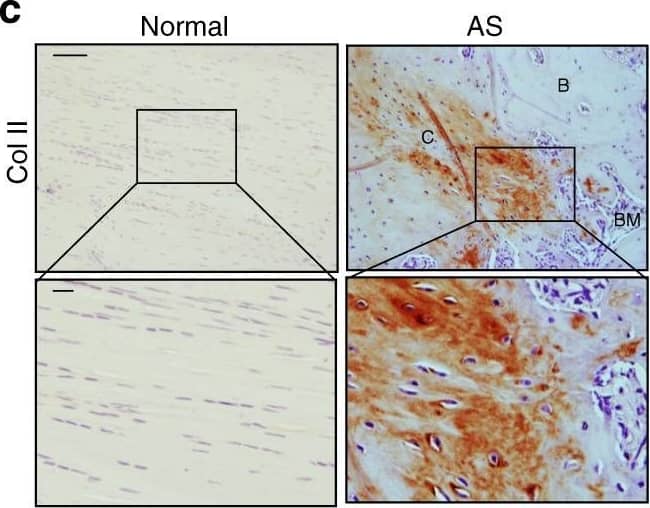
Progression of endochondral heterotopic ossification in AS patients. c Immunostaining and d quantitative analysis of collagen II-positive cells (brown) in the normal and chondrogenic interspinous ligaments (sagittal view). The bottom panels show magnified views of the boxed area in the top panels. Scale bar: 100 μm (top panels); 25 μm (bottom panels). Image collected and cropped by CiteAb from the following publication (https://pubmed.ncbi.nlm.nih.gov/33731675), licensed under a CC-BY license. Not internally tested by R&D Systems.
Detection of Human Normal Goat IgG Control by Immunohistochemistry
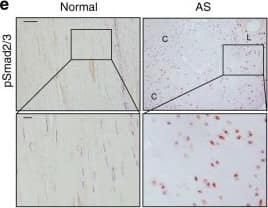
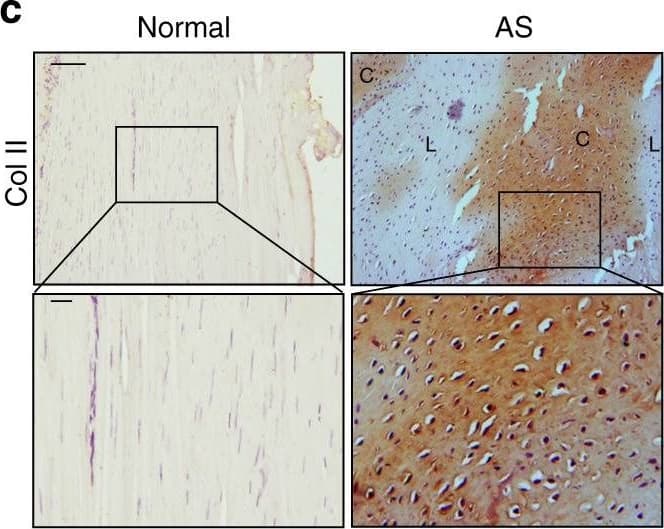
Chondrocyte differentiation and cartilage formation in interspinous ligaments of AS patients before calcification. a Hematoxylin and eosin (H&E) staining and b Safranin O–Fast Green (SOFG) staining of normal and chondrogenic interspinous ligaments. In the AS group, the right panels show magnified views of the boxed area in the left panels. Scale bar: 100 μm (two panels on the right side); 25 μm (left panel). c Immunostaining and d quantitative analysis of collagen II-positive cells (brown) in the normal and chondrogenic interspinous ligaments (sagittal view). The bottom panels show a magnified view of the boxed area in the top panels. Scale bar: 100 μm (top panel); 25 μm (bottom panel). e Immunostaining and f quantitative analysis of pSmad2/3-positive cells (brown) in the normal and chondrogenic interspinous ligaments (sagittal view). The bottom panels show magnified views of the boxed area in the top panels. Scale bar: 100 μm (top panel); 25 μm (bottom panel). g Immunostaining and h quantitative analysis of pSmad1/5/8-positive cells (brown) in the normal and inflammatory interspinous ligaments (sagittal view). The bottom panels show magnified views of the boxed area in the top panels. Scale bar: 100 μm (top panels); 25 μm (bottom panels). C, cartilage; L, ligament Image collected and cropped by CiteAb from the following publication (https://pubmed.ncbi.nlm.nih.gov/33731675), licensed under a CC-BY license. Not internally tested by R&D Systems.
Detection of Human Normal Goat IgG Control by Immunohistochemistry
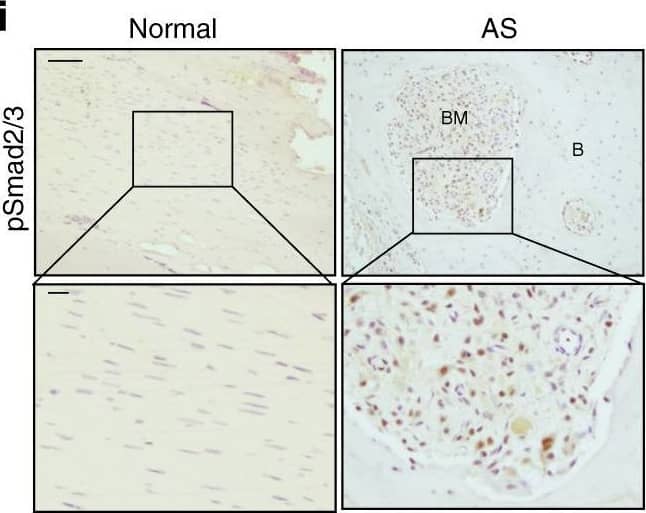
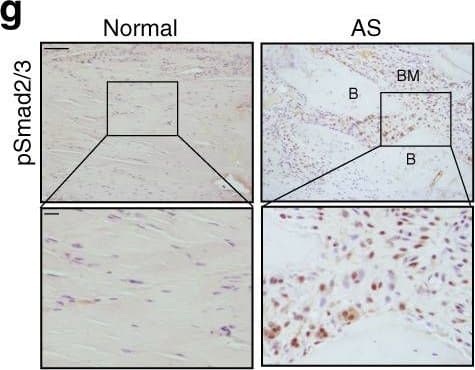
Progression of endochondral heterotopic ossification in AS patients. i Immunostaining and j quantitative analysis of pSmad2/3-positive cells (brown) in the normal ligaments and endochondral-ossified interspinous ligaments (sagittal view). The bottom panels show magnified views of the boxed area in the top panels. Scale bar: 100 μm (top panel); 25 μm (bottom panel). k Immunostaining and l quantitative analysis of Osterix-positive cells (brown) in the normal and endochondral-ossified interspinous ligaments (sagittal view). The bottom panels show magnified views of the boxed area in the top panels. Scale bar: 100 μm (top panel); 25 μm (bottom panel). m Immunostaining and n quantitative analysis of pSmad1/5/8-positive cells (brown) in the normal and inflammatory interspinous ligaments (sagittal view). The bottom panels show magnified views of the boxed area in the top panels. Scale bar: 100 μm (top panels); 25 μm (bottom panels). B, bone; BM, bone marrow; C, cartilage Image collected and cropped by CiteAb from the following publication (https://pubmed.ncbi.nlm.nih.gov/33731675), licensed under a CC-BY license. Not internally tested by R&D Systems.
Detection of Human Normal Goat IgG Control by Immunohistochemistry
Chondrocyte differentiation and cartilage formation in interspinous ligaments of AS patients before calcification. a Hematoxylin and eosin (H&E) staining and b Safranin O–Fast Green (SOFG) staining of normal and chondrogenic interspinous ligaments. In the AS group, the right panels show magnified views of the boxed area in the left panels. Scale bar: 100 μm (two panels on the right side); 25 μm (left panel). c Immunostaining and d quantitative analysis of collagen II-positive cells (brown) in the normal and chondrogenic interspinous ligaments (sagittal view). The bottom panels show a magnified view of the boxed area in the top panels. Scale bar: 100 μm (top panel); 25 μm (bottom panel). e Immunostaining and f quantitative analysis of pSmad2/3-positive cells (brown) in the normal and chondrogenic interspinous ligaments (sagittal view). The bottom panels show magnified views of the boxed area in the top panels. Scale bar: 100 μm (top panel); 25 μm (bottom panel). g Immunostaining and h quantitative analysis of pSmad1/5/8-positive cells (brown) in the normal and inflammatory interspinous ligaments (sagittal view). The bottom panels show magnified views of the boxed area in the top panels. Scale bar: 100 μm (top panels); 25 μm (bottom panels). C, cartilage; L, ligament Image collected and cropped by CiteAb from the following publication (https://pubmed.ncbi.nlm.nih.gov/33731675), licensed under a CC-BY license. Not internally tested by R&D Systems.
Detection of Human Normal Goat IgG Control by Immunohistochemistry
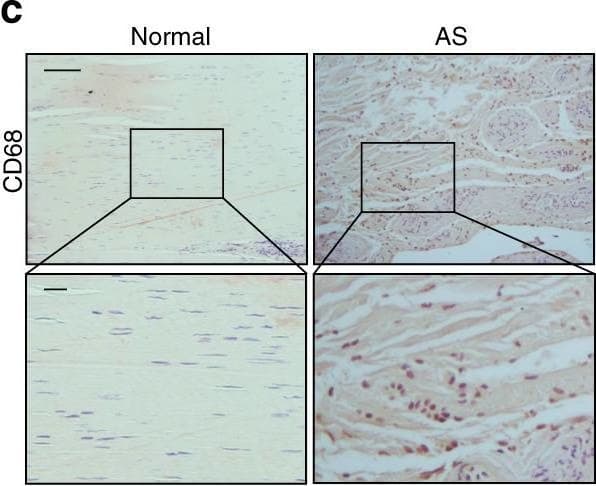
Elevated TGF-beta levels in the early inflammatory stage of AS. a Hematoxylin and eosin (H&E) staining and b Safranin O–Fast Green (SOFG) staining of normal and inflamed interspinous ligaments. In the AS group, the right panels show magnified views of the boxed area in the left panels. Scale bar: 100 μm (two panels on the right); 25 μm (left panel). c Immunostaining and d quantitative analysis of CD68-positive cells (brown) in the normal and inflamed interspinous ligaments (sagittal view). The bottom panels show magnified views of the boxed area in the top panels. Scale bar: 100 μm (top panels); 25 μm (bottom panels). e Immunostaining and f quantitative analysis of pSmad2/3-positive cells (brown) in the normal and inflamed interspinous ligaments (sagittal view) in normal ligaments and inflammatory ligaments. The bottom panels show magnified views of the boxed area in the top panels. Scale bar: 100 μm (top panels); 25 μm (bottom panels). g Immunostaining and h quantitative analysis of pSmad1/5/8-positive cells (brown) in the normal and inflamed interspinous ligaments (sagittal view). The bottom panels show magnified views of the boxed area in the top panels. Scale bar: 100 μm (top panels); 25 μm (bottom panels) Image collected and cropped by CiteAb from the following publication (https://pubmed.ncbi.nlm.nih.gov/33731675), licensed under a CC-BY license. Not internally tested by R&D Systems.
Detection of Human Normal Goat IgG Control by Immunohistochemistry
Osteoclast resorption of bony interspinous ligaments releases active TGF-beta to drive the progression of ossification in AS patients. g Immunostaining and h quantitative analysis of pSmad2/3-positive cells in the normal and HO-formed interspinous ligaments (sagittal view). The bottom panels show magnified views of the boxed area in the top panels. Scale bar: 100 μm (top panel); 25 μm (bottom panel). i Immunostaining and j quantitative analysis of Osterix-positive cells (brown) in the normal and HO-formed interspinous ligaments (sagittal view). The bottom panels show magnified views of the boxed area in the top panels. Scale bar: 100 μm (top panel); 25 μm (bottom panel).Image collected and cropped by CiteAb from the following publication (https://pubmed.ncbi.nlm.nih.gov/33731675), licensed under a CC-BY license. Not internally tested by R&D Systems.
Detection of Human Normal Goat IgG Control by Immunohistochemistry
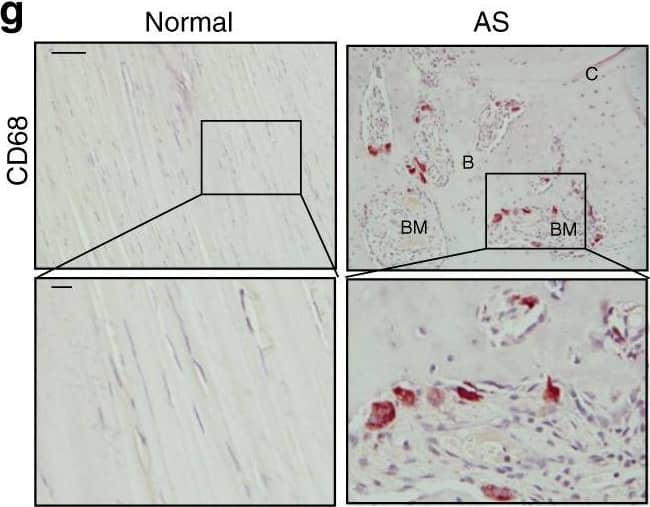
Progression of endochondral heterotopic ossification in AS patients.g Immunostaining and h quantitative analysis of the number of CD68-positive osteoclast (brown) surface (OCS) per bone surface (BS). The bottom panels show magnified views of the boxed area in the top panels. Scale bar: 100 μm (top panel); 25 μm (bottom panel). i Immunostaining and j quantitative analysis of pSmad2/3-positive cells (brown) in the normal ligaments and endochondral-ossified interspinous ligaments (sagittal view). The bottom panels show magnified views of the boxed area in the top panels. Scale bar: 100 μm (top panel); 25 μm (bottom panel). k Immunostaining and l quantitative analysis of Osterix-positive cells (brown) in the normal and endochondral-ossified interspinous ligaments (sagittal view). The bottom panels show magnified views of the boxed area in the top panels. Scale bar: 100 μm (top panel); 25 μm (bottom panel). m Immunostaining and n quantitative analysis of pSmad1/5/8-positive cells (brown) in the normal and inflammatory interspinous ligaments (sagittal view). The bottom panels show magnified views of the boxed area in the top panels. Scale bar: 100 μm (top panels); 25 μm (bottom panels). B, bone; BM, bone marrow; C, cartilage Image collected and cropped by CiteAb from the following publication (https://pubmed.ncbi.nlm.nih.gov/33731675), licensed under a CC-BY license. Not internally tested by R&D Systems.


