By Christina Towers, PhD
Autophagy is a recycling process that relies on the formation of a unique organelle termed an autophagosome. An elegant way to monitor autophagy is through various microscopy techniques to visualize and quantify the formation and turnover of these double membrane structures. Some techniques are more quantitative than others, each accompanied by advantages as well as caveats.
Identifying the autophagosome with Transmission Electron Microscopy (TEM)
This technique is the only tool that can reveal all of the dynamic stages of a forming autophagosome in the nanometer range and in its natural environment. However, identification of these structures can be extremely difficult and easy to misidentify. Initial autophagic vacuoles usually contain a double membrane structure and engulfed cellular organelles, i.e. mitochondria or endoplasmic reticulum. Late autophagic vacuoles or autolysosomes can be harder to identify as their contents are no longer distinct and the bilayers have begun to deteriorate. Unequivocal identification of each of these stages requires immune-EM detection with lysosome specific antibodies or gold-labeling for specific autophagic cargo proteins. Quantification of these structures can also be problematic, and it is nearly impossible to measure autophagic flux with this type of imaging due to the lack of time-lapse capabilities.
Quantifying LC3B puncta with fluorescence microscopy
ATG8/LC3B is the most commonly monitored protein to quantify autophagy in cells and tissues because the assays are relatively straight forward and fairly quantitative. LC3B with an N-terminus GFP tag (GFP-LC3) can be easily over-expressed in cultured cells as well as transgenic animals, although with more difficulty in primary cultures, and LC3 puncta can be visualized with fluorescent or confocal microscopy and quantified with automated imaging software. However, many artifacts have been identified with this exogenous system, particularly when high levels of LC3-GFP are expressed. For example, the tagged proteins can aggregate or artificially localize to the nucleus. Care must also be taken when quantifying LC3 puncta for these reasons and puncta per cell should be counted, with less regard for size of puncta. Endogenous LC3 as well as other autophagic substrates, i.e. p62, can also be imaged and quantified with the use of fluorescent secondary antibodies. Most importantly, a snapshot time point of LC3-GFP puncta cannot provide definitive information about autophagic flux without the use of lysosomal inhibitors.

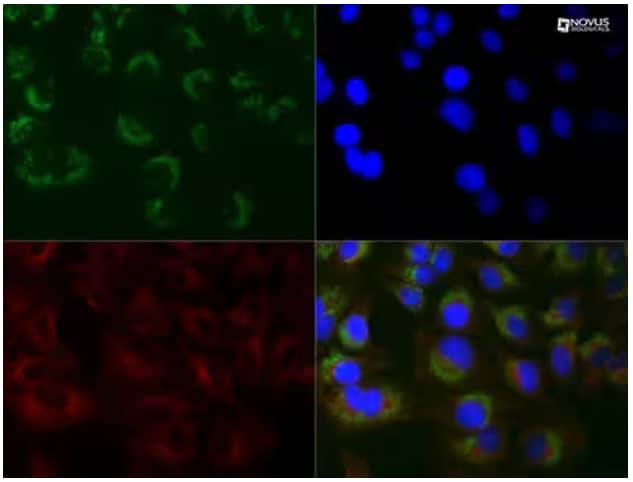
Immunocytochemistry/Immunofluorescence: LC3B Antibody (1251A) (Catalog # NBP2-46892) - HeLa cells were treated with 50 μM Chloroquine for 24 hours prior to fixation in 10% buffered formalin for 10 min. Cells were permeabilized in 0.1% Triton X-100 and incubated with 20 μg/mL anti-LC3B (1251A) and 1:500 alpha tubulin (DM1A) (Catalog # NB100-690) for 1 h at room temperature. LC3B reactivity (green) was detected with anti-rabbit Dylight 488 and alpha tubulin (red) with anti-mouse Dylight 550. Nuclei were counterstained with DAPI (blue).

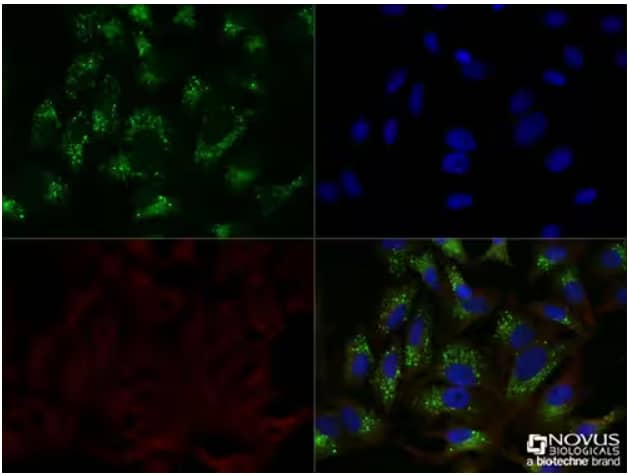
Immunocytochemistry/Immunofluorescence: p62/SQSTM1 Antibody (Catalog # NBP1-48320) - HeLa cells were treated overnight with 50 μM Chloroquine, then fixed for 10 minutes using 10% formalin and then permeabilized for 5 minutes using 1X TBS + 0.5% Triton X-100. The cells were incubated with anti-p62/SQSTM1 at a 1:200 dilution overnight at 4 °C and detected with an anti-rabbit Dylight 488 (Green) at a 1:500 dilution. Alpha tubulin(DM1A) (catalog #NB100-690) was used as a co-stain at a 1:1000 dilution and detected with an anti-mouse DyLight 550 (Red) at a 1:500 dilution. Nuclei were counterstained with DAPI (blue). Cells were imaged using a 40X objective.
Measuring autophagic flux with tandem fluorescent-tagged LC3B
To more quantitively measure autophagic flux, monomeric LC3B proteins fused to a pH stable mCherry or RFP and a pH sensitive GFP fluorophore can be used. Co-labeled puncta indicate initial autophagic vesicles whereas mCherry+/GFP- puncta indicate late autophagosomal structures like autophagolysosomes. Importantly, these structures can be quantified with automated imaging software in a large number of cells across multiple time points to gather a more dynamic picture of autophagy flux and a lysosomal inhibitor is not needed. Moreover, organelle-specific tandem tags have been generated to measure selective autophagy including mitophagy or pexophagy. However, all these assays are dependent on exogenous expression of tandem-tagged molecules which can be toxic in some cells. These experiments can also be technically restrictive as a high-powered spinning disk microscope is necessary to accurately measure the co-labeled puncta for quantification.

Christina Towers, PhD
University of Colorado (AMC)
Dr. Towers studies the roles of autophagy, apoptosis and cell death in cancer.
-
Klionsky, D. J. et al. (2016) Guidelines for the use and interpretation of assays for monitoring autophagy (3rd edition) Autophagy 12:1-222.