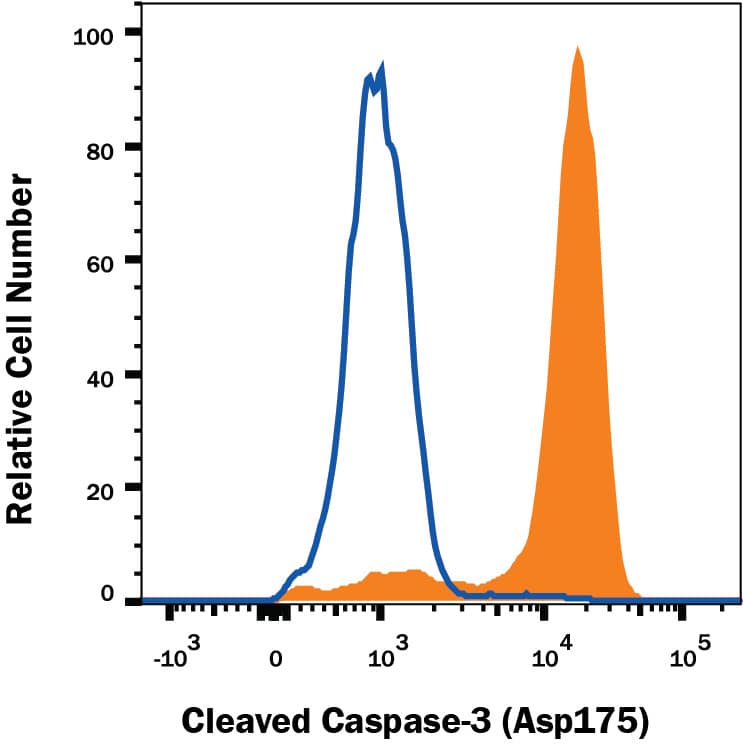
Detection of Cleaved Caspase‑3 in Jurkat Human Cell Line by Flow Cytometry.
Jurkat human acute T cell leukemia cell line untreated (open histogram) or treated with 3 µM Staurosporine for 3 hours (filled histogram) was stained with Rabbit Anti-Human/Mouse Caspase-3 Monoclonal Antibody (Catalog # MAB835, filled histogram) followed by anti-Rabbit IgG FITC-conjugated secondary antibody (Catalog #
F0112). To facilitate intracellular staining, cells were fixed with Flow Cytometry Fixation Buffer (Catalog #
FC004) and permeabilized with 90% methanol. View our protocol for Staining Intracellular Molecules.
Detection of Human Caspase-3 by Immunocytochemistry/Immunofluorescence
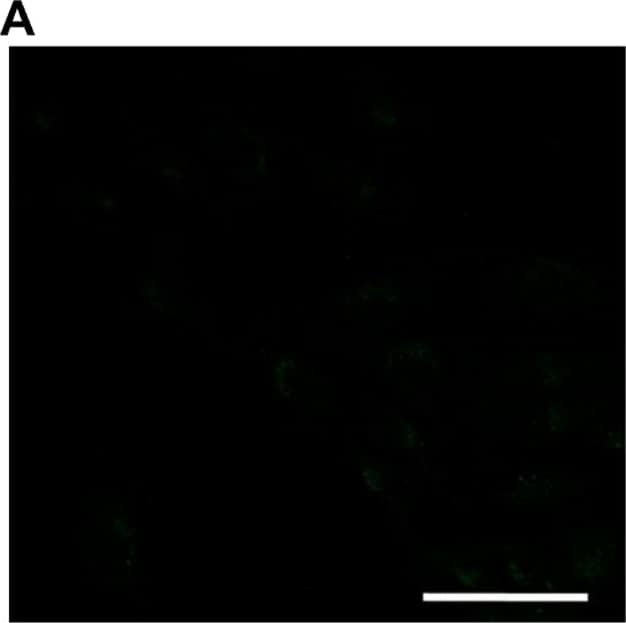
Caspase-3 activation and actin cytoskeletal organization in melanoma A375 cells cultured in the presence of PFII.Cells were grown on glass coverslips in the presence of 65, 130, 260 µM or 1 µM staurosporine (STS). (A–E) Active caspase-3 was visualized with anti-active caspase-3 antibody followed by a FITC-conjugated secondary antibody (green). (F–J) Actin was visualized using laser scanning confocal microscope (LSCM) after staining with Alexa Fluor 568 - conjugated phalloidin (red). Scale bar - 50 µm. Image collected and cropped by CiteAb from the following publication (https://dx.plos.org/10.1371/journal.pone.0057991), licensed under a CC-BY license. Not internally tested by R&D Systems.
Detection of Mouse Caspase-3 by Western Blot
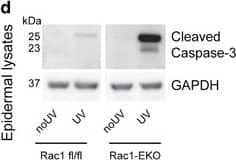
Epidermis-specific deletion of Rac1 increases UV-light-induced keratinocyte apoptosis in vivo. (a) H/E staining of UV-irradiated skin of Rac1 fl/fl and Rac1-EKO mice at 12 h after UV-irradiation. Black arrows indicate sunburn cells. (b) Graph shows the percentage number of sunburn cells at 12 h with (red bars) or without (blue bars) UV-irradiation in Rac1 fl/fl (n=4) and Rac1-EKO (n=5) mice. The percentage of sunburn cells within the epidermis after UV-irradiation in Rac1 fl/fl mice was 3.4%, whereas in Rac1-EKO mice it was 8.6% of total epidermal keratinocytes. Non-irradiated samples showed <1% sunburn cells in both the genotypes. (c) Immunostainings against cleaved caspase-3 (green) of UV-irradiated skin of Rac1 fl/fl and Rac1-EKO mice at 12 h after UV-irradiation. Nuclei are stained in blue. Scale bar=100 μm. (d) Western blot analysis of cleaved caspase-3 from epidermal lysates of untreated (no UV) and UV-light treated (UV) Rac1 fl/fl and Rac1-EKO mice. Non-irradiated controls showed no bands for cleaved capsase-3, whereas samples of irradiated epidermis showed cleaved caspase-3-specific bands at ~25 kDa and 23 kDa. Numbers on the left denote molecular weights in kDa. (e) Graph shows densitometry analysis of western blot in (d). Error bars show S.D. Asterisks show P-value<0.001 Image collected and cropped by CiteAb from the following publication (https://pubmed.ncbi.nlm.nih.gov/28277539), licensed under a CC-BY license. Not internally tested by R&D Systems.
Detection of Human Caspase-3 by Immunocytochemistry/Immunofluorescence
Apoptotic markers in PFII treated NHDFs.(A–C) [Ca2+]i fluorescence visualizations in cells as revealed by using an LSCM with fluorescent probe Fluo3/AM, scale bar - 100 µm. (D–F) Externalized phosphatidylserine by annexin V-fluorescein binding after PFII treatment, scale bar - 100 µm. Third (G–I) and fourth (J–L) panels show actin cytoskeletal organization and caspase-3 activation. Scale bar - 50 µm. Image collected and cropped by CiteAb from the following publication (https://dx.plos.org/10.1371/journal.pone.0057991), licensed under a CC-BY license. Not internally tested by R&D Systems.
Detection of Mouse Caspase-3 by Western Blot
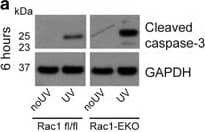
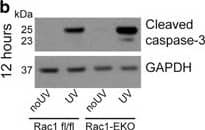
Rac1 deficiency increases sensitivity towards UV-light-induced keratinocyte apoptosis in vitro. (a and b) Western blot analysis of cleaved caspase-3 from Rac1 fl/fl and Rac1-EKO cultured keratinocytes at 6 h (a) and at 12 h (b) with (UV) or without (no UV) UV-irradiation. (c) Densitometry analysis of cleaved caspase-3 at 6 h after UV-irradiation from Rac1 fl/fl and Rac1-EKO keratinocytes. (d) Quantification of CPDs by CPD ELISA carried out from genomic DNA isolated from Rac1 fl/fl and Rac1-EKO mouse primary keratinocytes immediately after UV-irradiation. Error bars show S.D. Asterisks show P-value<0.01 Image collected and cropped by CiteAb from the following publication (https://pubmed.ncbi.nlm.nih.gov/28277539), licensed under a CC-BY license. Not internally tested by R&D Systems.
Detection of Mouse Caspase-3 by Western Blot
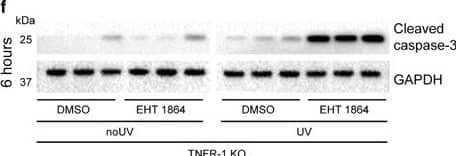
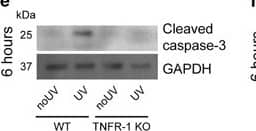
Increase in UV-light-induced apoptosis in Rac1-deficient keratinocytes requires activation of caspase-8. (a) Western blot analysis of cleaved caspase-8 from Rac1 fl/fl and Rac1-EKO cultured keratinocytes at 6 h with (UV) or without (no UV) UV-irradiation. (b) Densitometry analysis of fold change of cleaved caspase-8 in (a) normalized to GAPDH in Rac1 fl/fl and Rac1-EKO samples after UV-irradiation. (c) Western blot analysis of cleaved caspase-8 from CPDPL/Rac1-EKO epidermal lysates from mice kept in the dark or under the photoreactivtion lamp (PR). (d) Densitometric analysis of cleaved caspase-8 western blots in c. Error bars show S.D. (e) Western blot analysis of cleaved caspase-3 from wild-type (WT) and TNF receptor-1-deficient (TNFR-1 KO) cultured keratinocytes at 6 h with (UV) or without (no UV) UV-irradiation. (f) Western blot analysis of cleaved caspase-3 from TNFR-1 KO cultured keratinocytes incubated with DMSO or Rac1 inhibitor (EHT 1864) at 6 h with (UV) or without (no UV) UV-irradiation. GAPDH is used as a loading control. Numbers on the left denote molecular weights in kDa. * and *** represent P-value<0.05 and <0.001, respectively Image collected and cropped by CiteAb from the following publication (https://pubmed.ncbi.nlm.nih.gov/28277539), licensed under a CC-BY license. Not internally tested by R&D Systems.
Detection of Rat Caspase-3 by Western Blot
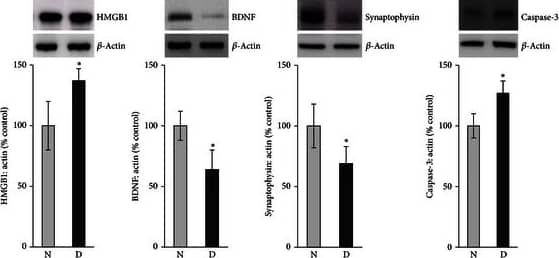
Western blot analysis of high-mobility group box-1 (HMGB1), brain-derived neurotrophic factor (BDNF), synaptophysin, and cleaved caspase-3 in rat retinas. There is a significant increase in the expression of HMGB1 and cleaved caspase-3 and a significant decrease in the expression of BDNF and synaptophysin in the retinas of diabetic rats (D) compared with the nondiabetic control rats (N). Each experiment was repeated 2 to 3 times with fresh samples (n = 6). Image collected and cropped by CiteAb from the following publication (https://pubmed.ncbi.nlm.nih.gov/23766563), licensed under a CC-BY license. Not internally tested by R&D Systems.
Detection of Human Caspase-3 by Immunocytochemistry/Immunofluorescence
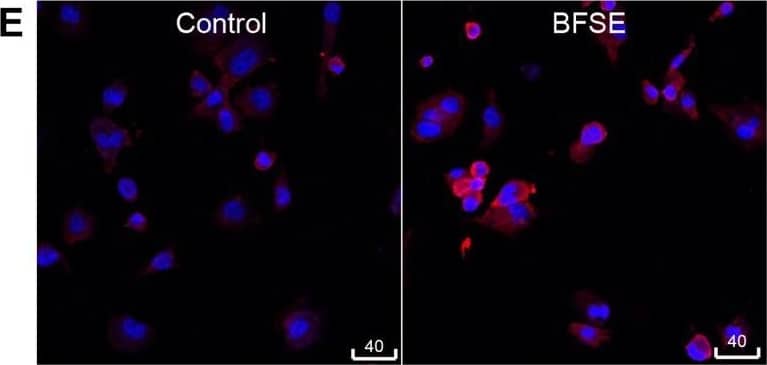
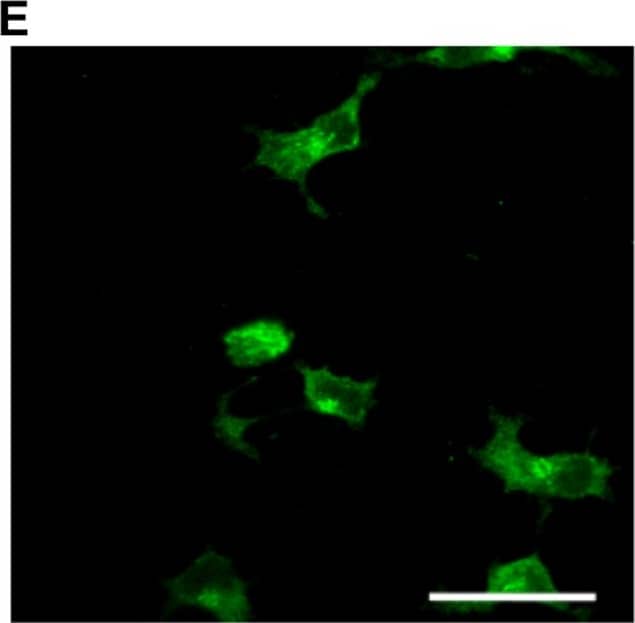
BFSE decreases macrophage viability. THP-1 macrophage, or MDM cells, were exposure to air control or 1%, 2.5%, 5%, 10% BFSE or 10% CSE for 24 h. LDH from THP-1 macrophage or MDM cells was measured in supernatants after 24 h (n = 4) (A). THP-1 macrophage expression of Bcl-2 and PARP was assessed by western blot (B), band densitometry analysis of Bcl-2 (C) and PARP (D) was performed, data is a representation of three independent experiments, and was baselined to the air treated control sample, and normalized to beta-actin expression. Error bars represent 95% confidence intervals. Representative confocal images of active caspase-3 (E) and PAR (F), in THP-1 macrophage with quantitative MFI measurement of active caspase-3 (G) and PAR (H). (n = 4) *p < 0.05, **p < 0.01. Image collected and cropped by CiteAb from the following publication (https://pubmed.ncbi.nlm.nih.gov/30194323), licensed under a CC-BY license. Not internally tested by R&D Systems.
Detection of Human Caspase-3 by Western Blot
Rac1 deficiency increases sensitivity towards UV-light-induced keratinocyte apoptosis in vitro. (a and b) Western blot analysis of cleaved caspase-3 from Rac1 fl/fl and Rac1-EKO cultured keratinocytes at 6 h (a) and at 12 h (b) with (UV) or without (no UV) UV-irradiation. (c) Densitometry analysis of cleaved caspase-3 at 6 h after UV-irradiation from Rac1 fl/fl and Rac1-EKO keratinocytes. (d) Quantification of CPDs by CPD ELISA carried out from genomic DNA isolated from Rac1 fl/fl and Rac1-EKO mouse primary keratinocytes immediately after UV-irradiation. Error bars show S.D. Asterisks show P-value<0.01 Image collected and cropped by CiteAb from the following publication (https://pubmed.ncbi.nlm.nih.gov/28277539), licensed under a CC-BY license. Not internally tested by R&D Systems.
Detection of Human Caspase-3 by Immunocytochemistry/Immunofluorescence
Caspase-3 activation and actin cytoskeletal organization in melanoma A375 cells cultured in the presence of PFII.Cells were grown on glass coverslips in the presence of 65, 130, 260 µM or 1 µM staurosporine (STS). (A–E) Active caspase-3 was visualized with anti-active caspase-3 antibody followed by a FITC-conjugated secondary antibody (green). (F–J) Actin was visualized using laser scanning confocal microscope (LSCM) after staining with Alexa Fluor 568 - conjugated phalloidin (red). Scale bar - 50 µm. Image collected and cropped by CiteAb from the following publication (https://dx.plos.org/10.1371/journal.pone.0057991), licensed under a CC-BY license. Not internally tested by R&D Systems.
Detection of Rat Caspase-3 by Western Blot
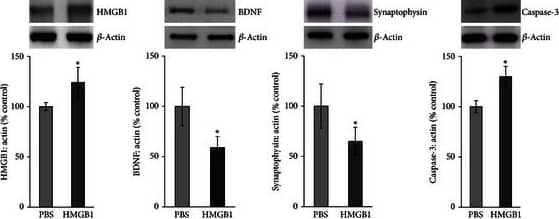
Western blot analysis of rat retinas. Intravitreal administration of high-mobility group box-1 (HMGB1) induced a significant upregulation of the expression of HMGB1 and cleaved caspase-3 and a significant downregulation of the expression of brain-derived neurotrophic factor (BDNF) and synaptophysin compared with intravitreal administration of phosphate buffer saline (PBS). Each experiment was repeated 2 to 3 times with fresh samples (n = 6). Image collected and cropped by CiteAb from the following publication (https://pubmed.ncbi.nlm.nih.gov/23766563), licensed under a CC-BY license. Not internally tested by R&D Systems.
Detection of Human Caspase-3 by Immunocytochemistry/Immunofluorescence
Apoptotic markers in PFII treated NHDFs.(A–C) [Ca2+]i fluorescence visualizations in cells as revealed by using an LSCM with fluorescent probe Fluo3/AM, scale bar - 100 µm. (D–F) Externalized phosphatidylserine by annexin V-fluorescein binding after PFII treatment, scale bar - 100 µm. Third (G–I) and fourth (J–L) panels show actin cytoskeletal organization and caspase-3 activation. Scale bar - 50 µm. Image collected and cropped by CiteAb from the following publication (https://dx.plos.org/10.1371/journal.pone.0057991), licensed under a CC-BY license. Not internally tested by R&D Systems.
Detection of Human Caspase-3 by Immunocytochemistry/Immunofluorescence
Caspase-3 activation and actin cytoskeletal organization in melanoma A375 cells cultured in the presence of PFII.Cells were grown on glass coverslips in the presence of 65, 130, 260 µM or 1 µM staurosporine (STS). (A–E) Active caspase-3 was visualized with anti-active caspase-3 antibody followed by a FITC-conjugated secondary antibody (green). (F–J) Actin was visualized using laser scanning confocal microscope (LSCM) after staining with Alexa Fluor 568 - conjugated phalloidin (red). Scale bar - 50 µm. Image collected and cropped by CiteAb from the following publication (https://dx.plos.org/10.1371/journal.pone.0057991), licensed under a CC-BY license. Not internally tested by R&D Systems.
Detection of Mouse Caspase-3 by Western Blot
Increase in UV-light-induced apoptosis in Rac1-deficient keratinocytes requires activation of caspase-8. (a) Western blot analysis of cleaved caspase-8 from Rac1 fl/fl and Rac1-EKO cultured keratinocytes at 6 h with (UV) or without (no UV) UV-irradiation. (b) Densitometry analysis of fold change of cleaved caspase-8 in (a) normalized to GAPDH in Rac1 fl/fl and Rac1-EKO samples after UV-irradiation. (c) Western blot analysis of cleaved caspase-8 from CPDPL/Rac1-EKO epidermal lysates from mice kept in the dark or under the photoreactivtion lamp (PR). (d) Densitometric analysis of cleaved caspase-8 western blots in c. Error bars show S.D. (e) Western blot analysis of cleaved caspase-3 from wild-type (WT) and TNF receptor-1-deficient (TNFR-1 KO) cultured keratinocytes at 6 h with (UV) or without (no UV) UV-irradiation. (f) Western blot analysis of cleaved caspase-3 from TNFR-1 KO cultured keratinocytes incubated with DMSO or Rac1 inhibitor (EHT 1864) at 6 h with (UV) or without (no UV) UV-irradiation. GAPDH is used as a loading control. Numbers on the left denote molecular weights in kDa. * and *** represent P-value<0.05 and <0.001, respectively Image collected and cropped by CiteAb from the following publication (https://pubmed.ncbi.nlm.nih.gov/28277539), licensed under a CC-BY license. Not internally tested by R&D Systems.
Detection of Mouse Human/Mouse Cleaved Caspase-3 (Asp175) Antibody by Western Blot
Gamma herpesvirus 68 ( gammaHV68) replicates in alveolar epithelial cells (AECs). (A) Wild-type mice were infected with 5 × 10⁴ PFU gammaHV68 on day 0. On day 7 after infection, frozen sections were prepared, and stained with a rabbit polyclonal antisera against gammaHV68, or with non-immune rabbit sera as control. The goat anti-rabbit secondary was linked to alkaline phosphatase. Vivid replication of gammaHV68 is visible in alveolar lining cells (original magnification × 100). Sections shown are representative of four mice examined. (B) AECs were isolated from lungs of Balb/c or TLR-9-/- mice treated with bleomycin plus gammaHV68 on day 21, and were cultured on fibronectin-coated slides (TiterTek). Sections were stained with antibodies (M30 Cytodeath), and the number of positive cells per high power field (HPF; ×400) were calculated (n = 30 HPF per genotype). (C) AECs were isolated from Balb/c or TLR-9-/- mice and cells were infected in vitro with 0.01 or 0.001 PFU gammaHV68 for 48 hours. Cell lysates were then analyzed for cleaved caspase 3 by western blotting. Data are from one experiment, representative of two. Image collected and cropped by CiteAb from the following publication (https://pubmed.ncbi.nlm.nih.gov/21810214), licensed under a CC-BY license. Not internally tested by R&D Systems.
Detection of Human Human/Mouse Cleaved Caspase-3 (Asp175) Antibody by Immunohistochemistry
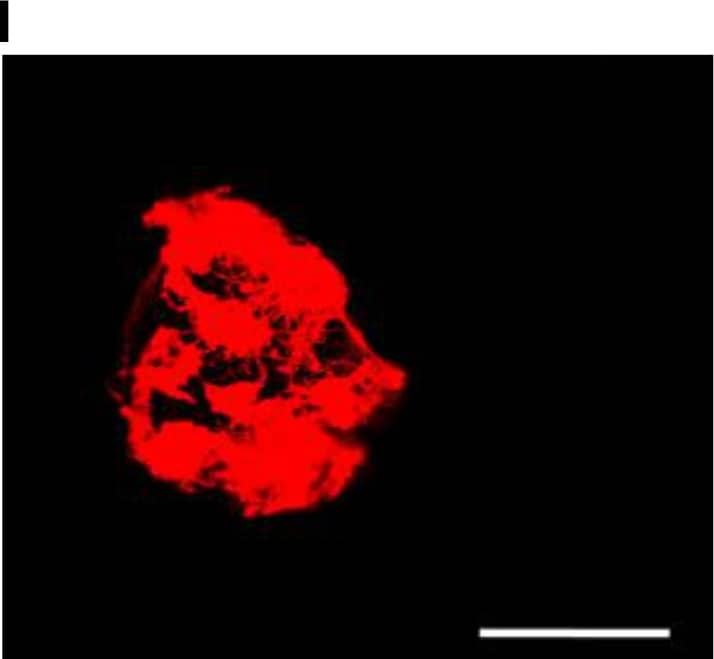
Assessment of the skin structure and apoptosis upon treatment with wound gels. Representative images and zoom-ins of the boxed areas of haematoxylin and eosin (H&E)-stained tape-stripped (TS) sections from biopsies (age 38 years) either left untreated or treated with indicated wound gels using a light microscope. The presence of caspase-3 expressing cells was evaluated using a caspase-3 (CASP3) antibody and visualisation with a secondary Alexa Fluor™ 546 AB (red). Nuclei were counterstained with DAPI (blue). Scale bar = 50 μm. Image collected and cropped by CiteAb from the following publication (https://pubmed.ncbi.nlm.nih.gov/36261541), licensed under a CC-BY license. Not internally tested by R&D Systems.

