ACE‑2 in Human Kidney.
ACE-2 was detected in immersion fixed paraffin-embedded sections of human kidney using Goat Anti-Human/Mouse/Rat/Hamster ACE-2 Antigen Affinity-purified Polyclonal Antibody (Catalog # AF933) at 15 µg/mL overnight at 4 °C. Tissue was stained using the Anti-Goat HRP-DAB Cell & Tissue Staining Kit (brown; Catalog #
CTS008) and counterstained with hematoxylin (blue). Lower panel shows a lack of labeling if primary antibodies are omitted and tissue is stained only with secondary antibody followed by incubation with detection reagents. View our protocol for Chromogenic IHC Staining of Paraffin-embedded Tissue Sections.
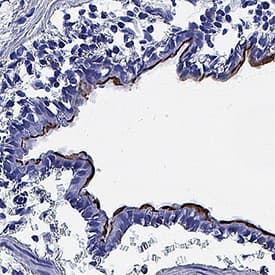
ACE-2 in Hamster Lung.
ACE-2 was detected in immersion fixed paraffin-embedded sections of hamster lung using Goat Anti-Human/Mouse/Rat/Hamster ACE-2 Antigen Affinity-purified Polyclonal Antibody (Catalog # AF933) at 3 µg/mL for 1 hour at room temperature followed by incubation with the Anti-Goat IgG VisUCyte™ HRP Polymer Antibody (
VC004). Before incubation with the primary antibody, tissue was subjected to heat-induced epitope retrieval using Antigen Retrieval Reagent-Basic (
CTS013). Tissue was stained using DAB (brown) and counterstained with hematoxylin (blue). Specific staining was localized to respiratory bronchioles. Staining was performed using our protocol for IHC Staining with VisUCyte HRP Polymer Detection Reagents.
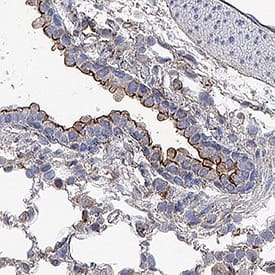
ACE-2 in Rat Lung.
ACE-2 was detected in immersion fixed frozen sections of rat lung using Goat Anti-Human/Mouse/Rat/Hamster ACE-2 Antigen Affinity-purified Polyclonal Antibody (Catalog # AF933) at 10 µg/mL for 1 hour at room temperature followed by incubation with the Anti-Goat IgG VisUCyte™ HRP Polymer Antibody (
VC004). Before incubation with the primary antibody, tissue was subjected to heat-induced epitope retrieval using Antigen Retrieval Reagent-Basic (
CTS013). Tissue was stained using DAB (brown) and counterstained with hematoxylin (blue). Specific staining was localized to cell surface in eputhelial cells in bronchioles. Staining was performed using our protocol for IHC Staining with VisUCyte HRP Polymer Detection Reagents.
ACE-2 in Rat Lung.
ACE-2 was detected in immersion fixed paraffin-embedded sections of rat lung using Goat Anti-Human/Mouse/Rat/Hamster ACE-2 Antigen Affinity-purified Polyclonal Antibody (Catalog # AF933) at 10 µg/mL for 1 hour at room temperature followed by incubation with the Anti-Goat IgG VisUCyte™ HRP Polymer Antibody (
VC004). Before incubation with the primary antibody, tissue was subjected to heat-induced epitope retrieval using Antigen Retrieval Reagent-Basic (
CTS013). Tissue was stained using DAB (brown) and counterstained with hematoxylin (blue). Staining was performed using our protocol for IHC Staining with VisUCyte HRP Polymer Detection Reagents.
ACE-2 in Rat Kidney.
ACE-2 was detected in immersion fixed paraffin-embedded sections of rat kidney using Goat Anti-Human/Mouse/Rat/Hamster ACE-2 Antigen Affinity-purified Polyclonal Antibody (Catalog # AF933) at 10 µg/mL for 1 hour at room temperature followed by incubation with the Anti-Goat IgG VisUCyte™ HRP Polymer Antibody (
VC004). Before incubation with the primary antibody, tissue was subjected to heat-induced epitope retrieval using Antigen Retrieval Reagent-Basic (
CTS013). Tissue was stained using DAB (brown) and counterstained with hematoxylin (blue). Specific staining was localized to cell surface in convoluted tubules. Staining was performed using our protocol for IHC Staining with VisUCyte HRP Polymer Detection Reagents.
Detection of Human ACE‑2 by Simple WesternTM.
Simple Western lane view shows lysates of human kidney tissue, loaded at 0.2 mg/mL. A specific band was detected for ACE-2 at approximately 155 kDa (as indicated) using 10 µg/mL of Goat Anti-Human/Mouse/Rat/Hamster ACE-2 Antigen Affinity-purified Polyclonal Antibody (Catalog # AF933) followed by 1:50 dilution of HRP-conjugated Anti-Goat IgG Secondary Antibody (Catalog #
HAF109). This experiment was conducted under reducing conditions and using the 12-230 kDa separation system.
Detection of Human ACE-2 by Western Blot
(A) Transduction of pLV pseudotyped with VSV-G (A,C) or CoV-2 Spike glycoprotein (B,D) in HEK293T (A,B) or Vero E6 (C,D) cells. The lentiviral backbone incorporates enhanced green fluorescent protein (eGFP) that is expressed upon integration into target cells. The fluorescence was recorded at 48 h post transduction. Magnification 4X. (E) Transduction efficiency of pLV pseudotyped with CoV-2 Spike glycoprotein in Vero E6, hACE2-HEK293T and 293T cells. The fluorescence was recorded at 48 h post transduction. The experiments were done in triplicates and standard error of mean was plotted as error bars. (F) Whole cell lysates from Vero E6, hACE2-293T and 293T cells were run on SDS-PAGE and probed with anti ACE2 antibody. Beta-actin was used as a loading control. Image collected and cropped by CiteAb from the following publication (https://pubmed.ncbi.nlm.nih.gov/33154514), licensed under a CC-BY license. Not internally tested by R&D Systems.
Detection of Mouse ACE-2 by Western Blot
Immunoblot analysis of ACE2 protein in the media from high glucose- or Ang II-stimulated mouse PT cells.(A) Mouse PT cells were incubated for 72 hrs in normal media (C, 7.8 mM D-glucose), with or without Ang II (10−7 M), high D-glucose (D-G, 25 mM), or high L-glucose (25 mM). Above graph is representative immunoblot for ACE2 in the media, showing bands at ∼90 kDa and ∼70 kDa. (B) Graphical representation of densitometry analysis of two ACE2 bands on immunoblots. For the ∼90 kDa band, *p<0.05 vs C, **p<0.001 vs C, **p<0.003 vs L-G; n = 5. For the ∼70 kDa band, *p<0.04 vs C; **p<0.001 vs C or L-G, **p<0.03 vs Ang II; n = 5. Image collected and cropped by CiteAb from the following publication (https://dx.plos.org/10.1371/journal.pone.0085958), licensed under a CC-BY license. Not internally tested by R&D Systems.
Detection of Mouse ACE-2 by Western Blot
Deglycosylation of ACE2 protein in media and cell lysates from mouse PT cells.Representative immunoblot for ACE2 treated without (−) or with (+) deglycosylation with PNGase F in the media (Lanes 1–2) and cell lysates (Lanes 3–4). Lanes 1 and 3: wildtype PT cells, Lanes 2 and 4: ACE2 knockout (KO) PT cells transfected with a human ACE2 vector, Lane 5: mouse kidney cortex. Lanes 1+ and 2+ show a reduction in the sizes of ACE2 fragments in media fractions to ∼75 kDa and ∼60 kDa for mouse ACE2, and to ∼80 kDa and ∼65 kDa for human ACE2, respectively. Lanes 3+ and 4+ show a reduction in the sizes of ACE2 in cell lysates to ∼85 kDa for both mouse and human ACE2 treated with the PNGase F, respectively. Lane 5+ shows a reduction in size of ACE2 in mouse cortex from ∼100 kDa to ∼85 kDa after treatment with PNGase F. Image collected and cropped by CiteAb from the following publication (https://dx.plos.org/10.1371/journal.pone.0085958), licensed under a CC-BY license. Not internally tested by R&D Systems.
Detection of Mouse ACE-2 by Western Blot
Immunoblot analysis of ACE2 protein in media and cell lysates from mouse PT cells.(A) Representative immunoblot for ACE2 protein in concentrated media (Lanes 1–3) and cell lysates (Lanes 4–6) from mouse PT cells. Lanes 1 and 4: wildtype cells, Lanes 2 and 5: ACE2 knockout (KO) cells, Lanes 3 and 6: ACE2 KO cells transfected with a human ACE2 expression vector, Lane 7: mouse kidney cortex showing a band at ∼100 kDa, used as a positive control. Lane 1 shows two bands in the media at ∼90 kDa and ∼70 kDa for mouse ACE2. Lane 3 shows two bands in the media for human ACE2 in transfected cells, at ∼110 kDa and ∼95 kDa. Lanes 4 and 6 show a single band in cell lysates at ∼100 kDa for mouse ACE2, and ∼120 kDa for human ACE2, respectively. Lanes 2 and 5 show no ACE2 bands detected on immunoblots of both media and cell lysates from untransfected ACE2 KO cells. (B) Increased ACE2 activity in the media from ACE2 KO cells transfected with a human ACE2 expression vector (HA-hACE2, 3.75 µg on 35 mm culture dishes). Untransfected cells and cells transfected with an empty pcDNA3 vector had no detectable ACE2 activity in the media. Numbers in parentheses represent mean values for ACE2 activity. *P<0.001 vs untransfected control or empty pcDNA3 vector, n = 4. Image collected and cropped by CiteAb from the following publication (https://dx.plos.org/10.1371/journal.pone.0085958), licensed under a CC-BY license. Not internally tested by R&D Systems.
Simple Western: ACE-2 Antibody [Unconjugated] [AF933] -
Simple Western: ACE-2 Antibody [Unconjugated] [AF933] - Design for a membrane-localized ACE2 expression system. (A) Our ACE2 construct is driven by a CMV promoter followed by the first 25 residues of ACE2 containing the leader sequence that direct ACE2 to the plasma membrane. This is followed by a 3xHA tag linked to the remainder of ACE2 (20-805) and a C-terminal sfGFP. Both 3xHA and sfGFP fusions are separated from ACE2 by flexible 3xGGGGS linkers. (B) The ACE2 fusion protein is designed to be embedded in the plasma membrane where it can perform extracellular carboxypeptidase-mediated metabolism and its levels can be detected by cell staining with antibodies to HA. (C) Lysates from untransfected or 3xHA-ACE2-sfGFP-transfected HEK293 cells were analyzed by automated Jess capillary immunoassay using antibodies to HA, GFP, and two ACE2 antibodies. (D) Confocal fluorescence microscopy of HEK cells transfected with 3xHA-ACE2-sfGFP and stained with HA and the nuclear stain DAPI. Image collected and cropped by CiteAb from the following publication (https://pubmed.ncbi.nlm.nih.gov/37644110), licensed under a CC-BY license. Not internally tested by R&D Systems.
Detection of Mouse ACE-2 by Immunohistochemistry
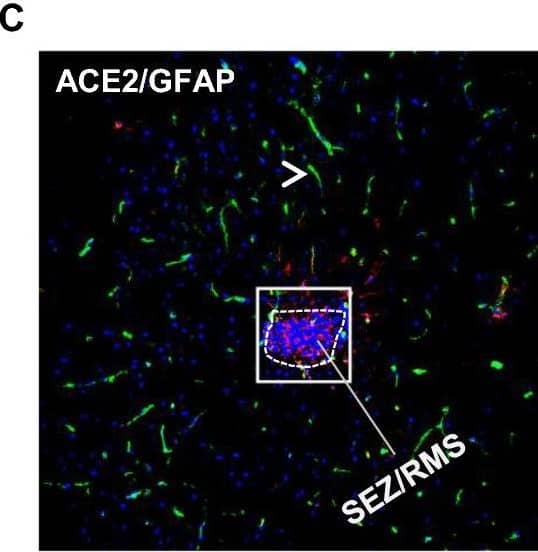
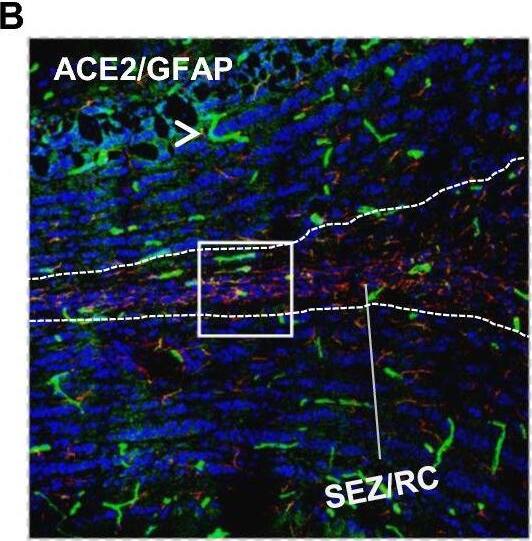
Distribution of ACE2 along the olfactory retrograde route. A Schematic elucidation of a gross view of mouse olfactory retrograde route comprised by OB surface, SEZ/RC, SEZ in the rostral migratory stream (SEZ/RMS) and SVZ of the LV (top panel) and a microscopic view of SEZ/RC and SEZ/RMS (bottom panel). B–E Co-staining of ACE2 (green) with astrocyte marker GFAP (red) in SEZ/RC and SEZ/RMS. B-C show the low magnitude images. D–E show the enlarged images of the indicated regions in B and C, respectively. DAPI (blue) was used for nuclear staining. Arrow: indicates astrocyte. Dash arrow: indicates neuroblast. Arrowhead: indicates microvessel. The dash lines in all images outline the border of SEZ/RC and SEZ/RMS, respectively. Image magnitude B-C: 20X, D-E: 100X Image collected and cropped by CiteAb from the following open publication (https://pubmed.ncbi.nlm.nih.gov/35672716), licensed under a CC-BY license. Not internally tested by R&D Systems.
Detection of Mouse ACE-2 by Immunohistochemistry
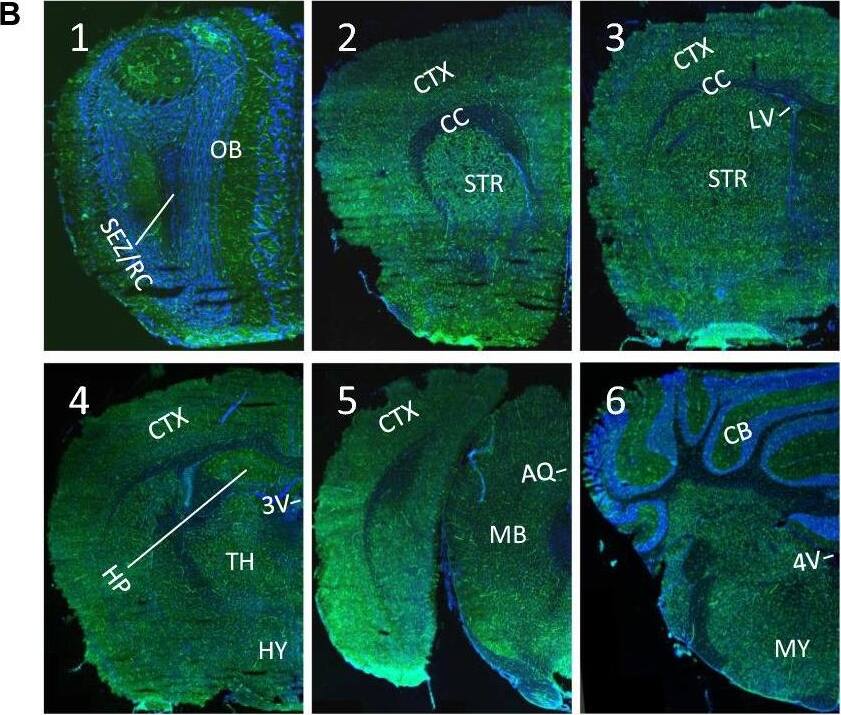
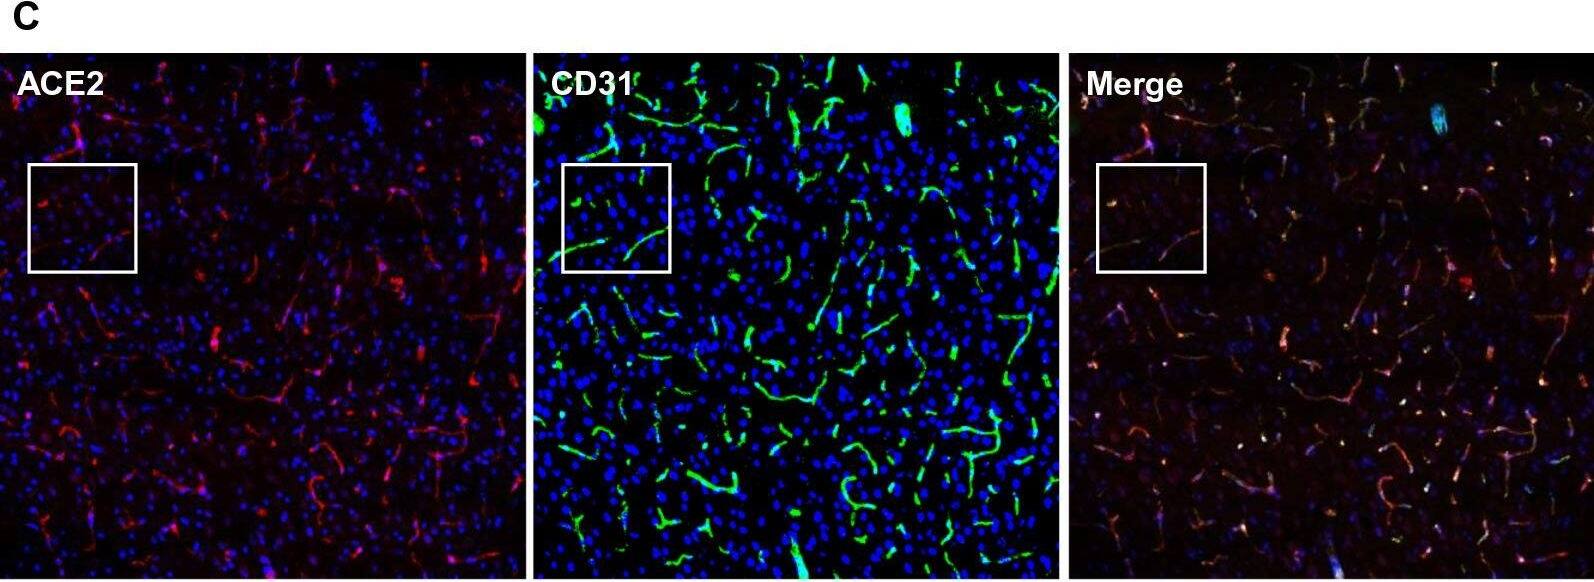
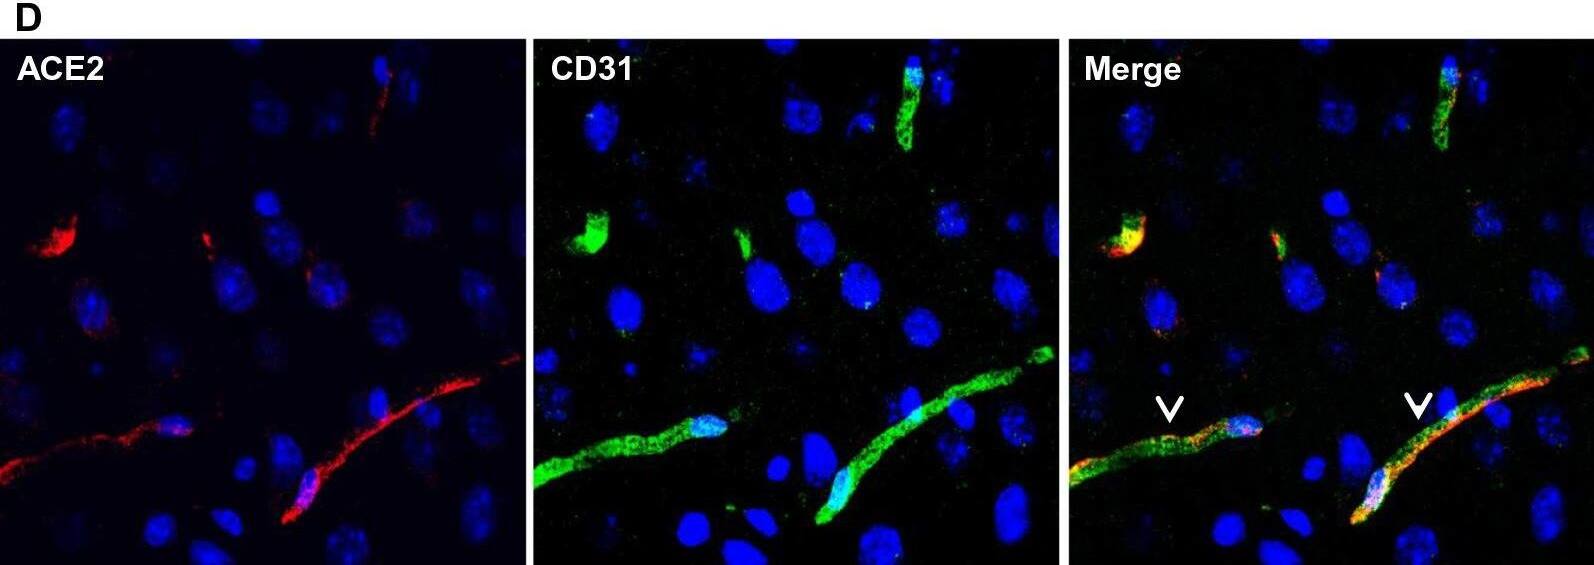
Ubiquitous expression of ACE2 in cerebral microvascular pericytes. A Schematic elucidation of sectioning plates and main brain regions of a mouse brain. OB: olfactory bulb, SEZ/RC: subependymal zone (SEZ) in the rhinocele, CTX: cerebral cortex, CC: corpus callosum, STR: striatum, LV: lateral ventricle, HP: hippocampus, TH: thalamus, 3 V: third ventricle, HY: hypothalamus, AQ: cerebral aqueduct, MB: midbrain, CB: cerebellum, 4 V: fourth ventricle, MY: medulla oblongata. B Scanning images show ACE2 (green) distribution in the hemisphere sections. C–F ACE2 (red) ubiquitously distributes in the cerebral microvessels labeled by endothelial cell marker CD31 (green) and pericyte marker PDGFR beta (green), respectively. ACE2 overlapped with pericyte marker PDGFR beta (F) but not endothelial cell marker CD31 (D). C and E showed the low magnitude images. D and F showed the enlarged images of the indicated regions in C and E, respectively. G ACE2 (red) does not distribute in large blood vessels marked by CD31 (green) but is detectable in the meninges wrapping HY. DAPI (blue) was used for nuclear staining. *: indicates large blood vessels. #: indicates meninges. Arrowhead: indicates microvessel. Image magnitude B: 10X; C, E and G: 20X; D and F: 100X Image collected and cropped by CiteAb from the following open publication (https://pubmed.ncbi.nlm.nih.gov/35672716), licensed under a CC-BY license. Not internally tested by R&D Systems.
Detection of Mouse ACE-2 by Immunohistochemistry
Differential distribution of ACE2 in brain parenchyma. A Uneven distribution of ACE2 (green) in indicated brain regions. Each insert shows a comparable high magnitude image of the corresponding region. B Enlarged images of the indicated region in the MY panel in A with co-staining of ACE2 (green) and astrocyte marker GFAP (red). C Co-staining of ACE2 (red) and neuron marker NeuN (green) in the MY. Cii-Civ show the high magnitude image of the comparable regions of Ci. D Quantitation of the relative expression of ACE2 in astrocytes and neurons. Values are presented as mean ± SEM. n = 60. ***: p < 0.001. DAPI (blue) was used for nuclear staining. Arrowhead: indicates microvessel. Arrow: indicates astrocyte. Dash arrow: indicates neuron. #indicates meninges wrapping MY. Image magnitude A and Ci: 20X, B and Cii-iv: 100X Image collected and cropped by CiteAb from the following open publication (https://pubmed.ncbi.nlm.nih.gov/35672716), licensed under a CC-BY license. Not internally tested by R&D Systems.
Detection of Mouse ACE-2 by Immunohistochemistry
Ubiquitous expression of ACE2 in cerebral microvascular pericytes. A Schematic elucidation of sectioning plates and main brain regions of a mouse brain. OB: olfactory bulb, SEZ/RC: subependymal zone (SEZ) in the rhinocele, CTX: cerebral cortex, CC: corpus callosum, STR: striatum, LV: lateral ventricle, HP: hippocampus, TH: thalamus, 3 V: third ventricle, HY: hypothalamus, AQ: cerebral aqueduct, MB: midbrain, CB: cerebellum, 4 V: fourth ventricle, MY: medulla oblongata. B Scanning images show ACE2 (green) distribution in the hemisphere sections. C–F ACE2 (red) ubiquitously distributes in the cerebral microvessels labeled by endothelial cell marker CD31 (green) and pericyte marker PDGFR beta (green), respectively. ACE2 overlapped with pericyte marker PDGFR beta (F) but not endothelial cell marker CD31 (D). C and E showed the low magnitude images. D and F showed the enlarged images of the indicated regions in C and E, respectively. G ACE2 (red) does not distribute in large blood vessels marked by CD31 (green) but is detectable in the meninges wrapping HY. DAPI (blue) was used for nuclear staining. *: indicates large blood vessels. #: indicates meninges. Arrowhead: indicates microvessel. Image magnitude B: 10X; C, E and G: 20X; D and F: 100X Image collected and cropped by CiteAb from the following open publication (https://pubmed.ncbi.nlm.nih.gov/35672716), licensed under a CC-BY license. Not internally tested by R&D Systems.
Detection of Mouse ACE-2 by Immunohistochemistry
Distribution of ACE2 along the olfactory retrograde route. A Schematic elucidation of a gross view of mouse olfactory retrograde route comprised by OB surface, SEZ/RC, SEZ in the rostral migratory stream (SEZ/RMS) and SVZ of the LV (top panel) and a microscopic view of SEZ/RC and SEZ/RMS (bottom panel). B–E Co-staining of ACE2 (green) with astrocyte marker GFAP (red) in SEZ/RC and SEZ/RMS. B-C show the low magnitude images. D–E show the enlarged images of the indicated regions in B and C, respectively. DAPI (blue) was used for nuclear staining. Arrow: indicates astrocyte. Dash arrow: indicates neuroblast. Arrowhead: indicates microvessel. The dash lines in all images outline the border of SEZ/RC and SEZ/RMS, respectively. Image magnitude B-C: 20X, D-E: 100X Image collected and cropped by CiteAb from the following open publication (https://pubmed.ncbi.nlm.nih.gov/35672716), licensed under a CC-BY license. Not internally tested by R&D Systems.
Detection of Mouse ACE-2 by Immunohistochemistry
Ubiquitous expression of ACE2 in cerebral microvascular pericytes. A Schematic elucidation of sectioning plates and main brain regions of a mouse brain. OB: olfactory bulb, SEZ/RC: subependymal zone (SEZ) in the rhinocele, CTX: cerebral cortex, CC: corpus callosum, STR: striatum, LV: lateral ventricle, HP: hippocampus, TH: thalamus, 3 V: third ventricle, HY: hypothalamus, AQ: cerebral aqueduct, MB: midbrain, CB: cerebellum, 4 V: fourth ventricle, MY: medulla oblongata. B Scanning images show ACE2 (green) distribution in the hemisphere sections. C–F ACE2 (red) ubiquitously distributes in the cerebral microvessels labeled by endothelial cell marker CD31 (green) and pericyte marker PDGFR beta (green), respectively. ACE2 overlapped with pericyte marker PDGFR beta (F) but not endothelial cell marker CD31 (D). C and E showed the low magnitude images. D and F showed the enlarged images of the indicated regions in C and E, respectively. G ACE2 (red) does not distribute in large blood vessels marked by CD31 (green) but is detectable in the meninges wrapping HY. DAPI (blue) was used for nuclear staining. *: indicates large blood vessels. #: indicates meninges. Arrowhead: indicates microvessel. Image magnitude B: 10X; C, E and G: 20X; D and F: 100X Image collected and cropped by CiteAb from the following open publication (https://pubmed.ncbi.nlm.nih.gov/35672716), licensed under a CC-BY license. Not internally tested by R&D Systems.




![Simple Western: ACE-2 Antibody [Unconjugated] [AF933] - Human/Mouse/Rat/Hamster ACE-2 Antibody](https://resources.bio-techne.com/images/products/af933_human-ace-2-ectodomain-affinity-purified-polyclonal-ab-30820241044556.jpg)
