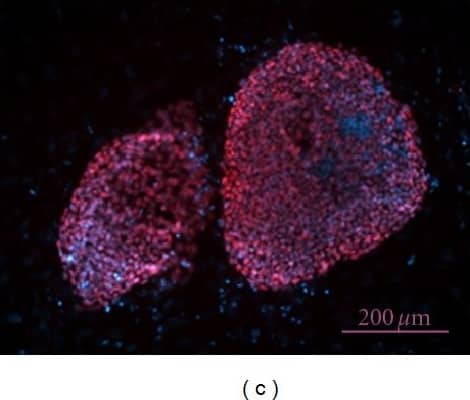
Nanog in BG01V Human Stem Cells-derived Embryoid Body.
Nanog was detected in immersion fixed BG01V human embryonic stem cells-derived embryoid body using 10 µg/mL Goat Anti-Human Nanog Antigen Affinity-purified Polyclonal Antibody (Catalog # AF1997) for 3 hours at room temperature. Cells were stained with the NorthernLights™ 557-conjugated Anti-Goat IgG Secondary Antibody (red;
NL001) and counterstained with DAPI (blue). View our protocol for Fluorescent ICC Staining of Cells on Coverslips.
Nanog in ADLF1 and FAB2 Stem Cell Lines.
Nanog was detected in immersion fixed ADLF1 (top panel) and FAB2 (bottom panel) induced pluripotent stem cell lines using Goat Anti-Human Nanog Antigen Affinity-purified Polyclonal Antibody (Catalog # AF1997) at 10 µg/mL for 3 hours at room temperature. Cells were stained using the NorthernLights™ 557-conjugated Anti-Goat IgG Secondary Antibody (red;
NL001) and counterstained with DAPI (blue). Specific staining was localized to nuclei. View our protocol for Fluorescent ICC Staining of Stem Cells on Coverslips.
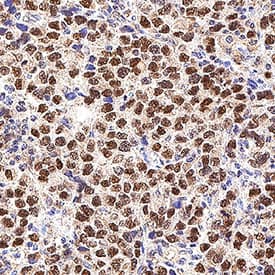
Nanog in Human Testicular Cancer.
Nanog was detected in immersion fixed paraffin-embedded sections of human testicular cancer using Goat Anti-Human Nanog Antigen Affinity-purified Polyclonal Antibody (Catalog # AF1997) at 1 µg/mL for 1 hour at room temperature followed by incubation with the Anti-Goat IgG VisUCyte™ HRP Polymer Antibody (
VC004). Before incubation with the primary antibody, tissue was subjected to heat-induced epitope retrieval using Antigen Retrieval Reagent-Basic (
CTS013). Tissue was stained using DAB (brown) and counterstained with hematoxylin (blue). Specific staining was localized to cell nuclei. Staining was performed using our protocol for IHC Staining with VisUCyte HRP Polymer Detection Reagents.
Nanog in Human Testis.
Nanog was detected in immersion fixed paraffin-embedded sections of normal human testis using Goat Anti-Human Nanog Antigen Affinity-purified Polyclonal Antibody (Catalog # AF1997) at 1 µg/mL for 1 hour at room temperature followed by incubation with the Anti-Goat IgG VisUCyte™ HRP Polymer Antibody (
VC004). Before incubation with the primary antibody, tissue was subjected to heat-induced epitope retrieval using Antigen Retrieval Reagent-Basic (
CTS013). Tissue was stained using DAB (brown) and counterstained with hematoxylin (blue). Specific staining was localized to cytoplasm in developing sperm cells. Staining was performed using our protocol for IHC Staining with VisUCyte HRP Polymer Detection Reagents.
Nanog in 13 d.p.c. mouse embryos.
Nanog was detected in immersion fixed frozen sections of 13 d.p.c. mouse embryos using Goat Anti-Human Nanog Antigen Affinity-purified Polyclonal Antibody (Catalog # AF1997) at 1 µg/mL for 1 hour at room temperature followed by incubation with the Anti-Goat IgG VisUCyte™ HRP Polymer Antibody (
VC004). Before incubation with the primary antibody, tissue was subjected to heat-induced epitope retrieval using Antigen Retrieval Reagent-Basic (
CTS013). Tissue was stained using DAB (brown) and counterstained with hematoxylin (blue). Specific staining was localized to cell nuclei in developing CNS. Staining was performed using our protocol for IHC Staining with VisUCyte HRP Polymer Detection Reagents.
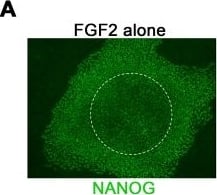
Detection of Human Nanog by Immunocytochemistry/Immunofluorescence
FGF2, TGF beta1, and Activin A cooperatively sustain self-renewal in hESCs.(A) Colonies in N2B27+ FGF2 with or without DM typically exhibit weak NANOG staining in their centres. (B) RT-qPCR analysis showing that FGF2 and TGF beta1 sustain NANOG in a cooperative or synergistic manner (passage 1: n = 2, passage 3: n = 3, all in presence of DM). (C) Typical morphology at passage 2 showing that FGF2 or TGF beta1 alone fail to robustly sustain self-renewal. When applied in combination, however, larger colonies with reduced rates of differentiation are obtained. (D) Titration of FGF2 and TGF beta1 dosage using the NANOG expression level as a readout, in presence of DM. Arrows mark concentrations chosen for further investigation. (E) RT-qPCR analysis showing that additional supplementation with Activin A further enhances the expression of self-renewal genes in hESCs (left chart, n = 5). Note that a dosage of 2.5 to 5 ng/ml was sufficient to achieve near-saturating expression levels. In contrast, the induction of mesendodermal differentiation genes at this concentration of Activin A was still moderate (right chart, n = 5, in presence of FGF2, TGF beta1, and DM over three passages). (F) Analysis of the mesendodermal gene induction signature by Activin A (n = 3, in presence of FGF2, TGF beta1, and DM). Arrows mark the supplementation with Activin A. Note that the Activin-induced upregulation of mesendodermal markers EOMES, GSC, and MIXL1 is fully reversible. Data in this figure: Line HuES6. Image collected and cropped by CiteAb from the following publication (https://dx.plos.org/10.1371/journal.pone.0041958), licensed under a CC-BY license. Not internally tested by R&D Systems.
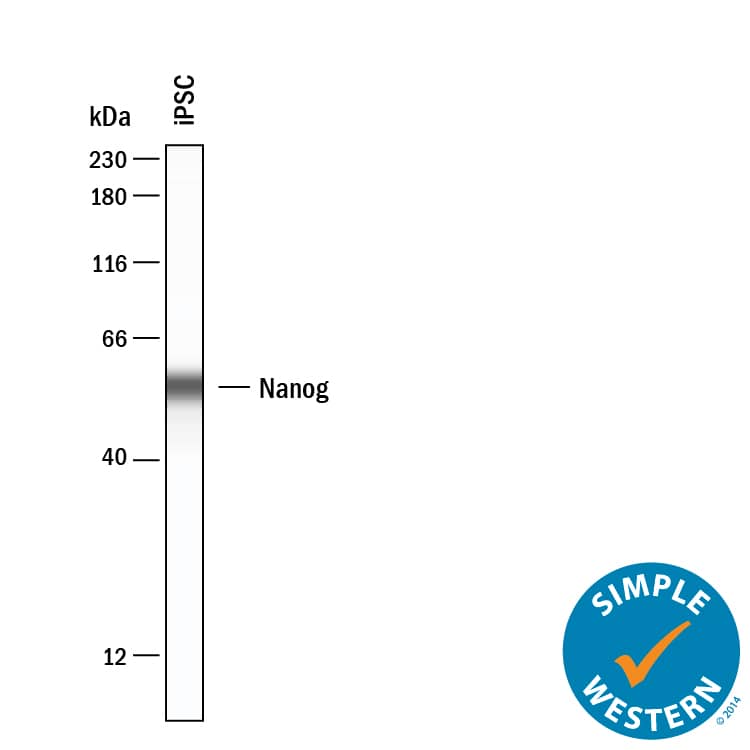
Detection of Human Nanog by Simple WesternTM.
Simple Western lane view shows lysates of iPSC, loaded at 0.2 mg/mL. A specific band was detected for Nanog at approximately 55 kDa (as indicated) using 10 µg/mL of Goat Anti-Human Nanog Antigen Affinity-purified Polyclonal Antibody (Catalog # AF1997) . This experiment was conducted under reducing conditions and using the 12-230 kDa separation system.
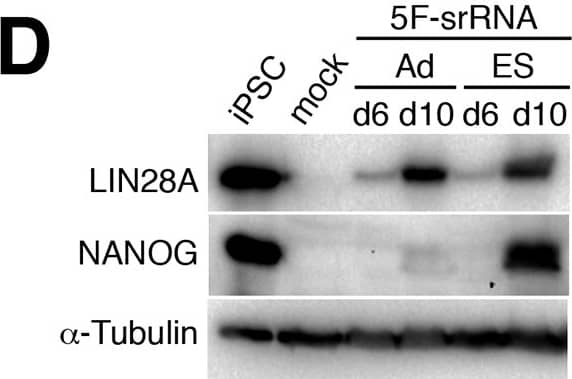
Detection of Human Nanog by Western Blot
Construction and expression of srRNA.A: Scheme of Self-Replicating srRNA constructs. B: Expression of reprogramming factors in OKS-iM 4F-srRNA, OKS-iG 4F-srRNA, OKS-iGM 5F-srRNA, and OKS-iGML 6F-srRNA on day 2 (left) and day 10 (right). BJ cells were co-transfected with srRNAs plus B18R mRNA (1:1 srRNA:B18R mRNA), selected with puromycin and cultured in Advanced DMEM/10% FBS for 10 days. C: qRT-PCR analysis of LIN28A and NANOG from 4F-srRNA and 5F-srRNA transfected BJ cells normalized to GAPDH. Cells were selected with puromycin after the transfection, and cultured in Advanced DMEM/10% FBS (Ad) or ES medium. Cells were collected on day 2, 4, 6, 8 and 10 for 5F-srRNA, and day 10 for 4F-srRNA (OKS-iM and OKS-iG). D: Immunoblot analysis of LIN28A and NANOG in 5F-srRNA transfected BJ cells on day 6 and 10. iPSC: iPSC clone generated with 5F-srRNA from BJ cells. Image collected and cropped by CiteAb from the following publication (https://pubmed.ncbi.nlm.nih.gov/28750082), licensed under a CC-BY license. Not internally tested by R&D Systems.
Detection of Human Nanog by Immunocytochemistry/Immunofluorescence
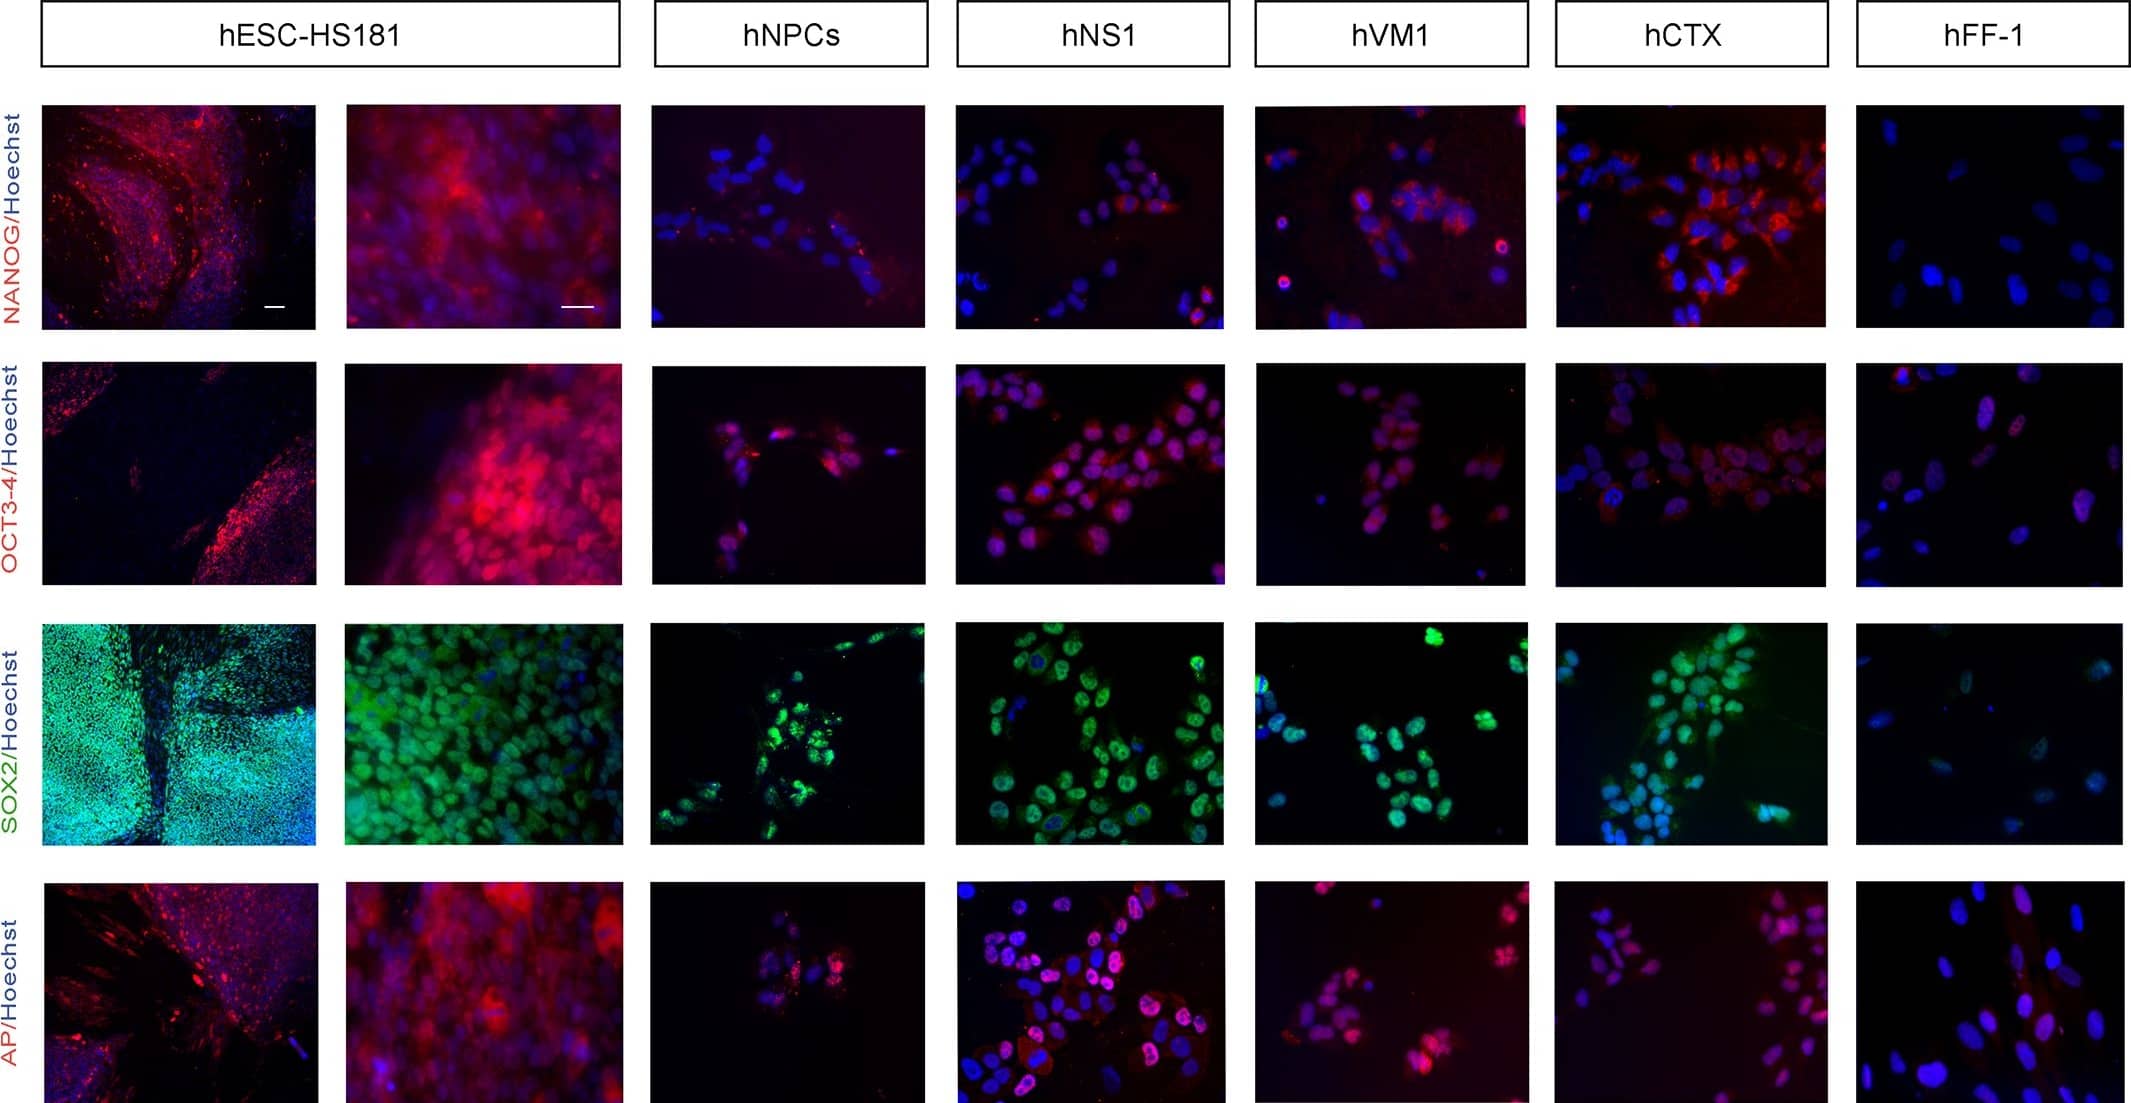
Immunocytochemistry of pluripotency markers.Staining was performed 48 hours following the last passage. From left to right: staining displayed by hESCs (HS181 line, low and high magnifications), hNPCs, v-myc immortalized lines (hNS1, hVM1, and hCTX) and fibroblasts (hFF-1). From top to bottom the markers studied were: NANOG, OCT3/4, SOX2 and AP. Hoechst 33258 nuclear staining is shown in blue. Scale bar represents 100 μm for hESCs in the left hand column (low magnification) and 25 μm for all the other microphotographs. Image collected and cropped by CiteAb from the following publication (https://dx.plos.org/10.1371/journal.pone.0118499), licensed under a CC-BY license. Not internally tested by R&D Systems.
Detection of Human Nanog by Western Blot
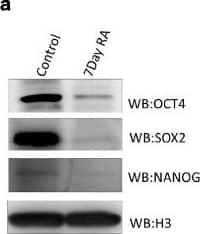
Histone modification profile of bidirectional gene pair during NT2D1 EC cell differentiation. a Immunoblot for Oct4, Nanog and Sox2 for undifferentiated NT2D1 cells and 7 day RA differentiated NT2D1 cells was performed as described in ‘Methods’. After 7 days all these pluripotency factors show diminished expression indicative of differentiated cells. b Relative expression of X linked gene pair NUP62CL and PIH1D3 in undifferentiated and 7 day differentiated NT2D1 cells, normalized to GAPDH in each sample. (c, d, e, f) Relative enrichment of transcription elongation associated histone marks H3K27me1, H3K36me3, H3K79me3 and H3K4me3 in the gene pair NUP62CL and PIH1D3 upon 7 day RA mediated differentiation in NT2D1 cells Image collected and cropped by CiteAb from the following publication (https://pubmed.ncbi.nlm.nih.gov/29716520), licensed under a CC-BY license. Not internally tested by R&D Systems.
Detection of Human Nanog by Immunocytochemistry/Immunofluorescence
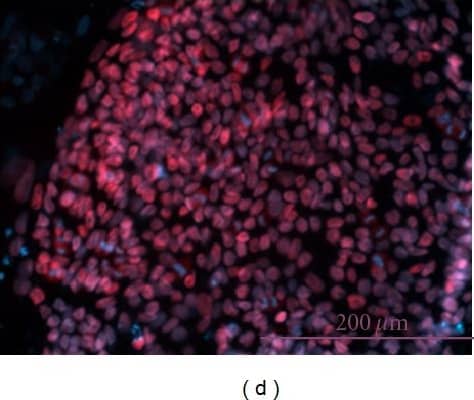
Undifferentiated H7 hESC colonies (on passage 15) 3 days after passaging on hFF feeder cells (a) and after 55 passages on MEF feeder cells (b). H7 cells passaged 11 times on hFF feeder cells expressed Nanog (c and d), Oct4 (e and f), SSEA4 (g and h), and TRA-1-60 (i and j). H7 cells on passage 45 on MEF feeder cells expressed Nanog (k and l), Oct4 (m and n), and SSEA4 (o and p). Scale bars 200 μm. Image collected and cropped by CiteAb from the following publication (https://pubmed.ncbi.nlm.nih.gov/22315618), licensed under a CC-BY license. Not internally tested by R&D Systems.
Detection of Human Nanog by Flow Cytometry
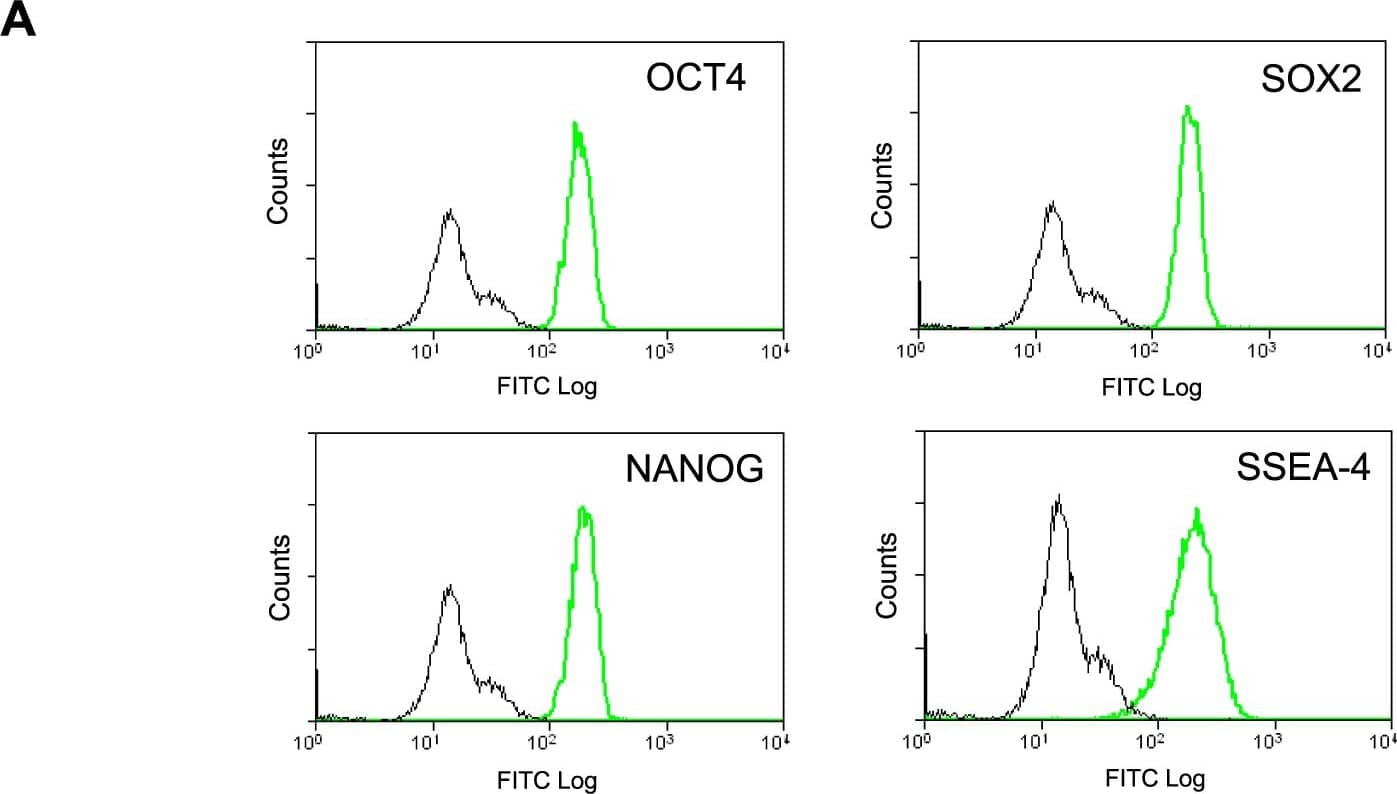
Differentiation Characteristics of Individual Stem Cells.(A) Flow cytometric analysis of undifferentiated stem cell markers in the clonal NTERA2.Tom cell line. Black line depicts P3X negative control and green depicts antigen specific expression (OCT4, SOX2, NANOG and SSEA4). (B) Graph depicting the percentage of TUJ1 positive neurons within differentiated colonies derived from individual RA treated NTERA2.Tom stem cells. (C) Images of differentiated NTERA2.Tom colonies derived from individual NTERA2.Tom cells on a background of wildtype NTERA2 cells. Cell were exposed to RA for 21 days (Green - betaIII tubulin, Blue - Hoechst) White arrows depict betaIII tubulin positive NTERA2.Tom neurons. Scale bar represents 50 µM. Image collected and cropped by CiteAb from the following publication (https://pubmed.ncbi.nlm.nih.gov/20531938), licensed under a CC-BY license. Not internally tested by R&D Systems.
Detection of Human Nanog by Immunocytochemistry/Immunofluorescence
Undifferentiated H7 hESC colonies (on passage 15) 3 days after passaging on hFF feeder cells (a) and after 55 passages on MEF feeder cells (b). H7 cells passaged 11 times on hFF feeder cells expressed Nanog (c and d), Oct4 (e and f), SSEA4 (g and h), and TRA-1-60 (i and j). H7 cells on passage 45 on MEF feeder cells expressed Nanog (k and l), Oct4 (m and n), and SSEA4 (o and p). Scale bars 200 μm. Image collected and cropped by CiteAb from the following publication (https://pubmed.ncbi.nlm.nih.gov/22315618), licensed under a CC-BY license. Not internally tested by R&D Systems.
Detection of Human Nanog by Immunocytochemistry/Immunofluorescence
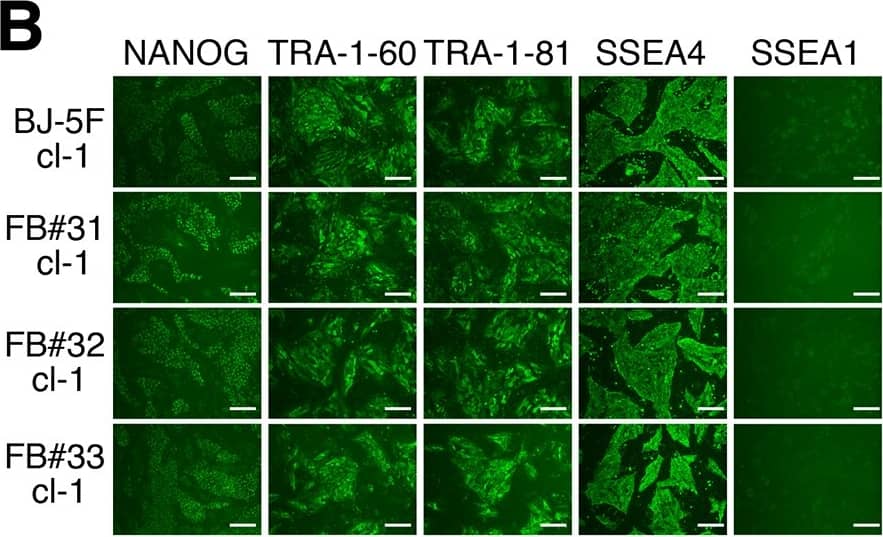
Characterization of iPSC clones from 5F-srRNA.A: qRT-PCR analysis of ES cells markers on 5F-srRNA iPSC clones. Expression of ES marker genes were normalized to GAPDH. B: Immunofluorescence analysis of ES markers in 5F-srRNA iPSC clones from BJ, FB#31, FB#32 and FB#33. Scale bar, 100 mm. C: Teratoma formation of 5F-srRNA iPSC clones. iPSC clones were injected intramuscular or subcutaneous into NRG mice. Teratomas were allowed to form for 4–6 months after injection. Four of five BJ-5F-iPSC clones (#1, 3, 4, 5), three of three FB#31-5F-iPSC clones (#1, 2, 3), and one of two FB#33-5F-iPSC clones (#3) generated teratomas. Cartilage (a, b, c), muscle (d, e, f), neural tissue (g), pigmented epithelium (h), squamous epithelium (i), intestinal epithelium (j, f), and respiratory epithelium (k). Scale bar, 50 μm. D: qRT-PCR for srRNA (nsP1 region) was performed on FB#31, FB#32, and FB #33 -5F-srRNA iPSC clones. Total RNA was isolated from passage 5 (P5) cells. * = no detected amplification. Image collected and cropped by CiteAb from the following publication (https://pubmed.ncbi.nlm.nih.gov/28750082), licensed under a CC-BY license. Not internally tested by R&D Systems.
Detection of Nanog by Western Blot
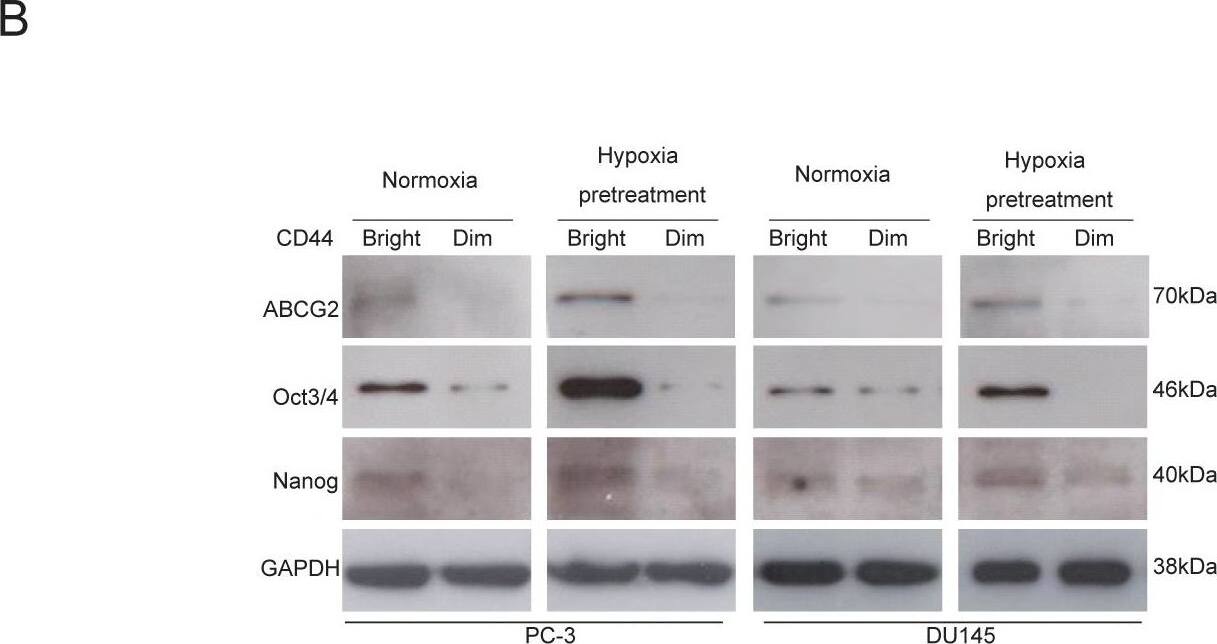
CD44bright cells are mainly positive for ABCG2, Oct3/4 and Nanog.(A) Double staining of CD44 and ABCG2 surface markers with flow cytometry assay shows higher levels expressions of these factors in both cell lines under hypoxia for 48 hours. (B) The CD44bright cells under normoxia express higher levels of ABCG2, Oct3/4 and Nanog, but the CD44dim cells under the same normoxia condition express very low levels of these factors. The CD44bright cells pretreated under 1% O2 for 48 hours show even higher levels of these factors compared to the CD44bright cells cultivated under normoxia. Image collected and cropped by CiteAb from the following open publication (https://pubmed.ncbi.nlm.nih.gov/22216200), licensed under a CC-BY license. Not internally tested by R&D Systems.
Detection of Human Nanog by Immunocytochemistry/ Immunofluorescence
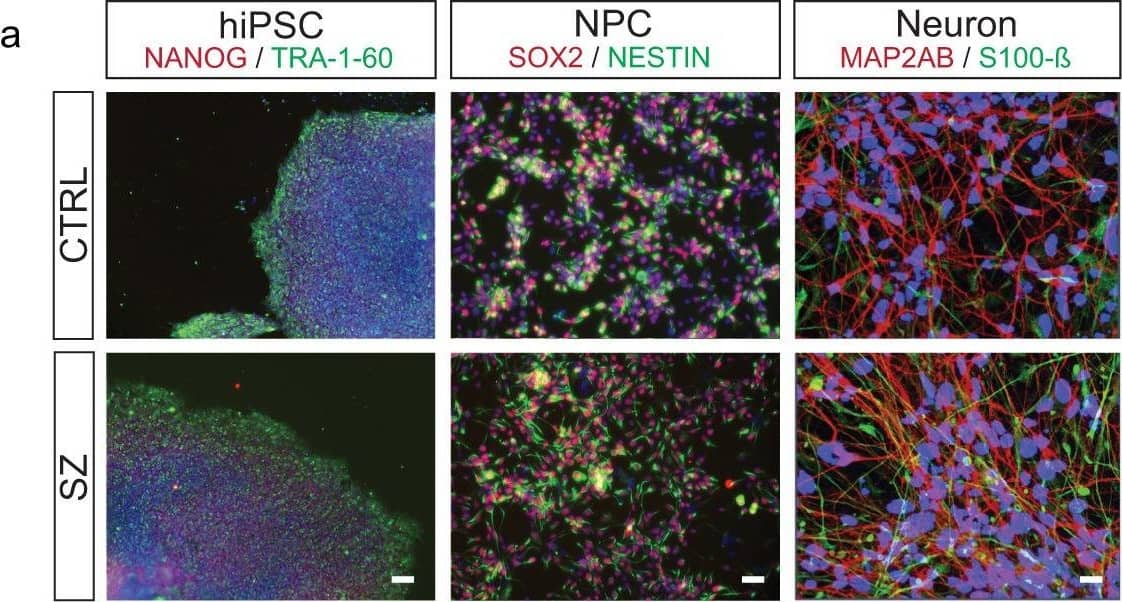
Combinatorial histone hyperacetylation in SZ neurons.a Representative (repeated >3X/group) patient-specific hiPSCs, NPCs, and neurons. Left-hiPSCs express NANOG (green) and TRA-1-60 (red). DAPI (blue). Center-hiPSC neural progenitor cells (NPCs) express NESTIN (green) and SOX2 (red). DAPI (blue). Right-hiPSC neurons express S100 calcium-binding protein B (green) and the dendritic marker MAP2AB (red). DAPI (blue). Scale bar 100 μm. b Heatmap depicting LC-MS/MS data for relative enrichment values of (un)modified and acetylated histones H2AZ.1 and H2AZ.2 in hiPSCs (n = 3/group), NPC (n = 3/group), and 4-week-old neurons from SZ vs. matched controls (n = 4/group). Absolute values (% total peptide) for each peptide are provided. Fold differences between SZ vs. controls are represented (biologically independent replicates/cell-type/condition). Heatmap data represented as means, *p ≤ 0.05, **p ≤ 0.01, ****p ≤ 0.0001 (two-tail Student’s t-tests performed within cell-type, SZ vs. CTRL; adjustments were not made for multiple comparisons). Please see Supplementary Data 1 for LC-MS/MS source data. Increased patterns of H2A.Z acetylation were confirmed via western blotting in c 4-week-old hiPSC neurons [n = 3 (SZ) vs. 4 (CTRL) biologically independent replicates], *p = 0.0538 (two-tail Student’s t-tests), and in d DLPFC from biologically independent postmortem SZ subjects vs. matched controls (n = 9 per group; two-tail Student’s t-tests), *p = 0.0510. Total H2A.Z and GAPDH were used as normalization controls, respectively. A.U. = arbitrary units (normalized to CTRL samples). Data are presented as averages ± SEM. Source data are provided in Source Data files. Image collected and cropped by CiteAb from the following open publication (https://pubmed.ncbi.nlm.nih.gov/35459277), licensed under a CC-BY license. Not internally tested by R&D Systems.
Detection of Human Nanog by Western Blot
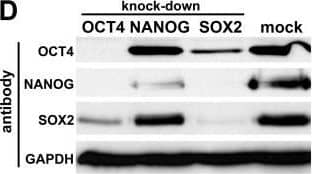
Silencing of OCT4, NANOG, and SOX2 in hEC cells. (A): Initial RNAi screen on hESC marker genes in hEC cells. esiRNA-treated samples were evaluated on the basis of cell morphology and changes in OCT4, NANOG, and SOX2 expression levels (by real-time PCR). Numbers at the bottom are array-based expression ratios of hESCs vs. universal reference RNA. The values for GDF3 and OTX2 are from an in-house platform (our unpublished data) and [34], respectively. Knock-down efficiencies were between 60 and > 90% throughout (not shown). (B): RNAi phenotypes in the OCT4, NANOG, and SOX2 knock-downs. Pictures were taken 2.5 days after esiRNA transfection. The morphology of unmanipulated or mock-treated cells was dependent on the seeding density. When plated at low density as required for esiRNA transfections the cells grew as 3D-shaped colonies rather than in monolayers. Bottom left: Growth curves of NANOG vs. GAPDH esiRNA-transfected cells. (C): Immunostaining of OCT4 protein in samples prepared as in (B). Note that the NANOG RNAi cells are OCT4 positive. (D): Western blot on day 3 RNAi and mock control samples using OCT4, NANOG, and SOX2 antibodies. GAPDH served as a loading control. Image collected and cropped by CiteAb from the following open publication (https://pubmed.ncbi.nlm.nih.gov/17506876), licensed under a CC-BY license. Not internally tested by R&D Systems.
Detection of Human Nanog by Flow Cytometry
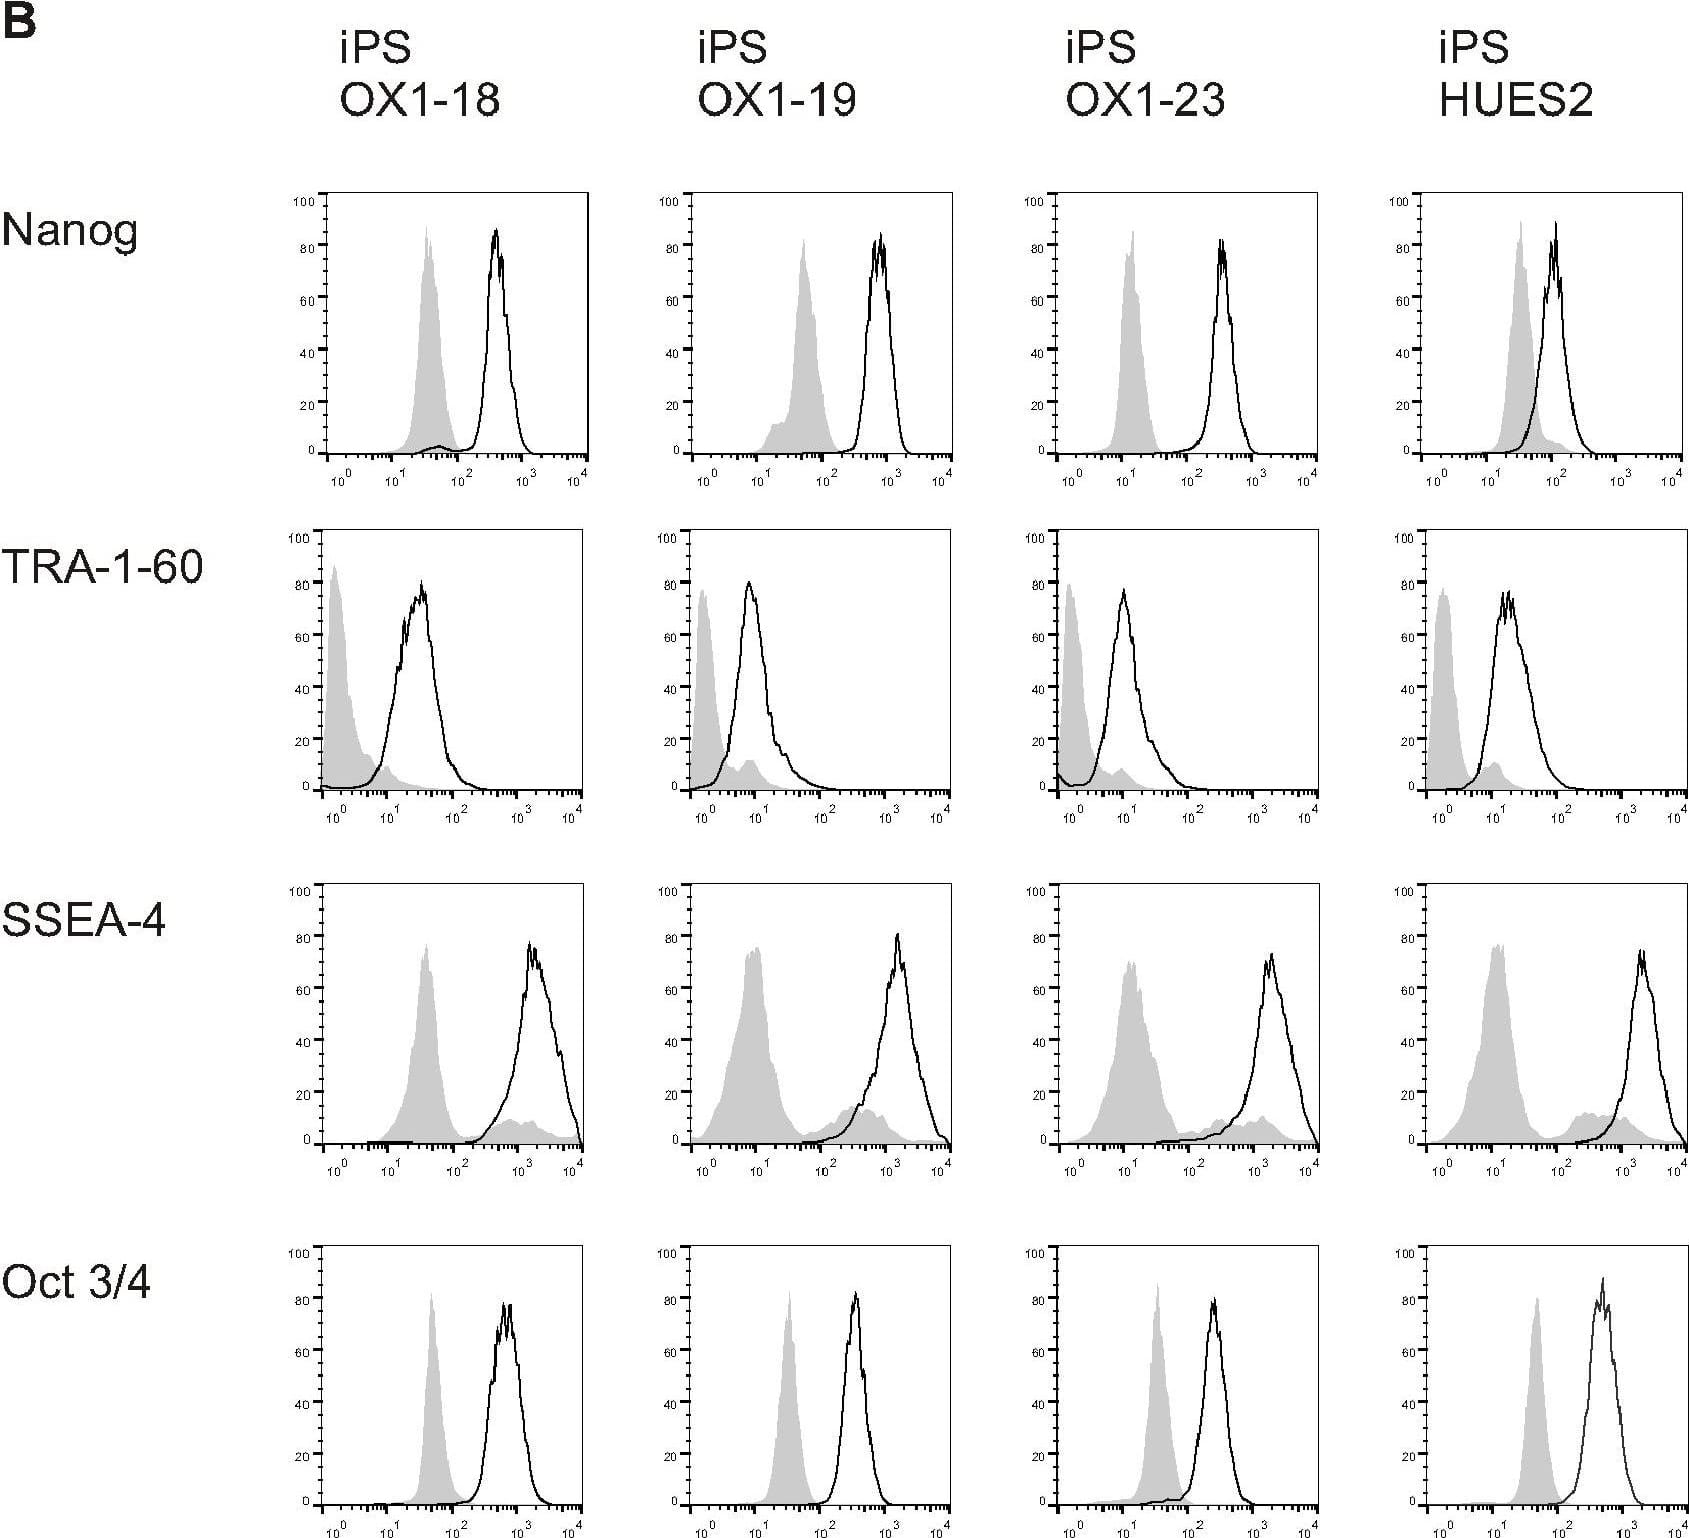
Phenotype of human Pluripotent Stem Cell lines.A) PluriTest analysis of Illumina HT12v4 transcriptome array data shows iPS-OX1-18, iPS-OX1-19 and iPS-OX1-23 to cluster with pluripotent stem cells (red cloud) and not with partly- or differentiated cells (blue clouds). Each circle represents one hiPSC line. B) Expression of human pluripotent stem cell markers. Surface expression of TRA-1-60 and SSEA-4, as well as total expression of Nanog and Oct 3/4, were measured by flow cytometry. Histograms represent surface staining (black line) compared to the isotype control (shaded gray). Image collected and cropped by CiteAb from the following open publication (https://pubmed.ncbi.nlm.nih.gov/23951090), licensed under a CC-BY license. Not internally tested by R&D Systems.
Detection of Nanog by Immunohistochemistry
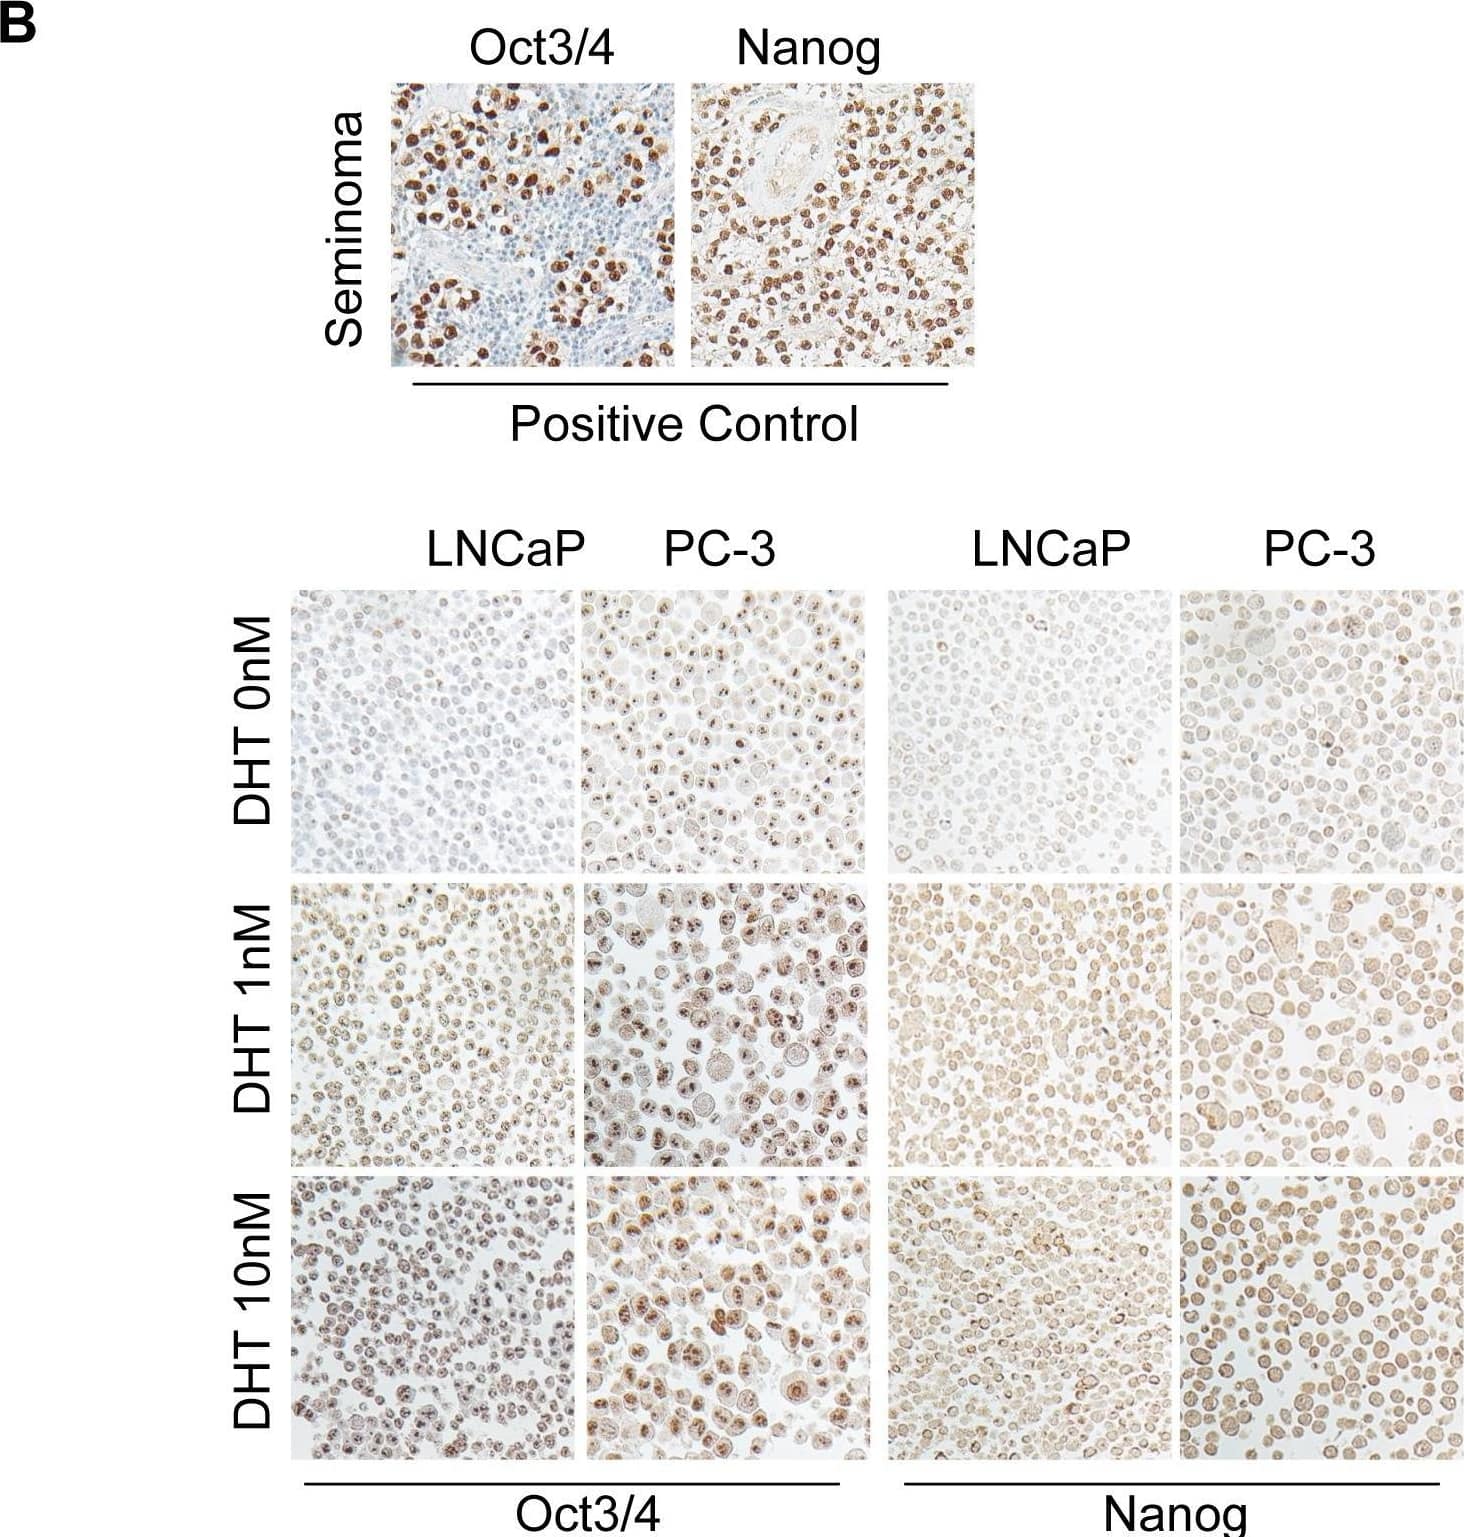
DHT increases Oct3/4 and Nanog expressions in prostate cancer cell lines.(A) The higher expressions of Oct3/4 and Nanog by immunoblotting assay are shown in LNCaP and PC-3 cells treated with 1 nM and 10 nM DHT treatments, respectively, for variable periods of times. (B) The immunocytochemical staining shows higher levels of these two factors in both cell lines treated with different concentrations of DHT. Human seminoma tissue sections were used as positive controls for these two antibodies (bar scale: 50 µm). Image collected and cropped by CiteAb from the following open publication (https://pubmed.ncbi.nlm.nih.gov/23936228), licensed under a CC-BY license. Not internally tested by R&D Systems.


