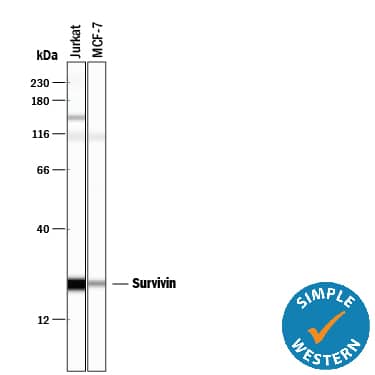
Detection of Human Survivin by Simple WesternTM.
Simple Western lane view shows lysates of Jurkat human acute T cell leukemia cell line and MCF‑7 human breast cancer cell line, loaded at 0.2 mg/mL. A specific band was detected for Survivin at approximately 23 kDa (as indicated) using 5 µg/mL of Rabbit Anti-Human Survivin Antigen Affinity-purified Polyclonal Antibody (Catalog # AF886). This experiment was conducted under reducing conditions and using the 12-230 kDa separation system.
Detection of Human Survivin by Immunohistochemistry
Survivin expression in human chondrosarcoma. Immunohistochemistry and immunoblot for survivin (red staining) from human chondrosarcoma specimens. A: Low-power image of human high-grade chondrosarcoma displays strong cellular expression of survivin protein. B: High-power magnification reveals the predominantly cytoplasmic staining, although strong nuclear signals are detectable. C and D: Other specimen of a grade III chondrosarcoma stained with monoclonal antibody, shows a similar pattern of staining. E: Strong survivin signal in a tumor cell displaying a mitotic figure (arrow). F: To verify the expression of survivin in human chondrosarcoma, immunoblots were performed from 3 high grade chondrosarcoma lysates (Patient Nr. 5, 7, 10). As control for the correct molecular weight, in vitro-transcribed and -translated (IVTT) recombinant survivin protein, derived from the full-length human cDNA was loaded. Furthermore, lysates from adult human cartilage served as a negative control. Total protein loaded was 1 μg for recombinant human survivin, 60 μg for chondrosarcoma and cartilage lysates. For A, B and E the polyclonal rabbit anti-survivin antibody AF886 was used. For C and D the monoclonal mouse anti-survivin antibody clone 32.1 was used. Original magnifications: 200× (A and C) and 400× (B and D) and 600× (E). Image collected and cropped by CiteAb from the following open publication (https://bmccancer.biomedcentral.com/articles/10.1186/1471-2407-11-120), licensed under a CC-BY license. Not internally tested by R&D Systems.
Detection of Human Survivin by Western Blot
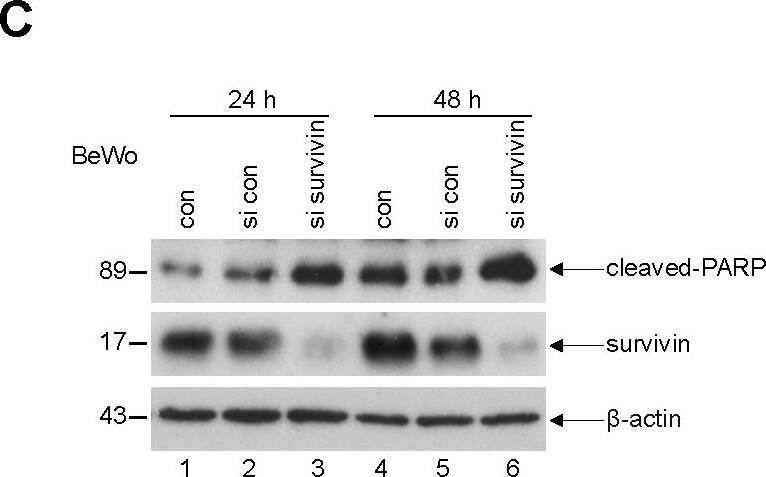
Survivin is required for the proliferation of trophoblastic cells and depletion induces a G2/M arrest.(A) Cell viability assay. JAR (left panel), BeWo (middle panel) and HTR-8/SVneo (HTR, right panel) cells were non-treated (con), treated with either control scrambled siRNA (si con) or siRNA targeting survivin (si survivin) and cell viability was analyzed at indicated time points. Bar: ± SD. (B) Cell cycle profiles. Cells were depleted of survivin for 48 h and cell cycle analysis was performed. con: untreated cells as control. si con: treated with control scrambled siRNA. si survivin: treated with siRNA against survivin. Right panels: quantification of the sub-phases of the cell cycle. (C) Western blot analysis. BeWo cells were transfected with scrambled siRNA (si con) or siRNA targeting survivin (si survivin) for 24 h or 48 h and cellular extracts were prepared for Western blot analysis using indicated antibodies. beta-actin served as loading control. con: non-treated lysates as control. (D) Relative caspase-3/7 activity. The lysates from JAR or BeWo cells treated as in (C) were used for evaluating caspase-3/7 activity. The results are presented as mean ± SD. Image collected and cropped by CiteAb from the following open publication (https://dx.plos.org/10.1371/journal.pone.0073337), licensed under a CC-BY license. Not internally tested by R&D Systems.
Detection of Human Survivin by Western Blot
ATM and DNA-PKCS induce cell cycle arrest after Survivin-RNAi. a: Western blot analysis of HCT116 and HCT116shATM total cell lysates following Survivin-RNAi (shSurv). Included are shLuc-transduced cells as control. Red values indicate densitometric estimation of protein levels, normalized to Tubulin. b: Indirect immunofluorescence analysis of transduced SBC-2 cells showing colocalisation of activated ATM (ATM S1981) and activated DNA-PK kinase (DNA-PKCS T2609) in shSurv polyploid cells. c: Western blot of HCT116 and HCT116p53−/− cell lysates showing analysis of p53 phosphorylation sites after Survivin knockdown. d: Proposed outline of Survivin RNAi phenotype and the observed DNA-damage response signaling. e: Analysis of HCT116 and HCT116shATM cells transduced with shSurv and combined treatment with DNA-PKCS inhibitor (DNA-PK-I, 10 μM Nu7026) or DMSO. Note combined inhibition of ATM and DNA-PKcs results in a decreased accumulation of p53 and p21waf/cip protein levels and reduction of gammaH2AX levels. Image collected and cropped by CiteAb from the following open publication (https://pubmed.ncbi.nlm.nih.gov/24886358), licensed under a CC-BY license. Not internally tested by R&D Systems.
Detection of Mouse Survivin by Immunohistochemistry
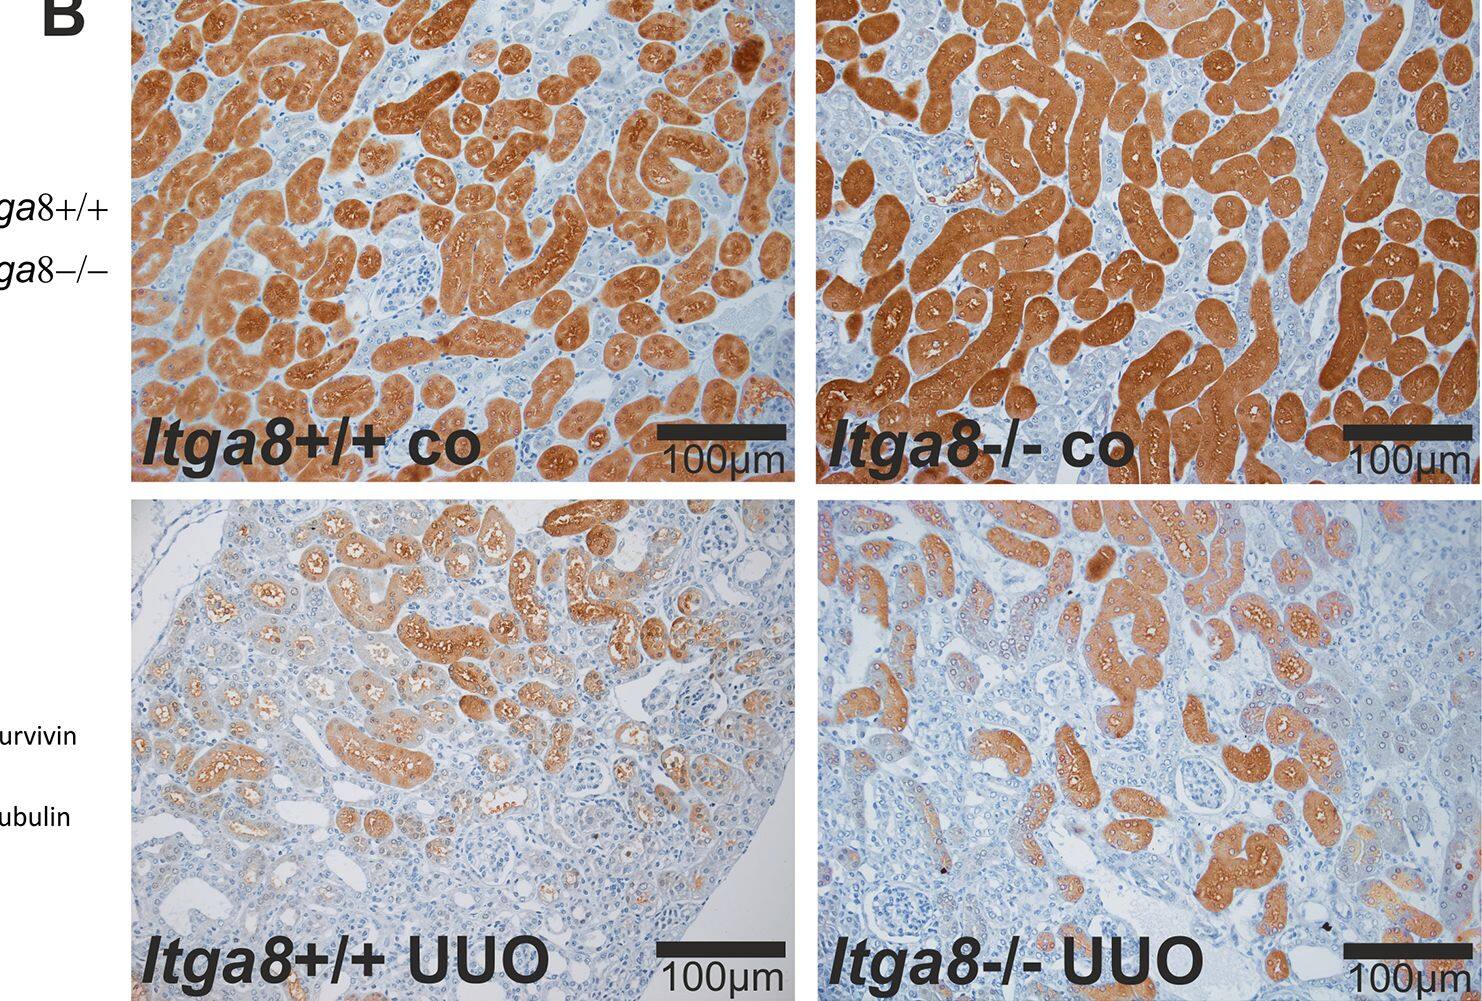
Survivin in tubulointerstitial cells.A, Western blot analysis of survivin protein in the renal cortex of wild type and Itga8-/- mice after induction of unilateral ureter obstruction (UUO). B,Exemplary photomicrographs show renal localization of survivin. Itga8+/+, wild type mice; Itga8-/-, Itga8-deficient mice. Data are means±SEM. # p<0.05 UUO versus control (co). Image collected and cropped by CiteAb from the following open publication (https://pubmed.ncbi.nlm.nih.gov/26938996), licensed under a CC-BY license. Not internally tested by R&D Systems.
Detection of Mouse Survivin by Western Blot
Inhibition of PI3K gamma attenuates tumor growth in xenograft models associated with infiltrated macrophages.a Experimental procedure illustrating the TG100-115 treatment regimen in BALB/c mice. b CT26 cells (5 × 10⁵ cells/mouse) were subcutaneously injected into the flanks of 6-week-old mice. Mean tumor volume of subcutaneously implanted vehicle- or TG100-115-treated mice (n = 5) and representative images of subcutaneous tumors at day 16 after treatment with vehicle or TG100-115 (box) are shown. c FACS analysis and quantification of CD11b+ F4/80+ (TAM) cell populations in CT26 tumors at day 14 posttreatment (n = 5) and expression levels of MHCII (M1) and CD206 (M2) in CD11b+ F4/80+ cell populations. d Graph showing the percentage of each population (M1, M2) in the vehicle-treated group in comparison with the TG100-115-treated group. e mRNA expression levels of genes involved in the proinflammatory response (il-1 beta, cxcl10) and antiinflammatory response (il-10 and tgf-beta) were evaluated by real-time PCR in vehicle and TG100-155-treated groups. f Representative western blot analysis showing survival/EMT-related protein expression as well as ERK/AKT-FBW7-MCL-1 signal axis regulation in vehicle- and TG100-155-treated mouse tumor tissues. Image collected and cropped by CiteAb from the following open publication (https://pubmed.ncbi.nlm.nih.gov/32444799), licensed under a CC-BY license. Not internally tested by R&D Systems.
Detection of Mouse Survivin by Western Blot
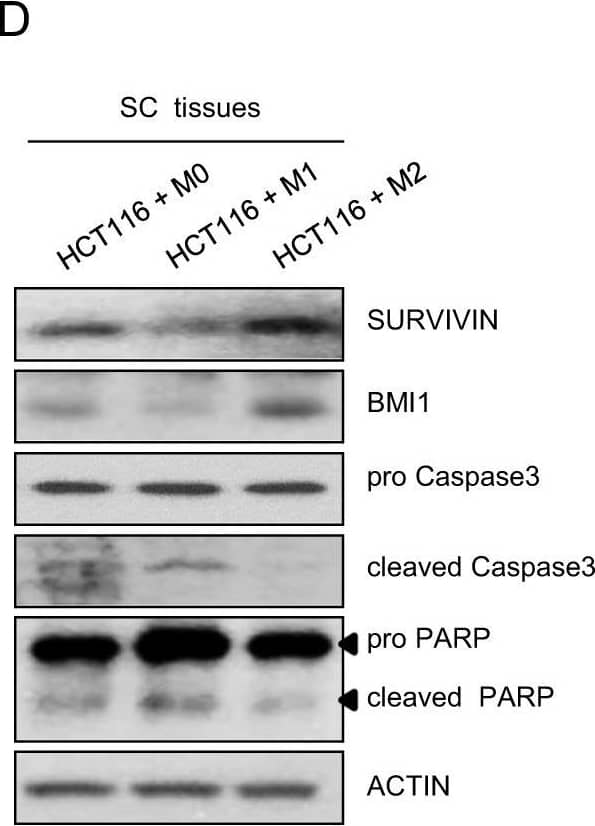
Opposite effects of M1 and M2 macrophages on tumor growth.a Tumor images and b tumor growth 3 weeks after transplantation of HCT116 cells after long-term coculture with differentiated M0, M1, or M2 macrophages (see Materials and Methods). Tumor size was measured 2–3 times a week with a caliper. Tumor volume was calculated using the following formula: tumor volume = (short length × long length × width)/2. The expression of SURVIVIN or p21c) and proliferation markers d in mouse subcutaneous tissues was evaluated by real-time PCR and western blotting, respectively. e Ki67 staining (1:200) of mouse subcutaneous tissues three weeks after subcutaneous injection. Scale bar: 100 μm. The results shown are presented as the mean ± SD from three mice per group. Actin was used as a loading control. *P < 0.05; **P < 0.01; ***P < 0.001. Image collected and cropped by CiteAb from the following open publication (https://pubmed.ncbi.nlm.nih.gov/32444799), licensed under a CC-BY license. Not internally tested by R&D Systems.
Detection of Mouse Survivin by Western Blot
Survivin in tubulointerstitial cells.A, Western blot analysis of survivin protein in the renal cortex of wild type and Itga8-/- mice after induction of unilateral ureter obstruction (UUO). B,Exemplary photomicrographs show renal localization of survivin. Itga8+/+, wild type mice; Itga8-/-, Itga8-deficient mice. Data are means±SEM. # p<0.05 UUO versus control (co). Image collected and cropped by CiteAb from the following open publication (https://pubmed.ncbi.nlm.nih.gov/26938996), licensed under a CC-BY license. Not internally tested by R&D Systems.
Detection of Mouse Survivin by Western Blot
Role of PI3K gamma in TAM-mediated colon cancer cell viability and EMT characteristics.mRNA expression levels of genes involved in the proinflammatory response (IL-1 alpha, IL-1 beta, CXCL10, and IL-8) and antiinflammatory response (IL-10 and CCL17) were evaluated by real-time PCR in M1 a and M2 b macrophages with or without treatment with 10 nm TG100-115 (PI3K gamma inhibitor) for 18 h. c HT29 cells were exposed to TG100-115-treated macrophage CM for 24 h. Cell viability was then measured by WST-1 assay. d Expression levels of apoptosis- and EMT-related markers in CM-treated HT29 cells. CMs were derived from TG100-115 (10 nm)-treated or untreated M0, M1, and M2 macrophages. HT29 cells e and PDCs f were incubated with TG100-115-treated macrophage CM for 24 h. Protein levels of MCL-1 and FBW7 were evaluated using western blotting. Actin was used as a loading control. The results are presented as the mean ± SE. *P < 0.05; **P < 0.01; ***P < 0.001. Image collected and cropped by CiteAb from the following open publication (https://pubmed.ncbi.nlm.nih.gov/32444799), licensed under a CC-BY license. Not internally tested by R&D Systems.
Detection of Human Survivin by Western Blot
Analysis for RNA-induced silencing complex cleavage products in treated tumors and immunoblot analysis for target protein complexes and death signals in primary tumors. (A) Total RNA was isolated from tumor tissue and used for 5′ ligation-mediated RACE to determine whether RNA-induced silencing complex (RISC)-mediated cleavage of the transcript occurred. The predicted RACE products are indicated to the right, the size (base pairs (bp)) of the DNA standards shown on the left, and the treatment administered indicated above the lanes. (B) Immunoblot analysis of MDA-MB-231 day 10 tumor lysates following intravenous treatments of 0.01 mg/kg TBG-siCDK11, TBG-siCK2, or TBG-siCON1 as indicated above the blots. The signals for three mice per group are shown and the proteins detected are indicated on the right side of the blots. Actin signal was used as the loading control. (C) The protein signals from all mice in each treatment group were quantitated by densitometry using ImageJ software (National Institutes of Health Bethesda, MD, USA). Data presented as mean ± standard error. *P <0.05, **P <0.01. CDK, cyclin-dependent kinase; CK2, casein kinase 2; si, small interfering; TBG, tenfibgen. Image collected and cropped by CiteAb from the following open publication (https://breast-cancer-research.biomedcentral.com/articles/10.1186/s13058-015-0524-0), licensed under a CC-BY license. Not internally tested by R&D Systems.
Detection of Human Survivin by Immunohistochemistry
Survivin expression in human chondrosarcoma. Immunohistochemistry and immunoblot for survivin (red staining) from human chondrosarcoma specimens. A: Low-power image of human high-grade chondrosarcoma displays strong cellular expression of survivin protein. B: High-power magnification reveals the predominantly cytoplasmic staining, although strong nuclear signals are detectable. C and D: Other specimen of a grade III chondrosarcoma stained with monoclonal antibody, shows a similar pattern of staining. E: Strong survivin signal in a tumor cell displaying a mitotic figure (arrow). F: To verify the expression of survivin in human chondrosarcoma, immunoblots were performed from 3 high grade chondrosarcoma lysates (Patient Nr. 5, 7, 10). As control for the correct molecular weight, in vitro-transcribed and -translated (IVTT) recombinant survivin protein, derived from the full-length human cDNA was loaded. Furthermore, lysates from adult human cartilage served as a negative control. Total protein loaded was 1 μg for recombinant human survivin, 60 μg for chondrosarcoma and cartilage lysates. For A, B and E the polyclonal rabbit anti-survivin antibody AF886 was used. For C and D the monoclonal mouse anti-survivin antibody clone 32.1 was used. Original magnifications: 200× (A and C) and 400× (B and D) and 600× (E). Image collected and cropped by CiteAb from the following open publication (https://bmccancer.biomedcentral.com/articles/10.1186/1471-2407-11-120), licensed under a CC-BY license. Not internally tested by R&D Systems.
Detection of Mouse Survivin by Western Blot
Ex vivo analysis of the role of macrophage CM in colon cancer patient-derived cells (PDCs).a Estimation of PDC viability after coculture with macrophage CM for 24 h using the WST-1 assay. Error bars are derived from three independent experiments. b Expression levels of apoptosis and EMT markers in macrophage CM-treated PDCs were measured by western blotting. c Wound-healing ability was evaluated by creating wounds on a confluent monolayer of PDCs using 1-Dish 35-mm-high culture inserts. d Activation of AKT and ERK and expression levels of MCL-1 and FBW7 assessed by western blotting. Actin was used as a loading control. The results are presented as the mean ± SE. **P < 0.01; ***P < 0.001. Image collected and cropped by CiteAb from the following open publication (https://pubmed.ncbi.nlm.nih.gov/32444799), licensed under a CC-BY license. Not internally tested by R&D Systems.
Detection of Human Survivin by Western Blot
Response over time to TBG-RNAi-CK2 treatment in PC3-LN4 xenograft tumors(A) Verification of nuclear and cytosol protein fractionation from tumor tissue is shown by comparative immunoblot analysis of CK2 alpha alpha′, lamin A/C, ERp72, and actin. T1, T2, and T3 labels indicate different tumors. Antibody sourcing information is listed in Materials and Methods. (B) Immunoblot analysis of fractionated PC3-LN4 tumor lysates following intravenous treatments of 0.01 mg/kg TBG-RNAi-CK2 or TBG-RNAi-F7 as indicated above the blots. The signals for three mice per group are shown, the proteins detected are indicated on the right, and the cell fraction and size markers are indicated on the left. Actin signal was used as the loading control. T1, T2, and T3 labels indicate different tumors within each treatment group. Antibody sourcing information is listed in Materials and Methods. (C) The percentage of Ki-67-positive tumor cells was determined from Ki-67-stained tumor sections. The percentage of Ki-67-positive cells on each day was expressed relative to day 5 (setting day 5 as 100%) and is shown graphically for each treatment. Mean and standard deviation are shown. Sample sizes: n = 6 for all groups except n = 7 for TBG-RNAi-F7 day 7. Image collected and cropped by CiteAb from the following open publication (https://www.oncotarget.com/lookup/doi/10.18632/oncotarget.11442), licensed under a CC-BY license. Not internally tested by R&D Systems.
Detection of Human Survivin by Western Blot
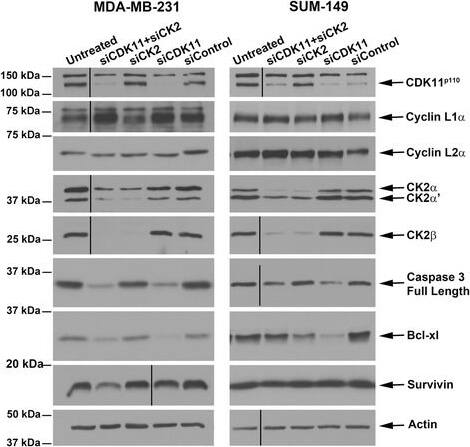
Immunoblot analyses following small interfering RNA-mediated downregulation of CDK11 and CK2 in breast cancer cells. Immunoblot analysis of MDA-MB-231 and SUM-149 cell lysates following small interfering RNA (siRNA) transfection. Transfected siRNAs are indicated above the blots, proteins detected are indicated on the right side of the blots. CDK11p110, cyclin L1 alpha, cyclin L2 alpha, and CK2 alpha alpha′ beta lysates are 72 hours post transfection; caspase 3, Bcl-xL, and survivin lysates are 96 hours post transfection. Actin signal was used as the loading control. CDK, cyclin-dependent kinase; CK2, casein kinase 2. Image collected and cropped by CiteAb from the following open publication (https://breast-cancer-research.biomedcentral.com/articles/10.1186/s13058-015-0524-0), licensed under a CC-BY license. Not internally tested by R&D Systems.
Detection of Human Survivin by Immunohistochemistry
Survivin expression in human chondrosarcoma. Immunohistochemistry and immunoblot for survivin (red staining) from human chondrosarcoma specimens. A: Low-power image of human high-grade chondrosarcoma displays strong cellular expression of survivin protein. B: High-power magnification reveals the predominantly cytoplasmic staining, although strong nuclear signals are detectable. C and D: Other specimen of a grade III chondrosarcoma stained with monoclonal antibody, shows a similar pattern of staining. E: Strong survivin signal in a tumor cell displaying a mitotic figure (arrow). F: To verify the expression of survivin in human chondrosarcoma, immunoblots were performed from 3 high grade chondrosarcoma lysates (Patient Nr. 5, 7, 10). As control for the correct molecular weight, in vitro-transcribed and -translated (IVTT) recombinant survivin protein, derived from the full-length human cDNA was loaded. Furthermore, lysates from adult human cartilage served as a negative control. Total protein loaded was 1 μg for recombinant human survivin, 60 μg for chondrosarcoma and cartilage lysates. For A, B and E the polyclonal rabbit anti-survivin antibody AF886 was used. For C and D the monoclonal mouse anti-survivin antibody clone 32.1 was used. Original magnifications: 200× (A and C) and 400× (B and D) and 600× (E). Image collected and cropped by CiteAb from the following open publication (https://bmccancer.biomedcentral.com/articles/10.1186/1471-2407-11-120), licensed under a CC-BY license. Not internally tested by R&D Systems.
Detection of Human Survivin by Western Blot
BV6 considerably reduces expression of IAP proteins. SW480, HT-29 and HCT-15 cells were plated in a 3D laminin-rich extracellular matrix and treated with 1 μM BV6 or DMSO control 4 h before irradiation with 4 Gy. At different time points, expression of indicated proteins was analyzed by Western blotting, while beta-actin served as loading control. Two independent experiments were performed with similar results Image collected and cropped by CiteAb from the following open publication (https://pubmed.ncbi.nlm.nih.gov/26383618), licensed under a CC-BY license. Not internally tested by R&D Systems.
Detection of Human Survivin by Western Blot
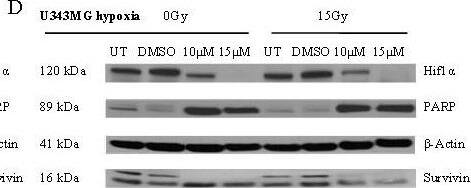
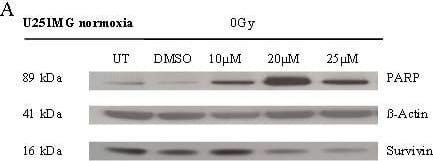
Effects of BA and irradiation on protein expression levels of glioma cells. BA treatment affects the cleavage of PARP, the expression of survivin and hypoxia-induced HIF-1 alpha protein levels in U251MG (left) and U343MG (right) cells. Cell lines were untreated (UT), treated with DMSO or with increasing doses of BA from 10, 20 or 25 μM under normoxic conditions (A, B) and untreated (UT), treated with DMSO or with doses of 10 or 15 μM BA plus irradiation at 15 Gy under hypoxic conditions (C, D). Actin served as an internal loading control. The Western blot shows one representative result out of three independent experiments. Image collected and cropped by CiteAb from the following open publication (https://pubmed.ncbi.nlm.nih.gov/21906280), licensed under a CC-BY license. Not internally tested by R&D Systems.
Detection of Survivin by Western Blot
IGF-I induces Survivin through a Smad dependent mechanism.(A) NRP-152 cells plated overnight in GM3 were treated at various times with LR3-IGF-I for up to 72 h, and cell lysates were analyzed for Western blot expression of Survivin, and P-Smads 2 and 3. (B) NRP-152 cells stably expressing sh-Smads 2, 3, and 2+3 or lentiviral sh-LacZ (control) were treated with 2 nM LR3-IGF-I or vehicle for 24 h prior to Western blot analysis for Survivin and Smads 2 and 3. (C) NRP-152 cells stably expressing sh-Smads 2+3 or lentiviral sh-LacZ (control) were treated with DMSO vehicle or 10 µM SB431542 for 2 h prior to treatment with 2 nM LR3-IGF-I or vehicle for 24 h, and changes in Survivin expression was assessed by Western blot analysis. (D) NRP-152 cells were treated with either 10 µM HTS466284 or 10 µM SB43152 for 2 h prior to treatment with 2 nM LR3-IGF-I or vehicle for 24 h, and changes in Survivin expression were assessed by Western blot analysis. (E,F) RWPE-1 and VCaP cells plated in GM3 were treated with LR3-IGF-I and the TGF-beta receptor kinase inhibitors HTS466284 (HTS) or TKDI for 24 h prior to lysing cells for Western blot analysis of Survivin expression. Results are representative of two to three separate experiments. Image collected and cropped by CiteAb from the following open publication (https://pubmed.ncbi.nlm.nih.gov/23658701), licensed under a CC-BY license. Not internally tested by R&D Systems.
Detection of Human Survivin by Western Blot
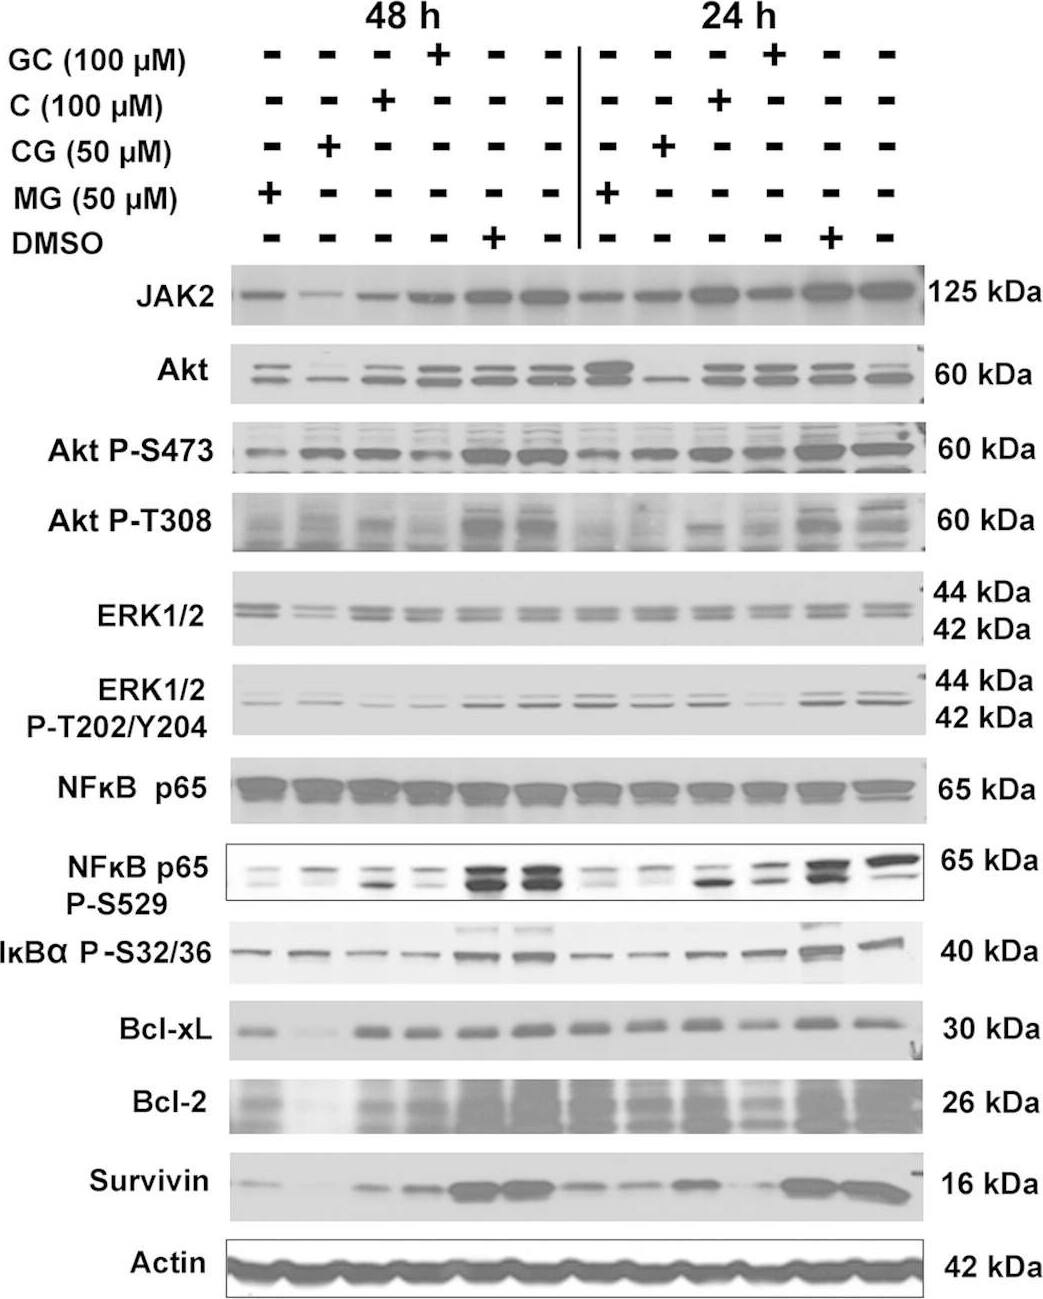
Western blot analyses following treatment of PC-3 cells with AHC compounds.Western blot analysis of cellular lysates prepared from PC-3 cells treated with 7-O-galloyl catechin (GC), catechin (C), catechin gallate (CG), methyl gallate (MG), or equal dilution of DMSO was performed. Treatments are indicated above the blots. The protein detected is indicated to the left of each blot, and the size of protein detected is indicated to the right of each blot. The quantitation of the data is shown in Supplementary Table 2. Cropped blots are shown. Full sized blots are included in Supplementary Fig. 3. All gels and blots were run under the same experimental conditions as described in Methods. Image collected and cropped by CiteAb from the following open publication (https://pubmed.ncbi.nlm.nih.gov/26975752), licensed under a CC-BY license. Not internally tested by R&D Systems.
Detection of Human Survivin by Western Blot
Effects of BA and irradiation on protein expression levels of glioma cells. BA treatment affects the cleavage of PARP, the expression of survivin and hypoxia-induced HIF-1 alpha protein levels in U251MG (left) and U343MG (right) cells. Cell lines were untreated (UT), treated with DMSO or with increasing doses of BA from 10, 20 or 25 μM under normoxic conditions (A, B) and untreated (UT), treated with DMSO or with doses of 10 or 15 μM BA plus irradiation at 15 Gy under hypoxic conditions (C, D). Actin served as an internal loading control. The Western blot shows one representative result out of three independent experiments. Image collected and cropped by CiteAb from the following open publication (https://pubmed.ncbi.nlm.nih.gov/21906280), licensed under a CC-BY license. Not internally tested by R&D Systems.
Detection of Human Survivin by Western Blot
Western blot analyses following treatment of MDA-MB-231 cells with AHC compounds.Western blot analysis of cellular lysates prepared from MDA-MB-231 cells treated with 2 concentrations each of catechin gallate (CG) and methyl gallate (MG), or dilution of DMSO representing the highest concentration was performed. Treatments are indicated above the blots. The protein detected is indicated to the left of each blot, and the size of protein detected is indicated to the right of each blot. The quantitation of the data is shown in Supplementary Table 3. Cropped blots are shown. Full sized blots are included in Supplementary Fig. 4. All gels and blots were run under the same experimental conditions as described in Methods. Image collected and cropped by CiteAb from the following open publication (https://pubmed.ncbi.nlm.nih.gov/26975752), licensed under a CC-BY license. Not internally tested by R&D Systems.


