FABP4 in Mouse Intestine.
FABP4 was detected in perfusion fixed frozen sections of mouse intestine using Goat Anti-Mouse/Rat FABP4 Antigen Affinity-purified Polyclonal Antibody (Catalog # AF1443) at 5 µg/mL overnight at 4 °C. Tissue was stained using the Anti-Goat HRP-DAB Cell & Tissue Staining Kit (brown; Catalog #
CTS008) and counterstained with hematoxylin (blue). Specific labeling was localized to the plasma membrane of epithelial cells in intestinal glands. View our protocol for Chromogenic IHC Staining of Frozen Tissue Sections.
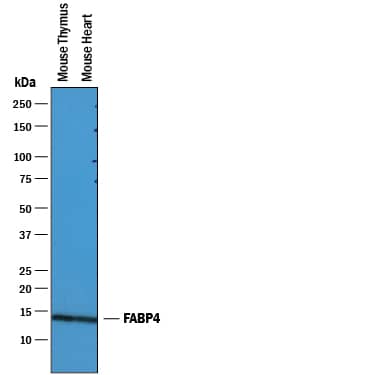
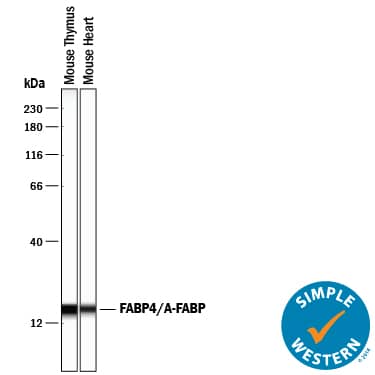
Detection of Mouse FABP4/A‑FABP by Simple WesternTM.
Simple Western lane view shows lysates of mouse thymus tissue and mouse heart tissue, loaded at 0.2 mg/mL. A specific band was detected for FABP4/A-FABP at approximately 17 kDa (as indicated) using 2.5 µg/mL of Goat Anti-Mouse/Rat FABP4/A-FABP Antigen Affinity-purified Polyclonal Antibody (Catalog # AF1443) followed by 1:50 dilution of HRP-conjugated Anti-Goat IgG Secondary Antibody (Catalog #
HAF109). This experiment was conducted under reducing conditions and using the 12-230 kDa separation system.
Detection of Mouse FABP4/A-FABP by Western Blot
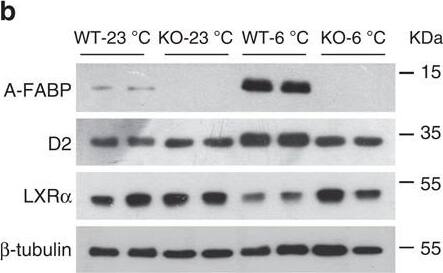
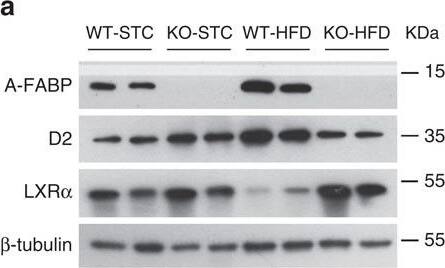
A-FABP mediates expression of Dio2 via inhibition of LXR alpha.(a,b) BAT isolated from WT and A-FABP KO mice (a) fed with STC or HFD for 24 weeks or (b) subjected to room temperature (23 °C) or cold exposure (6 °C) for 24 h as indicated in Fig. 2 were subjected to immunoblotting using an antibody against A-FABP, type II iodothyronine deiodinase (D2), liver X receptor alpha (LXR alpha) and beta-tubulin. The bar charts below are the band intensity of each protein relative to beta-tubulin and expressed as arbitrary units, N.D., not detected (n=6). (c,d) The mRNA abundance of A-FABP, Dio2 and LXR alpha in BAT of above WT and A-FABP KO mice (c) fed with STC or HFD for 24 weeks or (d) subjected to cold exposure (6 °C) for 24 h (n=6). (e) The mRNA abundance of A-FABP, LXR alpha and Dio2 in WT or A-FABP-deficient primary brown adipocytes incubated with PBS or recombinant A-FABP (rA-FABP, 2 μg ml−1) for 24 h (n=6). (f) The mRNA abundance of LXR alpha downstream target genes (SCD-1, SREBP-1c) and Dio2 in WT and A-FABP-deficient primary brown adipocytes treated with or without LXR alpha agonist TO901317 (TO;1 μM) and/or rA-FABP (2 μg ml−1) for 24 h (n=6). Uncropped western blot images are shown in Supplementary Fig. 13. Data are represented as mean±s.e.m. *P<0.05, **P<0.01 (One-way analysis of variance with Bonferroni correction for multiple comparisons). Image collected and cropped by CiteAb from the following open publication (https://pubmed.ncbi.nlm.nih.gov/28128199), licensed under a CC-BY license. Not internally tested by R&D Systems.
Detection of Mouse FABP4/A-FABP by Western Blot
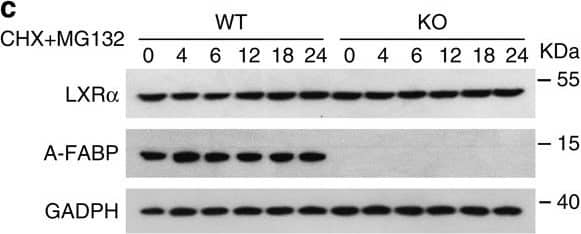
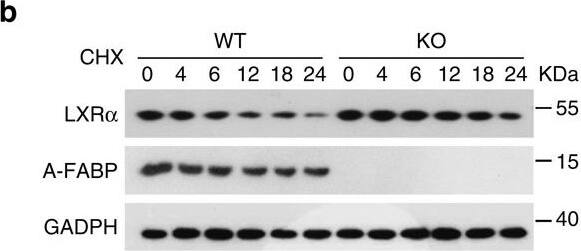
A-FABP accelerates proteasomal degradation of LXR alpha.(a) Primary adipocytes derived from male 6-week-old A-FABP KO mice or WT littermates were treated with actinomycin D (actD, 1 μg ml−1) or vehicle (PBS). The mRNA level of LXR alpha was determined by real-time PCR at time points as indicated (n=4). (b,c) Primary brown adipocytes derived from male 6-week-old A-FABP KO mice or WT littermates were treated with (b) cycloheximide (CHX, 50 μg ml−1) or (c) CHX (50 μg ml−1) together with MG132 (10 μM) for different periods were subjected to immunoblotting using an antibody against LXR alpha, A-FABP and GADPH as indicated (n=4). (d) Primary brown adipocytes derived male 6-week-old A-FABP KO mice or WT littermates were infected with adenovirus overexpressing A-FABP (Ad-AFABP) or luciferase (Ad-Luci) for 48 h, followed by treatment with CHX (50 μg ml−1) for 0,6,12 and 24 h, and then subjected to immunoblotting using an antibody against LXR alpha, A-FABP and GADPH as indicated (n=4). The right panel is the band intensity of LXR alpha normalized with GAPDH, and expressed as percentage relative to baseline (0 h). Uncropped western blot images are shown in Supplementary Fig. 14. Data are represented as mean±s.e.m. *P<0.05, **P<0.01 (Students' t-test). Image collected and cropped by CiteAb from the following open publication (https://pubmed.ncbi.nlm.nih.gov/28128199), licensed under a CC-BY license. Not internally tested by R&D Systems.
Detection of Mouse FABP4/A-FABP by Western Blot
NPGPx is a suppressor of adipogenesis via ROS regulationRelative NPGPx expression assayed by qRT-PCR (left panel) and Western blots (right panel) in the stromal vascular fraction (SVF) and adipocyte fraction isolated from the gonadal fat of C57BL/6 mice (n = 3 per group).Relative NPGPx expression in preadipocytes (Lin−CD34+CD29+Sca1+), endothelial cells (CD31+), macrophages (CD11b+) and adipocytes of adipose tissue measured by in C57BL/6 mice (n = 3 per group).NPGPx, CCAAT/enhancer-binding protein beta (C/EBP beta) and peroxisome proliferator-activated receptor gamma (PPAR gamma) mRNA level during induced 3T3-L1 adipogenesis (n = 5 per group).NPGPx expression assayed by Western blots during 3T3L1 adipogenesis.NBT reduction staining of wild-type SVF cells (WT), NPGPx-knockout SVF cells (KO) and NPGPx-knockout SVF cells expressing human NPGPx (KO + hNPGPx) (left panels). Quantification of NBT reduction stains 8 days after induction (n = 3 per group) (right panels). *p = 0.0002 for WT vs. KO by independent Student's t-test.Oil Red O stain of WT, KO and KO + hNPGPx SVF (left panels). Quantification of Oil Red O stain 8 days after induction (n = 3 per group) (right panels). *p = 0.0002 for WT vs. KO by independent Student's t-test.Western blots showing ap2 and adiponectin expression in WT, KO and KO + hNPGPx SVF cells 8 days after induction.NBT reduction stain of NPGPx knockdown (KD) and control (V) 3T3-L1 preadipocytes after adipogenic induction (left panels). Quantification of NBT reduction stain at day 8 (n = 3 per group) (right panels). *p = 0.0004 by independent Student's t-test.Oil Red O staining of KD and V 3T3-L1 preadipocytes after adipogenic induction (left panels). Quantification of Oil Red O stain at day 8 (n = 3 per group) (right panels). *p = 0.0005 by independent Student's t-test.Western blots showing ap2 and adiponectin expression in NPGPx KD and V 3T3-L1 preadipocytes after adipogenic stimulation.NBT reduction stain and Oil Red O stain of NPGPx KD and V 3T3-L1 cells 8 days after induction. Cells were treated at with NAC at various doses the first 2 days after induction.Quantification of NBT reduction stain and Oil Red O stain in (K) (n = 3 per group).Correlation (R = 0.96) between ROS levels (Rel. NBT staining) and triglyceride contents (Rel. Oil-Red-O staining) in NPGPx KD and V 3T3-L1 cells 8 days after induction.Quantification of Oil Red O staining of NPGPx KD and V 3T3-L1 cells 8 days after induction. Cells were treated with H2O2 at different concentrations the first 2 days after induction (n = 3 per group). *p = 0.006, **p = 0.006, #p < 0.0001, ##p < 0.0001 by independent Student's t-test. All values are presented as means ± S.E.M. Image collected and cropped by CiteAb from the following open publication (https://pubmed.ncbi.nlm.nih.gov/23828861), licensed under a CC-BY license. Not internally tested by R&D Systems.
Detection of Mouse FABP4/A-FABP by Western Blot
A-FABP mediates expression of Dio2 via inhibition of LXR alpha.(a,b) BAT isolated from WT and A-FABP KO mice (a) fed with STC or HFD for 24 weeks or (b) subjected to room temperature (23 °C) or cold exposure (6 °C) for 24 h as indicated in Fig. 2 were subjected to immunoblotting using an antibody against A-FABP, type II iodothyronine deiodinase (D2), liver X receptor alpha (LXR alpha) and beta-tubulin. The bar charts below are the band intensity of each protein relative to beta-tubulin and expressed as arbitrary units, N.D., not detected (n=6). (c,d) The mRNA abundance of A-FABP, Dio2 and LXR alpha in BAT of above WT and A-FABP KO mice (c) fed with STC or HFD for 24 weeks or (d) subjected to cold exposure (6 °C) for 24 h (n=6). (e) The mRNA abundance of A-FABP, LXR alpha and Dio2 in WT or A-FABP-deficient primary brown adipocytes incubated with PBS or recombinant A-FABP (rA-FABP, 2 μg ml−1) for 24 h (n=6). (f) The mRNA abundance of LXR alpha downstream target genes (SCD-1, SREBP-1c) and Dio2 in WT and A-FABP-deficient primary brown adipocytes treated with or without LXR alpha agonist TO901317 (TO;1 μM) and/or rA-FABP (2 μg ml−1) for 24 h (n=6). Uncropped western blot images are shown in Supplementary Fig. 13. Data are represented as mean±s.e.m. *P<0.05, **P<0.01 (One-way analysis of variance with Bonferroni correction for multiple comparisons). Image collected and cropped by CiteAb from the following open publication (https://pubmed.ncbi.nlm.nih.gov/28128199), licensed under a CC-BY license. Not internally tested by R&D Systems.
Detection of Mouse FABP4/A-FABP by Western Blot
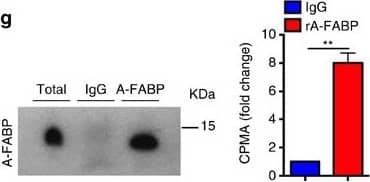
Circulating A-FABP facilitates the uptake of free fatty acid into adipocytes.(a) Circulating A-FABP and (b) FFA profile of male 4-week-old C57BL/6N mice fed with HFD for 24 weeks (n=8). (c) Circulating A-FABP and (d) FFA level of male 8-week-old C57BL/6N mice during cold exposure (6 °C) for 4 h (n=8). (e) Circulating A-FABP and (f) FFA level of male 8-week-old C57BL/6N mice intraperitoneally injected with norepinephrine (NE; 1 mg kg−1) or PBS (vehicle) for 4 h under fasting condition (n=6). (g) Co-immunoprecipitation (Co-IP) of A-FABP and 3H-palmitate in serum of male 8-week-old C57BL/6N mice after administration of 3H-palmitate (2 μCi) for 4 h. Right panel is the 3H-palmitate radioactivity of the co-immunoprecipitated A-FABP protein (n=6). (h,i) 3H-palmitate uptake in BAT and WAT of 8-week-old A-FABP KO mice and their WT littermates infused with PBS or (h) recombinant A-FABP (rA-FABP; 1 μg h−1) or (i) mutant R126Q (1 μg h−1) (n=6). (j) BODIPY-FA uptake in WT or A-FABP-deficient brown adipocytes treated with PBS or rA-FABP (2 μg ml−1) for 10 min (min) (n=6). (k) 3H-palmitate uptake in A-FABP-deficient adipocytes incubated with PBS, bovine serum albumin (BSA; 3 μg ml−1) or rA-FABP (2 μg ml−1) (n=6). (l) In vitro fluorescent imaging analysis of brown adipocytes treated with BODIPY-FA (2 μM) with or without pre-incubation with fluorescent-labelled rA-FABP (2 μg ml−1). Images were taken at 5, 10 and 30 min after treatment. Control image was taken at 30 min in which A-FABP-deficient brown adipocytes were incubated with BODIPY-FA without pre-incubation with rA-FABP. Scale bar, 20 μm, with magnification of 400 × . Representative images from three independent experiments are shown (n=6). (m) Oxygen consumption rate (OCR) and its mean value (lower panel) of A-FABP-deficient brown adipocytes treated with palmitate (PA: 200 nM) with or without pre-incubation with rA-FABP (2 μg ml−1) (n=6). CPMA, count per minutes for beta particles; RFU, relative fluorescence units; OCR, oxygen consumption rate; FCCP, carbonyl cyanide-4-(trifluoromethoxy) phenylhydrazone; R/A, rotenone/antimycin A. Uncropped image for co-immunoprecipitation is shown in Supplementary Fig. 13. Data are represented as mean±s.e.m. *P<0.05, **P<0.01, ***P<0.001 (Student's t-test (a–g), one-way analysis of variance with Bonferroni correction for multiple comparisons (h–k,m)). Image collected and cropped by CiteAb from the following open publication (https://pubmed.ncbi.nlm.nih.gov/28128199), licensed under a CC-BY license. Not internally tested by R&D Systems.
Detection of Mouse FABP4/A-FABP by Western Blot
NPGPx is a suppressor of adipogenesis via ROS regulationRelative NPGPx expression assayed by qRT-PCR (left panel) and Western blots (right panel) in the stromal vascular fraction (SVF) and adipocyte fraction isolated from the gonadal fat of C57BL/6 mice (n = 3 per group).Relative NPGPx expression in preadipocytes (Lin−CD34+CD29+Sca1+), endothelial cells (CD31+), macrophages (CD11b+) and adipocytes of adipose tissue measured by in C57BL/6 mice (n = 3 per group).NPGPx, CCAAT/enhancer-binding protein beta (C/EBP beta) and peroxisome proliferator-activated receptor gamma (PPAR gamma) mRNA level during induced 3T3-L1 adipogenesis (n = 5 per group).NPGPx expression assayed by Western blots during 3T3L1 adipogenesis.NBT reduction staining of wild-type SVF cells (WT), NPGPx-knockout SVF cells (KO) and NPGPx-knockout SVF cells expressing human NPGPx (KO + hNPGPx) (left panels). Quantification of NBT reduction stains 8 days after induction (n = 3 per group) (right panels). *p = 0.0002 for WT vs. KO by independent Student's t-test.Oil Red O stain of WT, KO and KO + hNPGPx SVF (left panels). Quantification of Oil Red O stain 8 days after induction (n = 3 per group) (right panels). *p = 0.0002 for WT vs. KO by independent Student's t-test.Western blots showing ap2 and adiponectin expression in WT, KO and KO + hNPGPx SVF cells 8 days after induction.NBT reduction stain of NPGPx knockdown (KD) and control (V) 3T3-L1 preadipocytes after adipogenic induction (left panels). Quantification of NBT reduction stain at day 8 (n = 3 per group) (right panels). *p = 0.0004 by independent Student's t-test.Oil Red O staining of KD and V 3T3-L1 preadipocytes after adipogenic induction (left panels). Quantification of Oil Red O stain at day 8 (n = 3 per group) (right panels). *p = 0.0005 by independent Student's t-test.Western blots showing ap2 and adiponectin expression in NPGPx KD and V 3T3-L1 preadipocytes after adipogenic stimulation.NBT reduction stain and Oil Red O stain of NPGPx KD and V 3T3-L1 cells 8 days after induction. Cells were treated at with NAC at various doses the first 2 days after induction.Quantification of NBT reduction stain and Oil Red O stain in (K) (n = 3 per group).Correlation (R = 0.96) between ROS levels (Rel. NBT staining) and triglyceride contents (Rel. Oil-Red-O staining) in NPGPx KD and V 3T3-L1 cells 8 days after induction.Quantification of Oil Red O staining of NPGPx KD and V 3T3-L1 cells 8 days after induction. Cells were treated with H2O2 at different concentrations the first 2 days after induction (n = 3 per group). *p = 0.006, **p = 0.006, #p < 0.0001, ##p < 0.0001 by independent Student's t-test. All values are presented as means ± S.E.M. Image collected and cropped by CiteAb from the following open publication (https://pubmed.ncbi.nlm.nih.gov/23828861), licensed under a CC-BY license. Not internally tested by R&D Systems.
Detection of Mouse FABP4/A-FABP by Western Blot
A-FABP accelerates proteasomal degradation of LXR alpha.(a) Primary adipocytes derived from male 6-week-old A-FABP KO mice or WT littermates were treated with actinomycin D (actD, 1 μg ml−1) or vehicle (PBS). The mRNA level of LXR alpha was determined by real-time PCR at time points as indicated (n=4). (b,c) Primary brown adipocytes derived from male 6-week-old A-FABP KO mice or WT littermates were treated with (b) cycloheximide (CHX, 50 μg ml−1) or (c) CHX (50 μg ml−1) together with MG132 (10 μM) for different periods were subjected to immunoblotting using an antibody against LXR alpha, A-FABP and GADPH as indicated (n=4). (d) Primary brown adipocytes derived male 6-week-old A-FABP KO mice or WT littermates were infected with adenovirus overexpressing A-FABP (Ad-AFABP) or luciferase (Ad-Luci) for 48 h, followed by treatment with CHX (50 μg ml−1) for 0,6,12 and 24 h, and then subjected to immunoblotting using an antibody against LXR alpha, A-FABP and GADPH as indicated (n=4). The right panel is the band intensity of LXR alpha normalized with GAPDH, and expressed as percentage relative to baseline (0 h). Uncropped western blot images are shown in Supplementary Fig. 14. Data are represented as mean±s.e.m. *P<0.05, **P<0.01 (Students' t-test). Image collected and cropped by CiteAb from the following open publication (https://pubmed.ncbi.nlm.nih.gov/28128199), licensed under a CC-BY license. Not internally tested by R&D Systems.
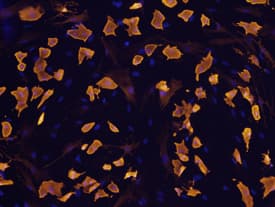
Detection of Mouse FABP4/A-FABP by Immunocytochemistry/ Immunofluorescence
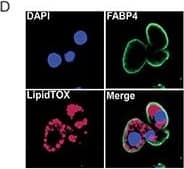
Chemotherapy leads to fat loss in diet induced obese miceA. Weight of epididymal white adipose tissue (eWAT) from LFD, HFD, CY200 and MTX50 treated mice 1 week after last chemotherapy treatment. Each treatment group consisted of 6 mice, showing mean ± SD, data representative of 2 biological replicates. Comparisons by Student's t-test: ns - not significant, * p<0.02, ** p<0.004, *** p<0.002, **** p<0.0007 B. Representative illustration of abdominal cavities measured in (A), showing that large visceral fat deposits (arrows) were reduced post chemotherapy in HFD mice. C. Relative percent frequency of eWAT-associated adipocyte stem-like cells (ASC) in HFD mice treated with MTX12.5 or CY100. Each treatment group consisted of 3 mice, showing mean ± SD, data representative of 2 biological replicates. Statistics as in (A). D. Representative confocal imagery of sorted ASC cultured in adipogenic medium displaying lipid droplets. DAPI (blue)- DNA nuclear stain, FABP4 (green)- lipid transport protein in adipocytes, LipidTOX (red)- neutral lipid stain. Image collected and cropped by CiteAb from the following open publication (https://www.oncotarget.com/lookup/doi/10.18632/oncotarget.14576), licensed under a CC-BY license. Not internally tested by R&D Systems.
Detection of Porcine FABP4/A-FABP by Immunocytochemistry/ Immunofluorescence
In vitro differentiation capacity of young and old BM-MSCs: (A) Representative micrographs from each experimental group showing morphological change after 21 days of differentiation. (B) Results of adipogenic, osteogenic and chondrogenic differentiation. Representative micrographs showing anti-FABP4, Oil Red O, anti-osteocalcin, Alizarin Red-S and anti-aggrecan staining in cultured BM-MSCs from each experimental group. Image collected and cropped by CiteAb from the following open publication (https://pubmed.ncbi.nlm.nih.gov/21992089), licensed under a CC-BY license. Not internally tested by R&D Systems.
Detection of Mouse FABP4/A-FABP by Immunohistochemistry-Frozen
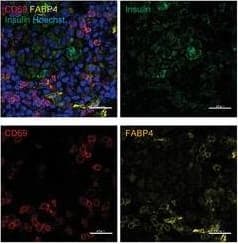
Pancreatic TRM cell recruitment during T1D progression is FABP4‐dependent. G) Representative images of immunofluorescent co‐staining of FABP4, CD69,&insulin in the pancreas of 10‐week‐old NOD mice (Scale bar 20 µm). Image collected & cropped by CiteAb from the following open publication (https://pubmed.ncbi.nlm.nih.gov/38884133), licensed under a CC-BY license. Not internally tested by R&D Systems.

