Detection of Mouse uPAR by Western Blot
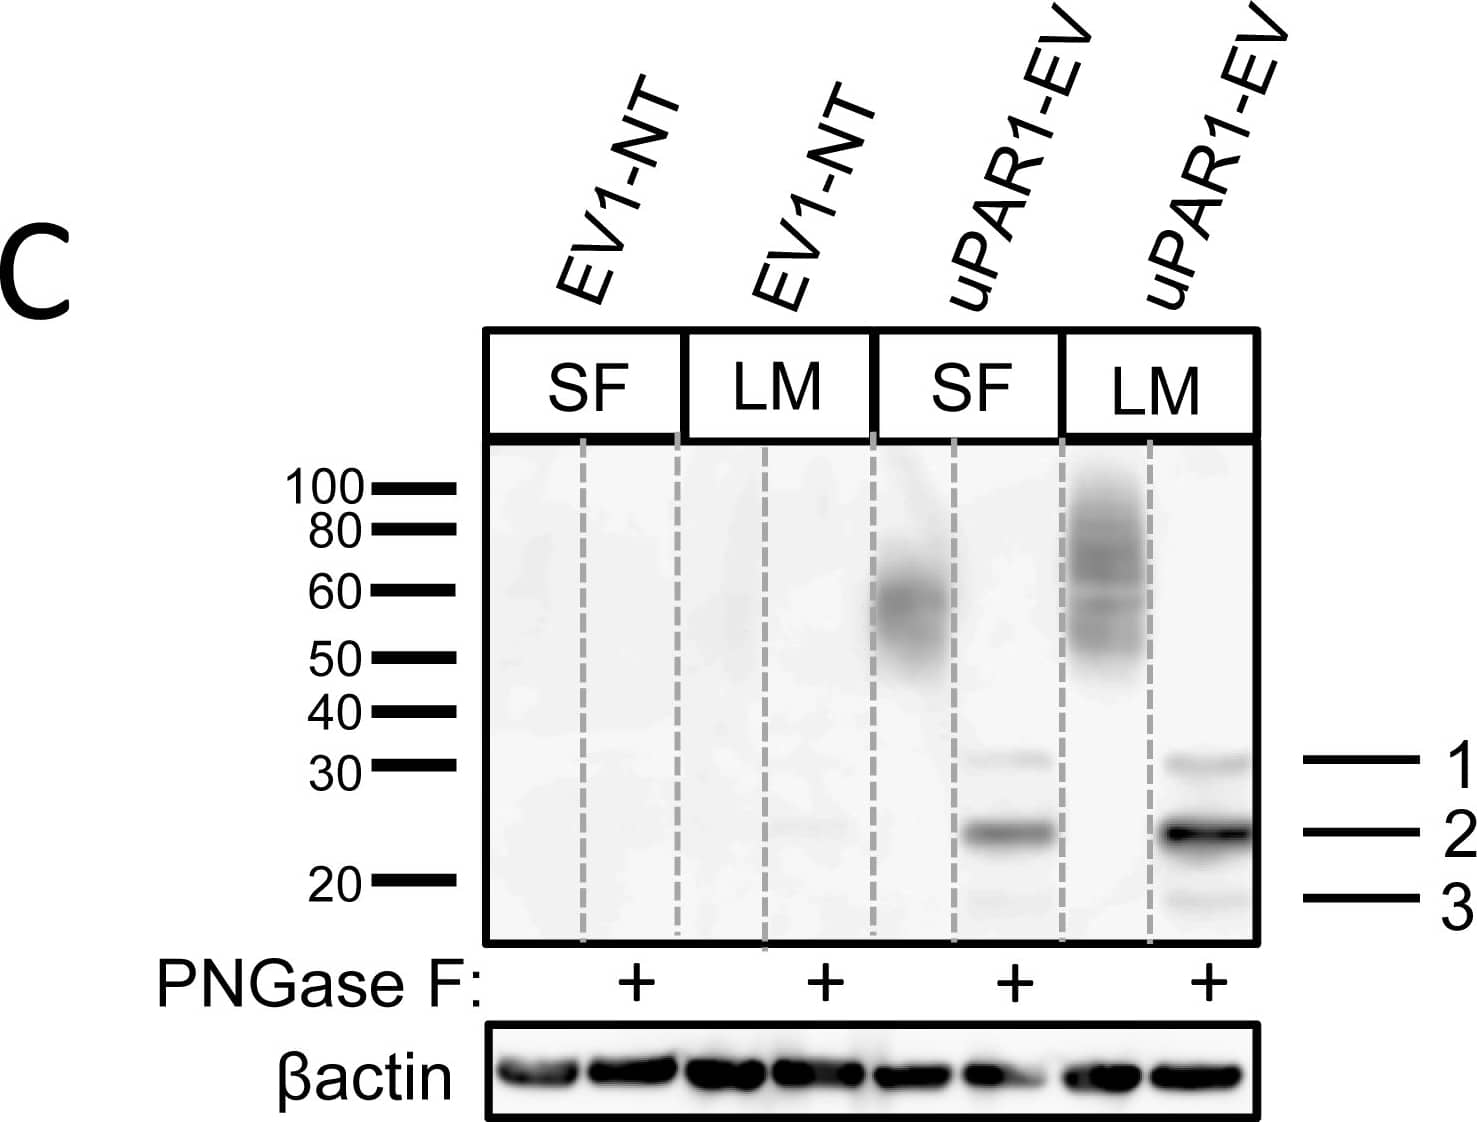
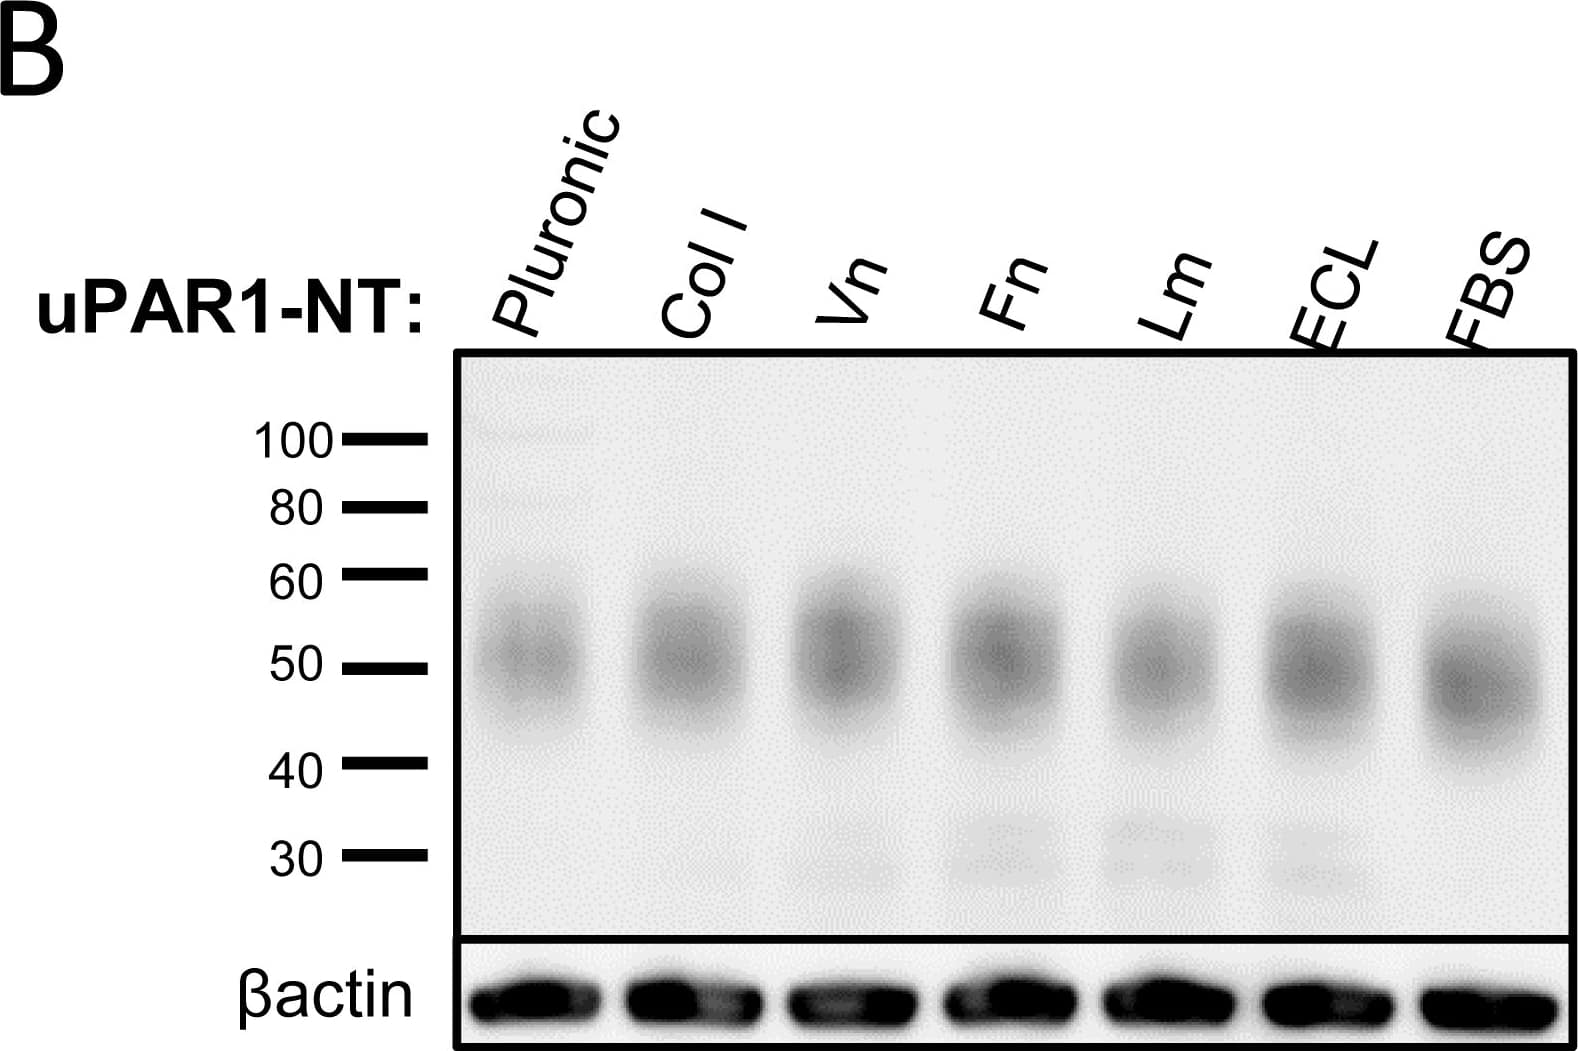
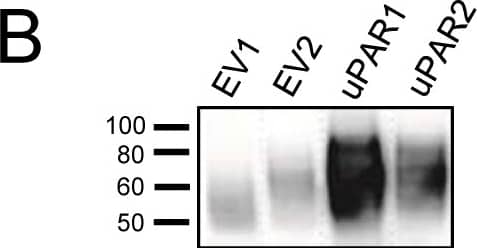
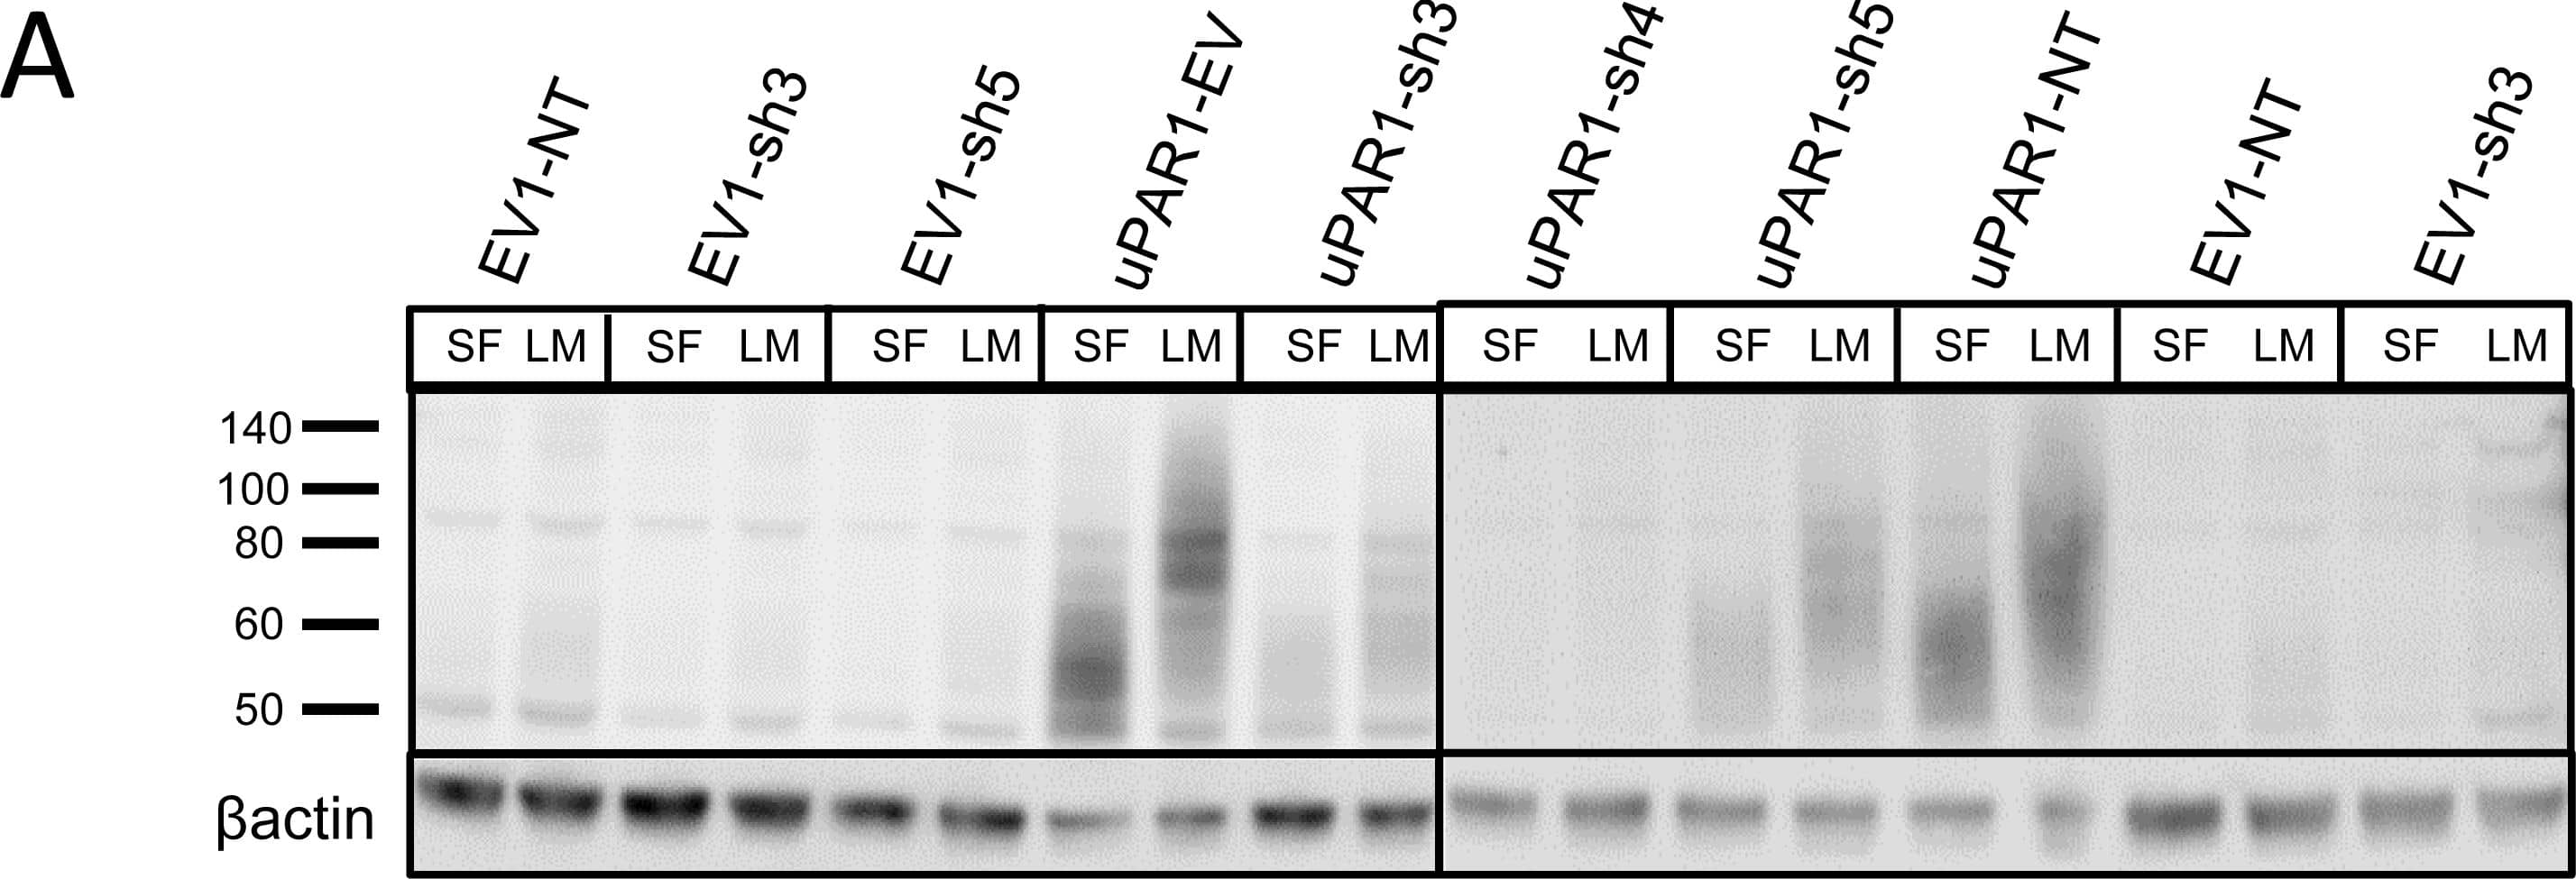
Leiomyoma conditioned medium induced uPAR expression.Analysis of uPAR expression induced by the LCM or purified ECM proteins in cultured uPAR knock-down cells. All Western blots were performed on whole cell lysates, and uPAR was detected using the polyclonal anti-murine uPAR antibody (AF534). A: Cells were either cultured in LCM (LM) or serum free medium (SF) for 24 hours. Cells were harvested with sample buffer and re-probing for beta-actin was used as a loading control. B: uPAR1-NT cells were seeded on different ECM protein substrates, incubated for 24 hours and harvested using RIPA buffer. 7.5 µg of total protein was loaded per lane. Equal loading was verified by re-probing for beta-actin. The poloxamer pluronic was used as a no-adhesion control. Col I = Collagen I, Vn = Vitronectin, Fn = Fibronectin, Lm = Laminin, ECL = Entactin, Collagen, Laminin, and FBS = Foetal Bovine Serum. C: Cells cultured in LCM (LM) or serum free medium (SF) for 24 hours were harvested using sample buffer and deglycosylated by PNGase F treatment (+) as indicated. Re-probing for beta-actin was used as a loading control. The three bands detected by the anti-uPAR antibody are labelled 1, 2, and 3, respectively. Image collected and cropped by CiteAb from the following open publication (https://pubmed.ncbi.nlm.nih.gov/25157856), licensed under a CC-BY license. Not internally tested by R&D Systems.
Detection of Mouse uPAR by Immunohistochemistry
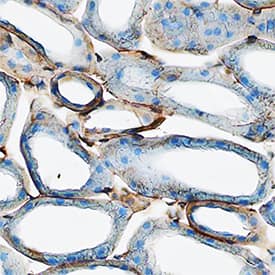
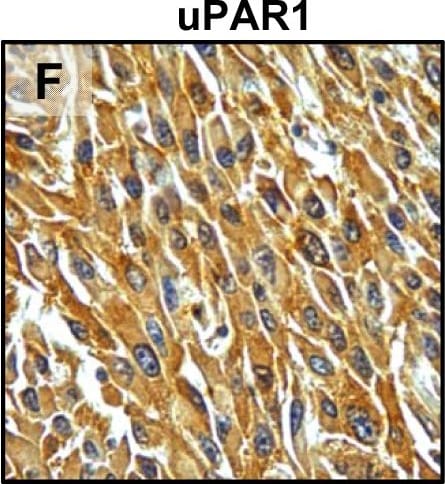
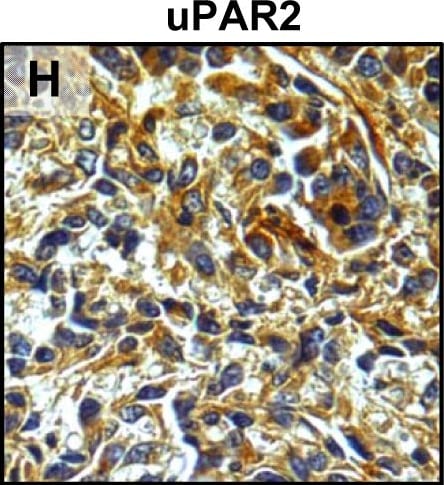
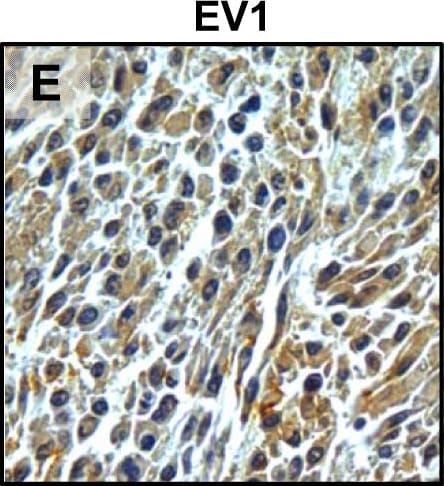
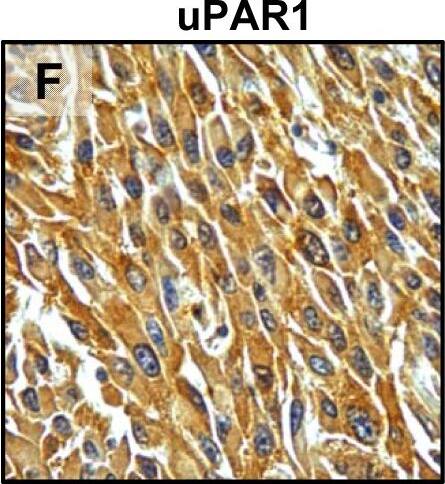
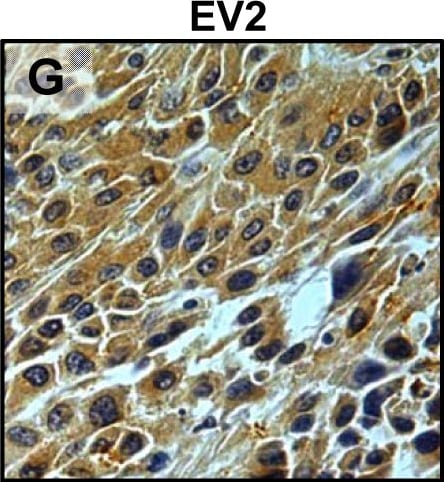
Tumour microenvironment induced uPAR protein expression in tongue tumours.Tumour growth pattern and uPAR protein levels in tongue tumours generated from the EV1, EV2, uPAR1 and uPAR2 cells. A–B: Representative images depicting the tumour growth pattern at the tumour-stroma interface in hematoxylin/eosin stained EV1 (A) and uPAR1 (B) tumours. Images were recorded at 10x magnification. C–D: Representative images depicting the IHC uPAR staining of the EV1 (C) or uPAR1 tumours (D). Images were recorded at 4x magnification. E–H: The images show high power magnification (20x magnifications) of the EV1 (E), uPAR1 (F), EV2 (G) and uPAR2 (H) tumours IHC stained for uPAR protein. Positive uPAR staining is seen as brown colour, and counterstaining was done with haematoxylin. I: The average staining index (SI) of the uPAR staining in the tumours. Maximum obtainable score is 9. The error bars shows the +SEM. N = number of tumours; EV1, N = 8/10; EV2, N = 5/10; uPAR1, N = 4/10; uPAR2 N = 9/10. One-way ANOVA; **p<0.01, *p<0.05. T = Tumours, S = Stroma. Image collected and cropped by CiteAb from the following open publication (https://pubmed.ncbi.nlm.nih.gov/25157856), licensed under a CC-BY license. Not internally tested by R&D Systems.
Detection of Mouse uPAR by Immunohistochemistry
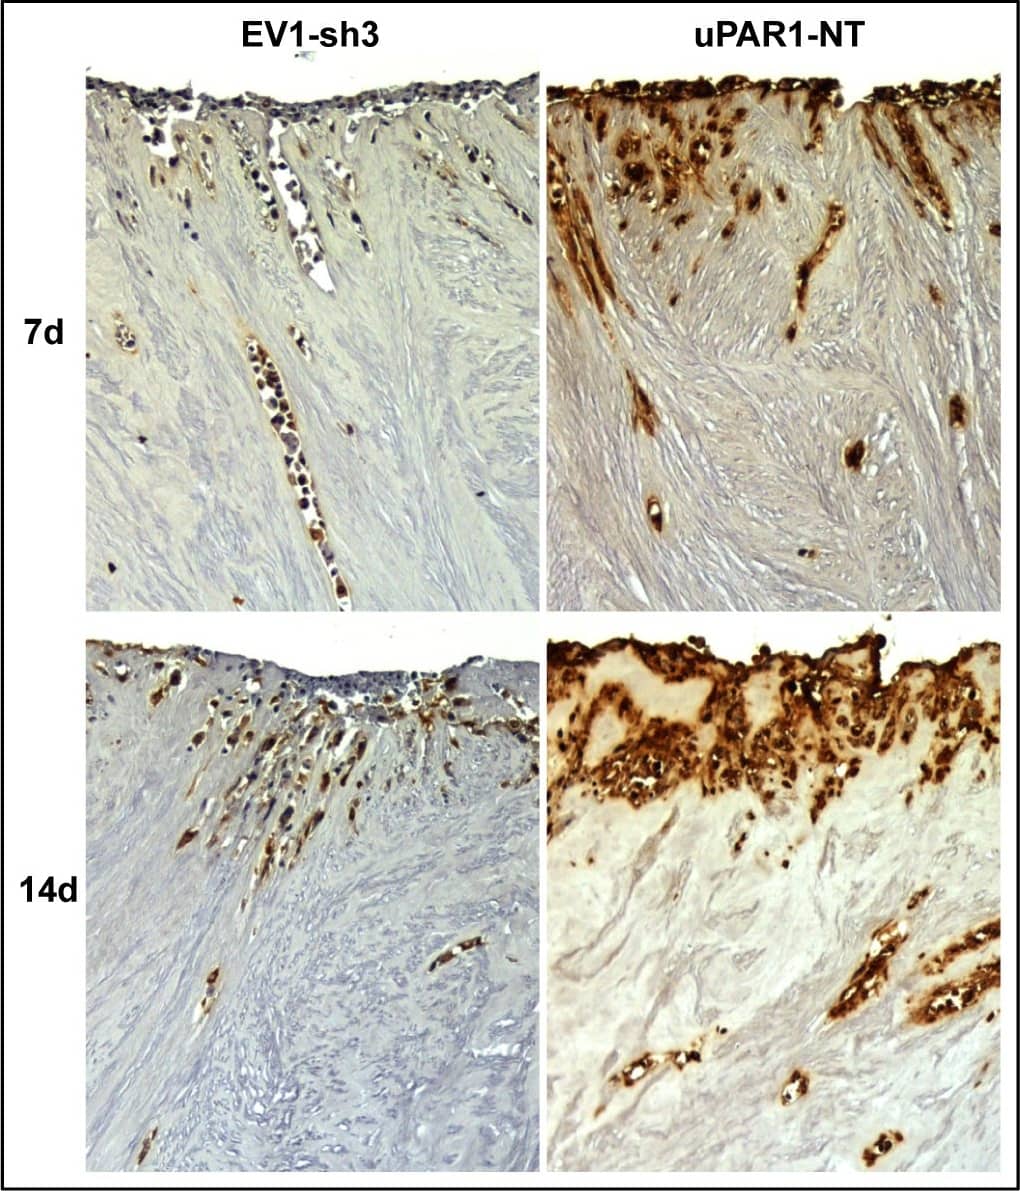
Leiomyoma stroma is a strong inducer of uPAR expression.Representative images of low- (EV1-sh3) and high- (uPAR1-NT) uPAR-expressing cells invading the ex vivo leiomyoma tissue. Cells were incubated for 7 and 14 days, as indicated. The tissue was IHC stained for uPAR. Positive uPAR staining is seen as brown colour, counterstained with haematoxylin. Images were recorded at 10x magnification. Image collected and cropped by CiteAb from the following open publication (https://pubmed.ncbi.nlm.nih.gov/25157856), licensed under a CC-BY license. Not internally tested by R&D Systems.
Detection of Mouse uPAR by Immunohistochemistry
Tumour microenvironment induced uPAR protein expression in tongue tumours.Tumour growth pattern and uPAR protein levels in tongue tumours generated from the EV1, EV2, uPAR1 and uPAR2 cells. A–B: Representative images depicting the tumour growth pattern at the tumour-stroma interface in hematoxylin/eosin stained EV1 (A) and uPAR1 (B) tumours. Images were recorded at 10x magnification. C–D: Representative images depicting the IHC uPAR staining of the EV1 (C) or uPAR1 tumours (D). Images were recorded at 4x magnification. E–H: The images show high power magnification (20x magnifications) of the EV1 (E), uPAR1 (F), EV2 (G) and uPAR2 (H) tumours IHC stained for uPAR protein. Positive uPAR staining is seen as brown colour, and counterstaining was done with haematoxylin. I: The average staining index (SI) of the uPAR staining in the tumours. Maximum obtainable score is 9. The error bars shows the +SEM. N = number of tumours; EV1, N = 8/10; EV2, N = 5/10; uPAR1, N = 4/10; uPAR2 N = 9/10. One-way ANOVA; **p<0.01, *p<0.05. T = Tumours, S = Stroma. Image collected and cropped by CiteAb from the following open publication (https://pubmed.ncbi.nlm.nih.gov/25157856), licensed under a CC-BY license. Not internally tested by R&D Systems.
Detection of Mouse uPAR by Immunohistochemistry
Tumour microenvironment induced uPAR protein expression in tongue tumours.Tumour growth pattern and uPAR protein levels in tongue tumours generated from the EV1, EV2, uPAR1 and uPAR2 cells. A–B: Representative images depicting the tumour growth pattern at the tumour-stroma interface in hematoxylin/eosin stained EV1 (A) and uPAR1 (B) tumours. Images were recorded at 10x magnification. C–D: Representative images depicting the IHC uPAR staining of the EV1 (C) or uPAR1 tumours (D). Images were recorded at 4x magnification. E–H: The images show high power magnification (20x magnifications) of the EV1 (E), uPAR1 (F), EV2 (G) and uPAR2 (H) tumours IHC stained for uPAR protein. Positive uPAR staining is seen as brown colour, and counterstaining was done with haematoxylin. I: The average staining index (SI) of the uPAR staining in the tumours. Maximum obtainable score is 9. The error bars shows the +SEM. N = number of tumours; EV1, N = 8/10; EV2, N = 5/10; uPAR1, N = 4/10; uPAR2 N = 9/10. One-way ANOVA; **p<0.01, *p<0.05. T = Tumours, S = Stroma. Image collected and cropped by CiteAb from the following open publication (https://pubmed.ncbi.nlm.nih.gov/25157856), licensed under a CC-BY license. Not internally tested by R&D Systems.
Detection of Mouse uPAR by Western Blot
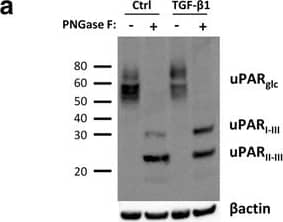
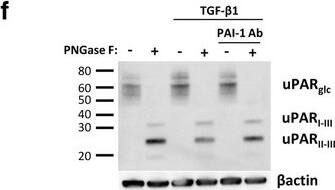
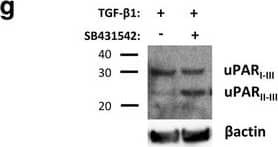
TGF-beta 1 reduces uPAR cleavage through induced PAI-1 expression. a, f-h. Western blot analysis of whole cell lysates of cultured and stimulated AT84-uPAR cells. Where indicated, cell lysates were either treated with PNGase F (+) or samples received the same treatment except that PNGase F was omitted (−). Glycosylated uPAR is indicated as uPARglc. d-e. Western blot analysis of conditioned medium from equally seeded amounts of AT84-EV and AT84-uPAR cells. a. Cells cultured in FBSM with or without 2 ng/ml active human TGF-beta 1 for 24 h. b-c. Total RNA from treated (TGF-beta 1) or untreated (Ctrl) cells was isolated and the relative expression of uPAR mRNA (B) or uPA mRNA (C) was analysed using RT-qPCR. The error bars show the +SD. N = 3. d. Cells cultured in SFM or FBSM and stimulated with 2 ng/ml TGF-beta 1 for 24 h as indicated and PAI-1 protein levels were analysed. Controls received either no additives (−) or the TGF-beta 1 buffer (0). Positive control: recombinant mouse PAI-1 (rmPAI-1). e. AT84-uPAR cells cultured in either SFM or in FBSM. Cells were either unstimulated (−) or stimulated (+) with 2 ng/ml TGF-beta 1 and/or 10 μM of the TGF-beta 1-inhibitor SB431542 as indicated. f. AT84-uPAR cells were cultured for 24 h in FBSM and stimulated with 2 ng/ml TGF-beta 1 as indicated. g. Deglycosylated whole cell lysates from AT84-uPAR cells cultured in SFM stimulated with 2 ng/ml TGF-beta 1 +/− the inhibitor SB431542 as indicated were analysed for uPAR protein levels. h. Cells were cultured for 24- or 48 h in SFM, FBSM or TMEM. Cells were treated with 2 ng/ml TGF-beta 1 in 10% FBS as indicated. The LRP1 protein is indicated. Arrowhead shows an unknown band. Image collected and cropped by CiteAb from the following open publication (https://bmccancer.biomedcentral.com/articles/10.1186/s12885-017-3349-7), licensed under a CC-BY license. Not internally tested by R&D Systems.
Detection of Mouse uPAR by Immunohistochemistry
Tumour microenvironment induced uPAR protein expression in tongue tumours.Tumour growth pattern and uPAR protein levels in tongue tumours generated from the EV1, EV2, uPAR1 and uPAR2 cells. A–B: Representative images depicting the tumour growth pattern at the tumour-stroma interface in hematoxylin/eosin stained EV1 (A) and uPAR1 (B) tumours. Images were recorded at 10x magnification. C–D: Representative images depicting the IHC uPAR staining of the EV1 (C) or uPAR1 tumours (D). Images were recorded at 4x magnification. E–H: The images show high power magnification (20x magnifications) of the EV1 (E), uPAR1 (F), EV2 (G) and uPAR2 (H) tumours IHC stained for uPAR protein. Positive uPAR staining is seen as brown colour, and counterstaining was done with haematoxylin. I: The average staining index (SI) of the uPAR staining in the tumours. Maximum obtainable score is 9. The error bars shows the +SEM. N = number of tumours; EV1, N = 8/10; EV2, N = 5/10; uPAR1, N = 4/10; uPAR2 N = 9/10. One-way ANOVA; **p<0.01, *p<0.05. T = Tumours, S = Stroma. Image collected and cropped by CiteAb from the following open publication (https://pubmed.ncbi.nlm.nih.gov/25157856), licensed under a CC-BY license. Not internally tested by R&D Systems.
Detection of Mouse uPAR by Western Blot
Leiomyoma conditioned medium induced uPAR expression.Analysis of uPAR expression induced by the LCM or purified ECM proteins in cultured uPAR knock-down cells. All Western blots were performed on whole cell lysates, and uPAR was detected using the polyclonal anti-murine uPAR antibody (AF534). A: Cells were either cultured in LCM (LM) or serum free medium (SF) for 24 hours. Cells were harvested with sample buffer and re-probing for beta-actin was used as a loading control. B: uPAR1-NT cells were seeded on different ECM protein substrates, incubated for 24 hours and harvested using RIPA buffer. 7.5 µg of total protein was loaded per lane. Equal loading was verified by re-probing for beta-actin. The poloxamer pluronic was used as a no-adhesion control. Col I = Collagen I, Vn = Vitronectin, Fn = Fibronectin, Lm = Laminin, ECL = Entactin, Collagen, Laminin, and FBS = Foetal Bovine Serum. C: Cells cultured in LCM (LM) or serum free medium (SF) for 24 hours were harvested using sample buffer and deglycosylated by PNGase F treatment (+) as indicated. Re-probing for beta-actin was used as a loading control. The three bands detected by the anti-uPAR antibody are labelled 1, 2, and 3, respectively. Image collected and cropped by CiteAb from the following open publication (https://pubmed.ncbi.nlm.nih.gov/25157856), licensed under a CC-BY license. Not internally tested by R&D Systems.
Detection of Mouse uPAR by Western Blot
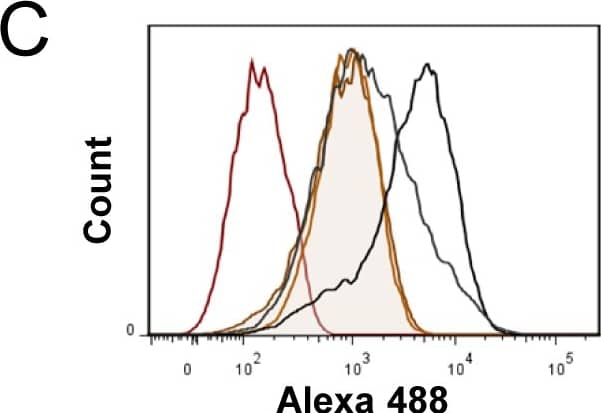
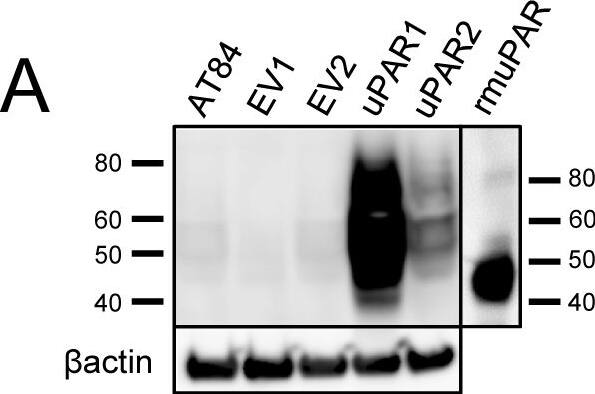
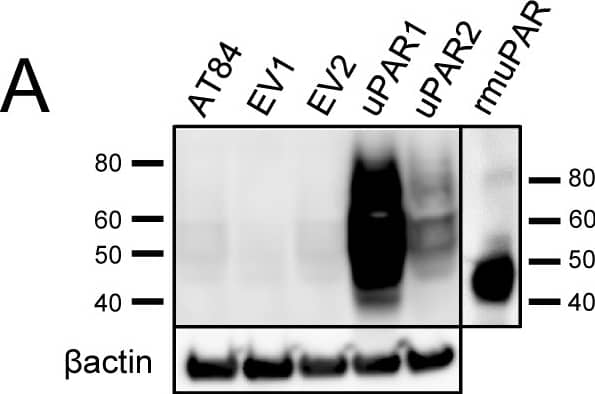
Expression of murine Plaur in AT84 cells.In vitro characterization of AT84 cells stably transfected with either empty vector (EV) or a vector containing cDNA encoding murine uPAR (Plaur). A: Western blot analysis of whole cell lysates using a polyclonal anti-murine uPAR antibody (AF534). A total of 7.5 ng of recombinant murine uPAR (rmuPAR) was loaded as a positive control. Re-probing for beta-actin was used as a loading control. B: Western blot analysis of cellular membrane fractions using a polyclonal anti-murine uPAR antibody (AF534). Total protein was measured per sample and 53.5 µg of protein was loaded per lane. A and B: Images were cropped, as no additional bands were detectable. C: FACS analysis of non-permeabilized cells using a polyclonal anti-murine uPAR antibody (AF534). Alexa Fluor 488 anti-goat secondary antibody (A11055) was used as the secondary antibody. The quantified mean Alexa 488 fluorescence signal per cell line is presented in the panel to the right. D and E: Relative Plaur mRNA (uPAR) (D) or Plau mRNA (uPA) (E) expression levels as analysed using RT-qPCR. All expression levels were normalized to the expression of the reference genes Trfc and beta-actin. Error bars represent the standard error of mean (+SEM) and N = 3. One-way ANOVA; *p<0.05. F: Plasminogen-gelatin (upper panel) and gelatin (lower panel) zymography analysis of conditioned medium of cells cultured for 24 hours in SFM. HMW-uPA and mPLM (mouse plasmin) were loaded as positive controls. The images were cropped to size. G: Relative Plasminogen mRNA (Plg) expression levels as analysed using RT-qPCR. Error bars represent standard error of mean (+SEM) and N = 3. Image collected and cropped by CiteAb from the following open publication (https://pubmed.ncbi.nlm.nih.gov/25157856), licensed under a CC-BY license. Not internally tested by R&D Systems.
Detection of Mouse uPAR by Immunohistochemistry
Tumour microenvironment induced uPAR protein expression in tongue tumours.Tumour growth pattern and uPAR protein levels in tongue tumours generated from the EV1, EV2, uPAR1 and uPAR2 cells. A–B: Representative images depicting the tumour growth pattern at the tumour-stroma interface in hematoxylin/eosin stained EV1 (A) and uPAR1 (B) tumours. Images were recorded at 10x magnification. C–D: Representative images depicting the IHC uPAR staining of the EV1 (C) or uPAR1 tumours (D). Images were recorded at 4x magnification. E–H: The images show high power magnification (20x magnifications) of the EV1 (E), uPAR1 (F), EV2 (G) and uPAR2 (H) tumours IHC stained for uPAR protein. Positive uPAR staining is seen as brown colour, and counterstaining was done with haematoxylin. I: The average staining index (SI) of the uPAR staining in the tumours. Maximum obtainable score is 9. The error bars shows the +SEM. N = number of tumours; EV1, N = 8/10; EV2, N = 5/10; uPAR1, N = 4/10; uPAR2 N = 9/10. One-way ANOVA; **p<0.01, *p<0.05. T = Tumours, S = Stroma. Image collected and cropped by CiteAb from the following open publication (https://pubmed.ncbi.nlm.nih.gov/25157856), licensed under a CC-BY license. Not internally tested by R&D Systems.
Detection of Mouse uPAR by Western Blot
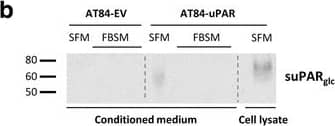
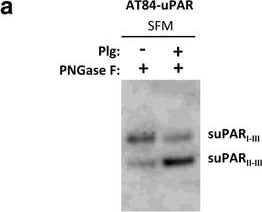
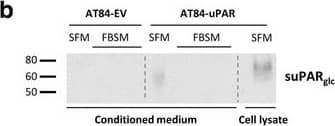
Soluble uPAR shed from mouse OSCC cells induce migration. a-b. Western blot analysis of uPAR protein levels in concentrated conditioned medium from AT84-EV and AT84-uPAR cells. a. Conditioned medium from cells cultured in SFM or SFM containing 10 nM plasminogen (plg) as indicated. The conditioned medium was concentrated from 2 ml to 110 μl for both samples, and deglycosylated using PNGase F. b. Conditioned medium from cells cultured in SFM or in FBSM was concentrated from 2 ml to 350 μl for each sample. A whole cell lysate sample of AT84-uPAR cells was used as a positive control. The two indicated FBSM samples are replicates. Glycosylated suPAR is indicated as suPARglc. c. Non-concentrated conditioned medium from AT84-EV (EV medium) and AT84-uPAR cells (uPAR-medium) was used as an attractant for the AT84-EV cells in a real-time cell migration analysis using the xCELLigence system. N = 3, where each experiment had two technical replicates, and the error bars represent the standard error of mean (±SEM) based on three separate experiments. Image collected and cropped by CiteAb from the following open publication (https://bmccancer.biomedcentral.com/articles/10.1186/s12885-017-3349-7), licensed under a CC-BY license. Not internally tested by R&D Systems.
Detection of Mouse uPAR by Immunohistochemistry
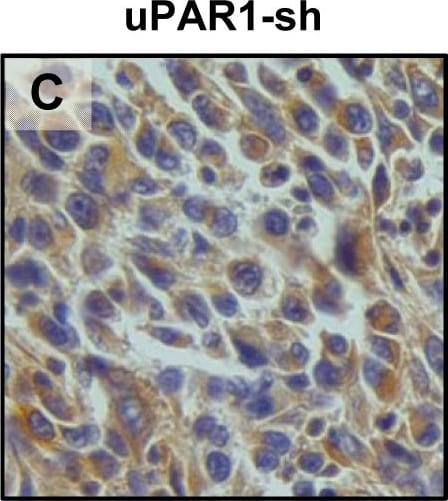
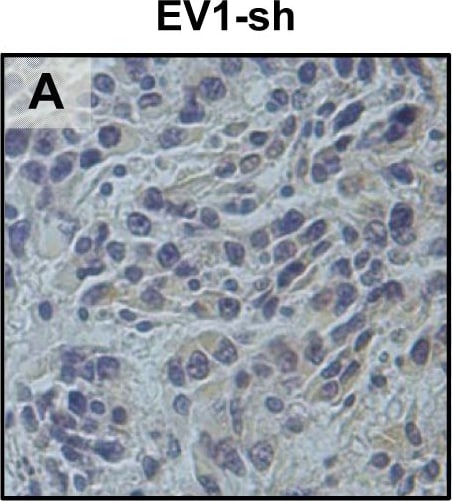
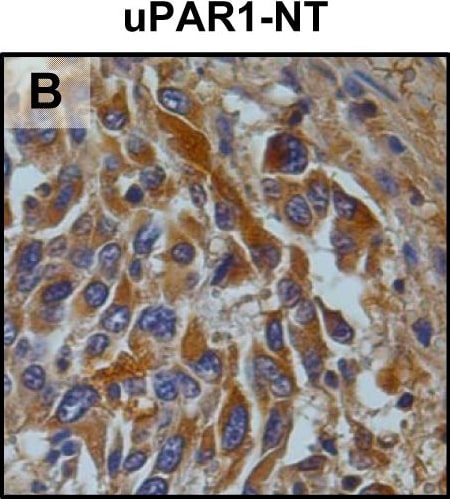
In vivo tongue tumours of EV1 and uPAR1 knock-down cells.IHC uPAR staining and growth pattern of tongue tumours generated from the EV1 and uPAR1 cells containing either shRNA targeting uPAR (EV1-sh and uPAR1-sh), or non-targeting shRNA (uPAR1-NT). A–C: IHC uPAR staining of EV1-sh (A), uPAR1-NT (B) and uPAR1-sh (C) tumours, respectively. Images were recorded at 20x magnifications. D: Representative image depicting the tumour growth pattern at the tumour-stroma interface in hematoxylin/eosin stained EV1-sh. E: The average SI of the uPAR staining in the tumours, with the maximum obtainable score of 9. The error bars shows the +SEM. N = number of tumours; EV1, N = 8/10; EV1-sh, N = 11/16; uPAR1, N = 4/10; uPAR1-NT, N = 3/8; uPAR1-sh, N = 4/16. One-way ANOVA; **p<0.01, *p<0.05. T = Tumour, S = Stroma. Image collected and cropped by CiteAb from the following open publication (https://pubmed.ncbi.nlm.nih.gov/25157856), licensed under a CC-BY license. Not internally tested by R&D Systems.
Detection of Mouse uPAR by Western Blot
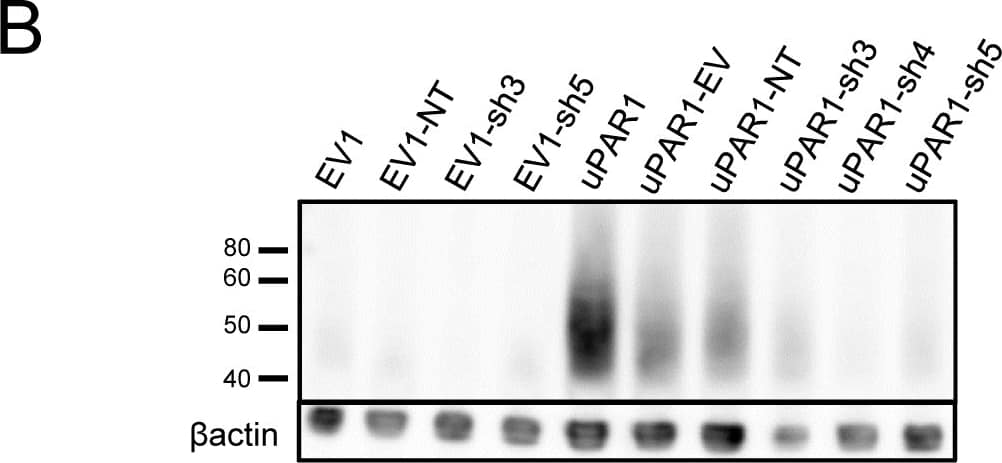
Knock-down of uPAR expression in AT84 cells.shRNA knock-down of Plaur in AT84 cells. A: Flow chart showing the generation of the single cell clones. B: Western blot analysis of whole cell lysates from the single cell clones stably transfected with either shRNA-constructs (shRNA 3 = sh3, shRNA 4 = sh4 or shRNA 5 = sh5) targeting Plaur or constructs containing non-target shRNA (NT) or the empty vector (EV). uPAR was detected using a polyclonal anti-murine uPAR antibody (AF534). Re-probing for beta-actin was used as a loading control. Images were cropped, as no additional bands were detected in the blot. Image collected and cropped by CiteAb from the following open publication (https://pubmed.ncbi.nlm.nih.gov/25157856), licensed under a CC-BY license. Not internally tested by R&D Systems.
Detection of Mouse uPAR by Western Blot
TGF-beta 1 reduces uPAR cleavage through induced PAI-1 expression. a, f-h. Western blot analysis of whole cell lysates of cultured and stimulated AT84-uPAR cells. Where indicated, cell lysates were either treated with PNGase F (+) or samples received the same treatment except that PNGase F was omitted (−). Glycosylated uPAR is indicated as uPARglc. d-e. Western blot analysis of conditioned medium from equally seeded amounts of AT84-EV and AT84-uPAR cells. a. Cells cultured in FBSM with or without 2 ng/ml active human TGF-beta 1 for 24 h. b-c. Total RNA from treated (TGF-beta 1) or untreated (Ctrl) cells was isolated and the relative expression of uPAR mRNA (B) or uPA mRNA (C) was analysed using RT-qPCR. The error bars show the +SD. N = 3. d. Cells cultured in SFM or FBSM and stimulated with 2 ng/ml TGF-beta 1 for 24 h as indicated and PAI-1 protein levels were analysed. Controls received either no additives (−) or the TGF-beta 1 buffer (0). Positive control: recombinant mouse PAI-1 (rmPAI-1). e. AT84-uPAR cells cultured in either SFM or in FBSM. Cells were either unstimulated (−) or stimulated (+) with 2 ng/ml TGF-beta 1 and/or 10 μM of the TGF-beta 1-inhibitor SB431542 as indicated. f. AT84-uPAR cells were cultured for 24 h in FBSM and stimulated with 2 ng/ml TGF-beta 1 as indicated. g. Deglycosylated whole cell lysates from AT84-uPAR cells cultured in SFM stimulated with 2 ng/ml TGF-beta 1 +/− the inhibitor SB431542 as indicated were analysed for uPAR protein levels. h. Cells were cultured for 24- or 48 h in SFM, FBSM or TMEM. Cells were treated with 2 ng/ml TGF-beta 1 in 10% FBS as indicated. The LRP1 protein is indicated. Arrowhead shows an unknown band. Image collected and cropped by CiteAb from the following open publication (https://bmccancer.biomedcentral.com/articles/10.1186/s12885-017-3349-7), licensed under a CC-BY license. Not internally tested by R&D Systems.
Detection of Mouse uPAR by Western Blot
Soluble uPAR shed from mouse OSCC cells induce migration. a-b. Western blot analysis of uPAR protein levels in concentrated conditioned medium from AT84-EV and AT84-uPAR cells. a. Conditioned medium from cells cultured in SFM or SFM containing 10 nM plasminogen (plg) as indicated. The conditioned medium was concentrated from 2 ml to 110 μl for both samples, and deglycosylated using PNGase F. b. Conditioned medium from cells cultured in SFM or in FBSM was concentrated from 2 ml to 350 μl for each sample. A whole cell lysate sample of AT84-uPAR cells was used as a positive control. The two indicated FBSM samples are replicates. Glycosylated suPAR is indicated as suPARglc. c. Non-concentrated conditioned medium from AT84-EV (EV medium) and AT84-uPAR cells (uPAR-medium) was used as an attractant for the AT84-EV cells in a real-time cell migration analysis using the xCELLigence system. N = 3, where each experiment had two technical replicates, and the error bars represent the standard error of mean (±SEM) based on three separate experiments. Image collected and cropped by CiteAb from the following open publication (https://bmccancer.biomedcentral.com/articles/10.1186/s12885-017-3349-7), licensed under a CC-BY license. Not internally tested by R&D Systems.
Detection of Mouse uPAR by Western Blot
Expression of murine Plaur in AT84 cells.In vitro characterization of AT84 cells stably transfected with either empty vector (EV) or a vector containing cDNA encoding murine uPAR (Plaur). A: Western blot analysis of whole cell lysates using a polyclonal anti-murine uPAR antibody (AF534). A total of 7.5 ng of recombinant murine uPAR (rmuPAR) was loaded as a positive control. Re-probing for beta-actin was used as a loading control. B: Western blot analysis of cellular membrane fractions using a polyclonal anti-murine uPAR antibody (AF534). Total protein was measured per sample and 53.5 µg of protein was loaded per lane. A and B: Images were cropped, as no additional bands were detectable. C: FACS analysis of non-permeabilized cells using a polyclonal anti-murine uPAR antibody (AF534). Alexa Fluor 488 anti-goat secondary antibody (A11055) was used as the secondary antibody. The quantified mean Alexa 488 fluorescence signal per cell line is presented in the panel to the right. D and E: Relative Plaur mRNA (uPAR) (D) or Plau mRNA (uPA) (E) expression levels as analysed using RT-qPCR. All expression levels were normalized to the expression of the reference genes Trfc and beta-actin. Error bars represent the standard error of mean (+SEM) and N = 3. One-way ANOVA; *p<0.05. F: Plasminogen-gelatin (upper panel) and gelatin (lower panel) zymography analysis of conditioned medium of cells cultured for 24 hours in SFM. HMW-uPA and mPLM (mouse plasmin) were loaded as positive controls. The images were cropped to size. G: Relative Plasminogen mRNA (Plg) expression levels as analysed using RT-qPCR. Error bars represent standard error of mean (+SEM) and N = 3. Image collected and cropped by CiteAb from the following open publication (https://pubmed.ncbi.nlm.nih.gov/25157856), licensed under a CC-BY license. Not internally tested by R&D Systems.
Detection of Mouse uPAR by Western Blot
Leiomyoma conditioned medium induced uPAR expression.Analysis of uPAR expression induced by the LCM or purified ECM proteins in cultured uPAR knock-down cells. All Western blots were performed on whole cell lysates, and uPAR was detected using the polyclonal anti-murine uPAR antibody (AF534). A: Cells were either cultured in LCM (LM) or serum free medium (SF) for 24 hours. Cells were harvested with sample buffer and re-probing for beta-actin was used as a loading control. B: uPAR1-NT cells were seeded on different ECM protein substrates, incubated for 24 hours and harvested using RIPA buffer. 7.5 µg of total protein was loaded per lane. Equal loading was verified by re-probing for beta-actin. The poloxamer pluronic was used as a no-adhesion control. Col I = Collagen I, Vn = Vitronectin, Fn = Fibronectin, Lm = Laminin, ECL = Entactin, Collagen, Laminin, and FBS = Foetal Bovine Serum. C: Cells cultured in LCM (LM) or serum free medium (SF) for 24 hours were harvested using sample buffer and deglycosylated by PNGase F treatment (+) as indicated. Re-probing for beta-actin was used as a loading control. The three bands detected by the anti-uPAR antibody are labelled 1, 2, and 3, respectively. Image collected and cropped by CiteAb from the following open publication (https://pubmed.ncbi.nlm.nih.gov/25157856), licensed under a CC-BY license. Not internally tested by R&D Systems.
Detection of Mouse uPAR by Immunohistochemistry
In vivo tongue tumours of EV1 and uPAR1 knock-down cells.IHC uPAR staining and growth pattern of tongue tumours generated from the EV1 and uPAR1 cells containing either shRNA targeting uPAR (EV1-sh and uPAR1-sh), or non-targeting shRNA (uPAR1-NT). A–C: IHC uPAR staining of EV1-sh (A), uPAR1-NT (B) and uPAR1-sh (C) tumours, respectively. Images were recorded at 20x magnifications. D: Representative image depicting the tumour growth pattern at the tumour-stroma interface in hematoxylin/eosin stained EV1-sh. E: The average SI of the uPAR staining in the tumours, with the maximum obtainable score of 9. The error bars shows the +SEM. N = number of tumours; EV1, N = 8/10; EV1-sh, N = 11/16; uPAR1, N = 4/10; uPAR1-NT, N = 3/8; uPAR1-sh, N = 4/16. One-way ANOVA; **p<0.01, *p<0.05. T = Tumour, S = Stroma. Image collected and cropped by CiteAb from the following open publication (https://pubmed.ncbi.nlm.nih.gov/25157856), licensed under a CC-BY license. Not internally tested by R&D Systems.
Detection of Mouse uPAR by Western Blot
Expression of murine Plaur in AT84 cells.In vitro characterization of AT84 cells stably transfected with either empty vector (EV) or a vector containing cDNA encoding murine uPAR (Plaur). A: Western blot analysis of whole cell lysates using a polyclonal anti-murine uPAR antibody (AF534). A total of 7.5 ng of recombinant murine uPAR (rmuPAR) was loaded as a positive control. Re-probing for beta-actin was used as a loading control. B: Western blot analysis of cellular membrane fractions using a polyclonal anti-murine uPAR antibody (AF534). Total protein was measured per sample and 53.5 µg of protein was loaded per lane. A and B: Images were cropped, as no additional bands were detectable. C: FACS analysis of non-permeabilized cells using a polyclonal anti-murine uPAR antibody (AF534). Alexa Fluor 488 anti-goat secondary antibody (A11055) was used as the secondary antibody. The quantified mean Alexa 488 fluorescence signal per cell line is presented in the panel to the right. D and E: Relative Plaur mRNA (uPAR) (D) or Plau mRNA (uPA) (E) expression levels as analysed using RT-qPCR. All expression levels were normalized to the expression of the reference genes Trfc and beta-actin. Error bars represent the standard error of mean (+SEM) and N = 3. One-way ANOVA; *p<0.05. F: Plasminogen-gelatin (upper panel) and gelatin (lower panel) zymography analysis of conditioned medium of cells cultured for 24 hours in SFM. HMW-uPA and mPLM (mouse plasmin) were loaded as positive controls. The images were cropped to size. G: Relative Plasminogen mRNA (Plg) expression levels as analysed using RT-qPCR. Error bars represent standard error of mean (+SEM) and N = 3. Image collected and cropped by CiteAb from the following open publication (https://pubmed.ncbi.nlm.nih.gov/25157856), licensed under a CC-BY license. Not internally tested by R&D Systems.
Detection of Mouse Mouse uPAR Antibody by Western Blot
Soluble uPAR shed from mouse OSCC cells induce migration. a-b. Western blot analysis of uPAR protein levels in concentrated conditioned medium from AT84-EV and AT84-uPAR cells. a. Conditioned medium from cells cultured in SFM or SFM containing 10 nM plasminogen (plg) as indicated. The conditioned medium was concentrated from 2 ml to 110 μl for both samples, and deglycosylated using PNGase F. b. Conditioned medium from cells cultured in SFM or in FBSM was concentrated from 2 ml to 350 μl for each sample. A whole cell lysate sample of AT84-uPAR cells was used as a positive control. The two indicated FBSM samples are replicates. Glycosylated suPAR is indicated as suPARglc. c. Non-concentrated conditioned medium from AT84-EV (EV medium) and AT84-uPAR cells (uPAR-medium) was used as an attractant for the AT84-EV cells in a real-time cell migration analysis using the xCELLigence system. N = 3, where each experiment had two technical replicates, and the error bars represent the standard error of mean (±SEM) based on three separate experiments Image collected and cropped by CiteAb from the following publication (https://pubmed.ncbi.nlm.nih.gov/28526008), licensed under a CC-BY license. Not internally tested by R&D Systems.

