Flow Cytometry of A431 Cells Stained with PGC1 alpha Antibody
An intracellular stain was performed on A431 cells with PGC1 alpha Antibody NBP1-04676 (blue) and matched isotype control NBP2-24891 (orange). Cells were fixed with 4% PFA and then permeabilized with 0.1% saponin. Cells were incubated in an antibody dilution of 1.0 ug/mL for 30 minutes at room temperature, followed by Rabbit IgG (H+L) Cross-Adsorbed Secondary Antibody, Dylight 550 (SA5-10033, Thermo Fisher).
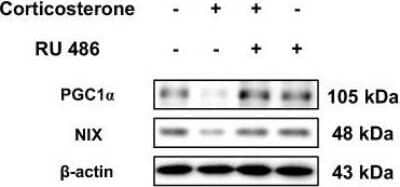
Western Blotting of PGC1 alpha in Vehicle or RU 486 Injected Mice
Vehicle or RU 486 (5 mg/kg) injected mice were presented with/without corticosterone (10 mg/kg) for 3 days. The expressions of peroxisome proliferator-activated receptor gamma coactivator 1-alpha (PGC1 alpha NBP1-04676) and NIX (BNIP3L NBP1-88558) were visualized via western blotting. Loading control is beta-actin. n = 5. Image collected and cropped by CiteAb from the following publication (//pubmed.ncbi.nlm.nih.gov/33473105/) licensed under a CC-BY license.
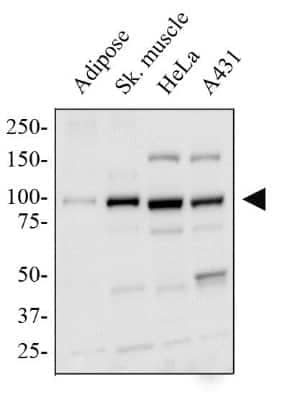
Western Blot Detection of PGC1 alpha in Multiple Tissues and Cell Lines
Total protein from human adipose and skeletal muscle tissue, HeLa and A431 cells lines was separated on a 7.5% gel by SDS-PAGE, transferred to PVDF membrane and blocked in 5% non-fat milk in TBST. The membrane was probed with 2.0 ug/mL PGC1 alpha Antibody (Molecular weight: 91 KDa) in 1% non-fat milk in TBST and detected with an anti-rabbit HRP secondary antibody using chemiluminescence
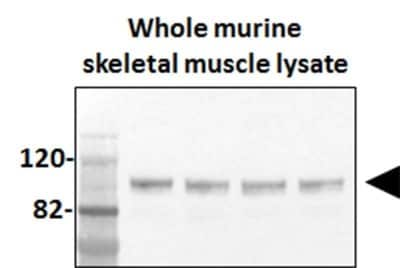
Detection of PGC1 alpha in Murine Skeletal Muscle by Western Blot
Western Blot of total protein from murine skeletal muscle tissue using PGC1 alpha Antibody. Image from verified customer review.
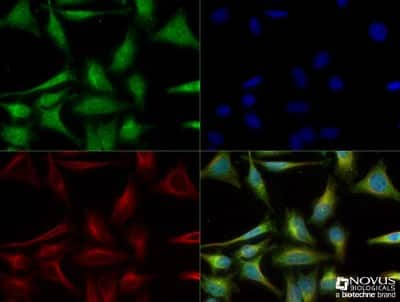
Immunocytochemistry/Immunofluorescence Staining of PGC1 alpha in HeLa Cells
HeLa cells were fixed for 10 minutes using 10% formalin and then permeabilized for 5 minutes using 1X TBS + 0.5% Triton X-100. The cells were incubated with PGC1 alpha Antibody [NBP1-04676] at a 1:200 dilution overnight at 4C and detected with an anti-rabbit DyLight 488 (Green) at a 1:500 dilution. Alpha tubulin (DM1A) [NB100-690] was used as a co-stain at a 1:1000 dilution and detected with an anti-mouse DyLight 550 (Red) at a 1:500 dilution. Nuclei were counterstained with DAPI (Blue). Cells were imaged using a 40X objective.
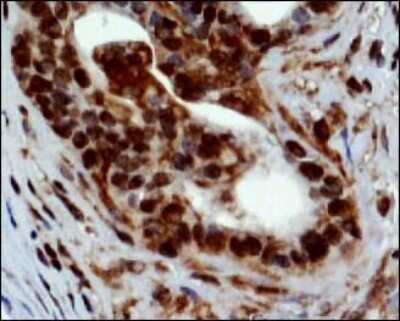
Immunohistological Staining of PGC1 alpha in Paraffin Embedded Mouse Prostate
Analysis of PGC1 alpha Antibody in mouse prostate using DAB with hematoxylin counterstain.
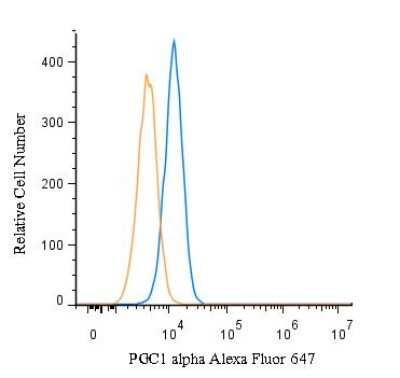
Flow Cytometry of HeLa Cells Stained with Alexa Fluor 647 Conjugated PGC1 alpha Antibody
An intracellular stain was performed on HeLa cells with NBP1-04676AF647 (blue) and a matched isotype control (orange). Cells were fixed with 4% PFA and then permeabilized with 0.1% saponin. Cells were incubated in an antibody dilution of 2.5 ug/mL for 30 minutes at room temperature. Both antibodies were conjugated to Alexa Fluor 647.
Flow Cytometry of HepG2 Cells Stained with PGC1 alpha Antibody
An intracellular stain was performed on HepG2 cells with PGC1 alpha Antibody and a matched isotype control. Cells were fixed with 4% PFA and then permeablized with 0.1% saponin. Cells were incubated in an antibody dilution of 2.5 ug/mL for 30 minutes at room temperature, followed by Rabbit IgG (H+L) Cross-Adsorbed Secondary Antibody.
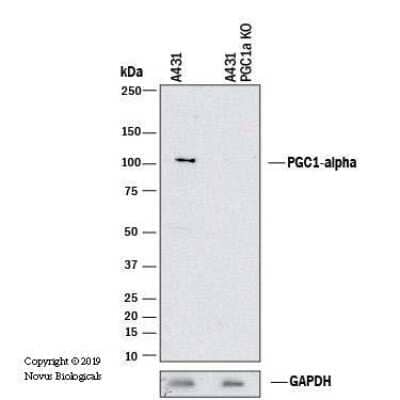
Knockout Validation of PGC1 alpha Antibody in Human Squamous Carcinoma Cells and PGC1 alpha Knockout A431 Cells
Western blot shows lysates of A431 human squamous carcinoma parental cell line and PGC1 alpha knockout (KO) A431 cell line. PVDF membrane was probed with 1:1000 of Rabbit Polyclonal PGC1 alpha Antibody (Catalog # NBP1-04676) followed by HRP-conjugated Anti-Rabbit IgG Secondary Antibody (Catalog #HAF008). Specific band was detected for PGC1 alpha at approximately 105 kDa (as indicated) in the parental A431 cell line, but is not detectable in the knockout A431 cell line. This experiment was conducted under reducing conditions.
Immunocytochemistry/Immunofluorescence: PGC1 alpha Antibody - BSA Free [NBP1-04676] -
DM1-derived fibroblasts have no changes in mitochondria biogenesis. (A, B) Representative images of immunofluorescence of TOMM20, and PGC1-alpha in DM1 and control fibroblasts (n=3). (C) Medium fluorescence intensity of MitoTracker Red FM in control (n=3) and DM1 cells (n=5) and (D) of Rhodamine 123 in DM1 and control fibroblasts (n=3). (E) mRNA levels of TFAM transcription factor (n=3). (F) mRNA levels of OPA1, MFN1, MFN2, DRP1 and PARKIN in DM1 and control fibroblasts (n≥2).
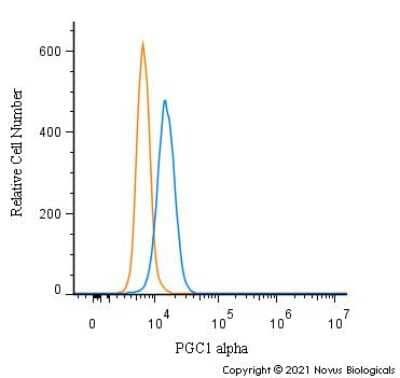
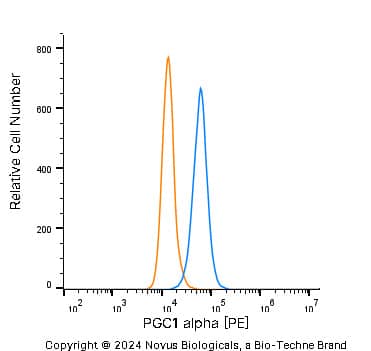
Detection of PGC1 alpha in A431 Human Cell Line by Flow Cytometry.
A431 human skin carcinoma cell line was stained with Rabbit anti-PGC1 alpha Affinity-purified Polyclonal Antibody conjugated to Phycoerythrin (Catalog # NBP1-04676PE, blue histogram) or matched control antibody (Catalog # NBP2-24983, orange histogram).
Western Blot: PGC1 alpha Antibody - BSA Free [NBP1-04676] -
Western Blot: PGC1 alpha Antibody - BSA Free [NBP1-04676] - Effect of butein T on SC adipose tissue browning in the ThermoMouse. SC fat was obtained from ThermoMouse exposed for 4 days to butein (10 or 20 mg/kg; n = 4) or vehicle (n = 2). A BAT lysate of a ThermoMouse was used as a positive control for UCP-1 protein levels. Tissues were homogenized & protein lysates (50 µg for SC fat & 10 µg for BAT) were used in western blotting for PGC1-alpha (a) & UCP-1 (c). Panels (b) & (d) illustrate the densitometric quantitation of the PGC1-alpha & UCP-1 western blot, respectively, normalized for the levels of the loading control alpha-tubulin. Abbreviations: subcutaneous (SC); brown adipose tissue (BAT); peroxisome proliferator-activated receptor-gamma coactivator 1-alpha (PGC1-alpha) & uncoupling protein-1 (UCP-1). Image collected & cropped by CiteAb from the following publication (https://pubmed.ncbi.nlm.nih.gov/31094273), licensed under a CC-BY license. Not internally tested by Novus Biologicals.
Western Blot: PGC1 alpha Antibody - BSA Free [NBP1-04676] -
Western Blot: PGC1 alpha Antibody - BSA Free [NBP1-04676] - Expression of the mitochondrial biogenesis proteins: SIRT1, PGC1 alpha, TFAM & SIRT3 in H1299, H1299r, P31 & P31r cell lysates as determined by immunoblot analysisWhole cell lysates were prepared from confluent cultures of H1299, H1299r, P31 & P31r cells. Proteins (90 μg) were resolved in 10% SDS-PAGE gels & transferred to a PVDF membrane. Blots were probed for SIRT1, PGC1 alpha, TFAM & SIRT3 or the loading control gamma-tubulin. Figure shows representative blots of (A) of SIRT1, (B) PGC1 alpha, (C) SIRT3, (D) TFAM protein expression; each from three independent experiments. Image collected & cropped by CiteAb from the following publication (https://www.oncotarget.com/lookup/doi/10.18632/oncotarget.21885), licensed under a CC-BY license. Not internally tested by Novus Biologicals.
Western Blot: PGC1 alpha Antibody - BSA Free [NBP1-04676] -
Western Blot: PGC1 alpha Antibody - BSA Free [NBP1-04676] - Maternal exercise during pregnancy on mitochondrial biogenesis in the fetal hearts. (A) Levels of relative mRNA expression measured by qRT‐PCR. n = 9–12/group. Maternal exercise during pregnancy did not alter levels of mRNA in Ppargc1a & Tfam, while it significantly upregulated the levels of mRNA in Nrf1 & Nrf2. (B–D) Densitometric analyses of protein expression levels relative to the sedentary group with representative images of western blots were shown. No significant differences in PGC‐1 alpha, NRF1, & NRF2 (P > 0.05). n = 5–6/group. * P < 0.05, significantly different from the sedentary group. Black bar: fetal hearts from sedentary dams; gray bar: fetal hearts from exercised dams. Image collected & cropped by CiteAb from the following publication (https://pubmed.ncbi.nlm.nih.gov/28292876), licensed under a CC-BY license. Not internally tested by Novus Biologicals.
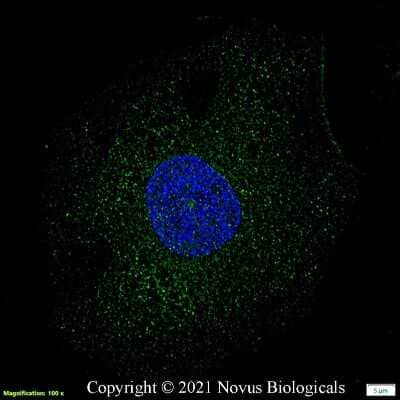
Immunocytochemistry/ Immunofluorescence: PGC1 alpha Antibody - BSA Free [NBP1-04676] -
Immunocytochemistry/ Immunofluorescence: PGC1 alpha Antibody - BSA Free [NBP1-04676] - DM1-derived fibroblasts have no changes in mitochondria biogenesis. (A, B) Representative images of immunofluorescence of TOMM20, & PGC1-alpha in DM1 & control fibroblasts (n=3). (C) Medium fluorescence intensity of MitoTracker Red FM in control (n=3) & DM1 cells (n=5) & (D) of Rhodamine 123 in DM1 & control fibroblasts (n=3). (E) mRNA levels of TFAM transcription factor (n=3). (F) mRNA levels of OPA1, MFN1, MFN2, DRP1 & PARKIN in DM1 & control fibroblasts (n≥2). Image collected & cropped by CiteAb from the following publication (https://pubmed.ncbi.nlm.nih.gov/32310829), licensed under a CC-BY license. Not internally tested by Novus Biologicals.
Western Blot: PGC1 alpha Antibody - BSA Free [NBP1-04676] -
Western Blot: PGC1 alpha Antibody - BSA Free [NBP1-04676] - Effect of BGP-15 treatment on the regulation of mitochondrial biogenesis in NRCM cells. Western blot analysis of PGC-1-alpha, CREB, & VDAC proteins as well as densitometric evaluation is shown. GAPDH was used as a loading control. Control group: cells without any treatment; BGP-15 group: cells with only 50 μM BGP-15 for 0.5 hours; H2O2 group: cells with 150 μM H2O2 for 0.5 hours; H2O2+BGP-15 group: cells with 150 μM H2O2 & 50 μM BGP-15 for 0.5 hours. Values are mean ± SEM (n = 4). ∗p < 0.05 vs. Control, ∗∗p < 0.01 vs. Control, §§p < 0.01 vs H2O2 group. Image collected & cropped by CiteAb from the following publication (https://pubmed.ncbi.nlm.nih.gov/33728024), licensed under a CC-BY license. Not internally tested by Novus Biologicals.
Western Blot: PGC1 alpha Antibody - BSA Free [NBP1-04676] -
Western Blot: PGC1 alpha Antibody - BSA Free [NBP1-04676] - Feeding the diabetes mellitus (DM) mice with the RSV‐enriched diet improved mitochondrial biogenesis in the quadriceps muscle. A) Representative western blots using antibodies against nuclear respiratory factor (NRF‐1), ATP synthase, H+ transporting, mitochondrial F1 complex, beta polypeptide (ATP5B), cytochrome c oxidase subunit IV (Cox IV), peroxisome proliferator‐activated receptor‐ gamma coactivator 1‐ alpha (PGC‐1 alpha), & GAPDH. After quantification, the B) NRF‐1/GAPDH, C) ATP5B/GAPDH, D) Cox IV/GAPDH, & E) PGC‐1 alpha/GAPDH ratios were calculated in mice fed either the control (CTL) or RSV‐enriched diet. GAPDH was used as a loading control. F) Representative western blots using antibodies against mitochondrial transcription factor A (mtTFA) & voltage‐dependent anion channel (VDAC), & the mtTFA/VDAC ratio was determined. The mitochondrial protein VDAC was used as a loading control. Data are expressed as fold change versus CTL & reported as mean ± SD, n = 4–6 per group; *p < 0.05; **p < 0.01 between CTL & DM groups. #p < 0.05 between DM & DM+RSV groups; ††p < 0.05 between CTL+RSV & DM+RSV groups. Image collected & cropped by CiteAb from the following publication (https://pubmed.ncbi.nlm.nih.gov/29578301), licensed under a CC-BY license. Not internally tested by Novus Biologicals.
Western Blot: PGC1 alpha Antibody - BSA Free [NBP1-04676] -
Western Blot: PGC1 alpha Antibody - BSA Free [NBP1-04676] - Effects of SRTAW04 on expression of markers of mitochondrial & anti-oxidant function. (a) Western blot of protein extracts from optic nerve & retina of control (lanes 1–4), MHV-A59 infected (lanes 5–8), & MHV-A59 infected + SRTAW04-treated (lanes 9–12) mice. Average levels of SDHb measured by Western blotting (n = 4/group) showed a significant (*p < 0.05) decrease in protein extracts from optic nerves (a,b) & retinas (a,d) of MHV-A59 infected mice 7 days post-inoculation, compared to control mice. MHV-A59 infected mice treated with SRTAW04 (100 mg/kg/day) showed a significant increase (@p < 0.05) of SDHb protein expression compared to untreated MHV-A59 infected mice. There is a significant decrease (*p < 0.05) in expression of SOD2 (n = 4/group) in optic nerves (a,c) & retinas (a,e) of MHV-A59 infected mice compared to control mice, & treatment with SRTAW04 significantly (@p < 0.05) attenuates that change. PGC1-alpha expression shows a significant (*p < 0.05) decrease in retinas (a,f) (n = 4/group) during MHV-A59 infection & treatment with SRTAW04 for 7 days significantly (@p < 0.05) increases the PGC1-alpha protein levels. Image collected & cropped by CiteAb from the following publication (https://pubmed.ncbi.nlm.nih.gov/24383546), licensed under a CC-BY license. Not internally tested by Novus Biologicals.
Western Blot: PGC1 alpha Antibody - BSA Free [NBP1-04676] -
Western Blot: PGC1 alpha Antibody - BSA Free [NBP1-04676] - RSV treatment increases markers of mitochondrial function in stressed RGC-5 cells. Staurosporine-differentiated RGC-5 cells were cultured with or without 500 μM H2O2, & with or without 0.25 μM RSV for 24 h. (A) Western blot analysis shows a significant decrease in SDH expression (**p < 0.01) during H2O2 treatment which is attenuated by treatment with RSV (*p < 0.05). (B) Western blot analysis shows similar effects on SOD2 expression. The significant decrease (**p < 0.01) during H2O2 treatment, compared to controls, is not found in cells treated with RSV (*p < 0.05). (C) Protein extracts were immunoprecipitated with anti-PGC-1 alpha antibodies, blotted, & hybridized with anti-PGC-1 alpha & anti-acetylated lysine antibodies to assess the acetylation state of PGC-1 alpha. H2O2 treatment significantly increases the proportion of acetylated PGC-1 alpha (*p < 0.05) compared to controls, & RSV & SRTAW04 treatment each prevent this acetylation (*p < 0.05). Image collected & cropped by CiteAb from the following publication (https://pubmed.ncbi.nlm.nih.gov/23293585), licensed under a CC-BY license. Not internally tested by Novus Biologicals.
Western Blot: PGC1 alpha Antibody - BSA Free [NBP1-04676] -
Western Blot: PGC1 alpha Antibody - BSA Free [NBP1-04676] - Pequi extract increases expression of antioxidant enzymes in HCAEC. Cells were cultured, pre-treated with pequi extract (25 μg/mL) for 24 h under normoxia conditions, & total protein content was extracted for Western blots analysis for Superoxide dismutase (SOD)-1 (A), SOD-2 (B), catalase (C), glutathione peroxidase—GPx (D), sirtuin 1—SIRT-1 (E), peroxisome-proliferator-activated receptor gamma coactivator 1-alpha (PCG1-alpha) (F), glycogen synthase kinase 3 beta (GSK3 beta) (G), & microtubule-associated protein 1A/1B-light chain 3 (LC3) (H). Western blots were normalized using alpha-tubulin or glyceraldehyde 3-phosphate dehydrogenase (GAPDH) as loading control. Five independent Western blot experiments were carried for each condition. Representative images are shown here. Statistical analysis was performed using Student’s t-test (p < 0.05). OD: Optical Density. Image collected & cropped by CiteAb from the following publication (https://pubmed.ncbi.nlm.nih.gov/35326129), licensed under a CC-BY license. Not internally tested by Novus Biologicals.
Immunocytochemistry/ Immunofluorescence: PGC1 alpha Antibody - BSA Free [NBP1-04676] -
Immunocytochemistry/ Immunofluorescence: PGC1 alpha Antibody - BSA Free [NBP1-04676] - Role of PGC1 alpha in NIX-dependent mitophagy.a–e Nontargeting (NT) or GR siRNA was transfected to hippocampal neurons & SH-SY5Y cells for 24 h prior to corticosterone & cortisol for 12 h, respectively. a, b Peroxisome proliferator-activated receptor gamma coactivator 1-alpha (PGC1 alpha) expression was detected in western blot where beta-actin was used as a loading control in both cell types. n = 5. c Colocalization of PGC1 alpha (red) & DAPI (blue) in hippocampal neurons was visualized with SRRF imaging system. Scale bars, 20 μm (magnification, ×1000). n = 5. d Colocalization of PGC1 alpha (green) & DAPI (blue) in SH-SY5Y was visualized with SRRF imaging system. Scale bars, 20 μm (magnification, ×1000). n = 5. e PGC1 alpha protein expressions in subcellular fraction samples were detected by western blotting. Lamin A/C & alpha-tubulin were used as a nuclear & cytosolic loading control, respectively. n = 5. f, g SH-SY5Y cells were transfected with pcDNA3.1/c-eGFP or pcDNA3.1/PPARGC1A-c-eGFP vector for 24 h prior to cortisol treatment for 24 h. f NIX expression was detected in western blot where beta-actin was used as a loading control. n = 5. g TOMM20 levels were detected by western blot. Loading control for western blot is beta-actin. n = 5. All blots & immunofluorescence images are representative. n = 5 from independent experiments with two technical replicates each. Quantitative data are presented as a mean ± S.E.M. Two-sided two-way ANOVA was conducted. ** indicates p < 0.01 versus control. #, ## indicates p < 0.05, p < 0.01 versus corticosterone in hippocampal neurons & cortisol in SH-SY5Y, respectively. Data are provided as a Source data file. Image collected & cropped by CiteAb from the following publication (https://pubmed.ncbi.nlm.nih.gov/33473105), licensed under a CC-BY license. Not internally tested by Novus Biologicals.
Western Blot: PGC1 alpha Antibody - BSA Free [NBP1-04676] -
Western Blot: PGC1 alpha Antibody - BSA Free [NBP1-04676] - Role of PGC1 alpha in NIX-dependent mitophagy.a–e Nontargeting (NT) or GR siRNA was transfected to hippocampal neurons & SH-SY5Y cells for 24 h prior to corticosterone & cortisol for 12 h, respectively. a, b Peroxisome proliferator-activated receptor gamma coactivator 1-alpha (PGC1 alpha) expression was detected in western blot where beta-actin was used as a loading control in both cell types. n = 5. c Colocalization of PGC1 alpha (red) & DAPI (blue) in hippocampal neurons was visualized with SRRF imaging system. Scale bars, 20 μm (magnification, ×1000). n = 5. d Colocalization of PGC1 alpha (green) & DAPI (blue) in SH-SY5Y was visualized with SRRF imaging system. Scale bars, 20 μm (magnification, ×1000). n = 5. e PGC1 alpha protein expressions in subcellular fraction samples were detected by western blotting. Lamin A/C & alpha-tubulin were used as a nuclear & cytosolic loading control, respectively. n = 5. f, g SH-SY5Y cells were transfected with pcDNA3.1/c-eGFP or pcDNA3.1/PPARGC1A-c-eGFP vector for 24 h prior to cortisol treatment for 24 h. f NIX expression was detected in western blot where beta-actin was used as a loading control. n = 5. g TOMM20 levels were detected by western blot. Loading control for western blot is beta-actin. n = 5. All blots & immunofluorescence images are representative. n = 5 from independent experiments with two technical replicates each. Quantitative data are presented as a mean ± S.E.M. Two-sided two-way ANOVA was conducted. ** indicates p < 0.01 versus control. #, ## indicates p < 0.05, p < 0.01 versus corticosterone in hippocampal neurons & cortisol in SH-SY5Y, respectively. Data are provided as a Source data file. Image collected & cropped by CiteAb from the following publication (https://pubmed.ncbi.nlm.nih.gov/33473105), licensed under a CC-BY license. Not internally tested by Novus Biologicals.
Western Blot: PGC1 alpha Antibody - BSA Free [NBP1-04676] -
Western Blot: PGC1 alpha Antibody - BSA Free [NBP1-04676] - EMPA treatment increased mitochondrial biogenesis. (A) Left, Transmission electron microscopy showing the morphology of mitochondria in sham, sham + EMPA, TAC & TAC + EMPA groups & Right, quantitative analysis of mitochondrial size & counts. Results are expressed as mean ± SEM, n = 3–5, *p < 0.05 vs. corresponding sham, †p < 0.05 vs. corresponding TAC. (B) Left, Representative blots of mitochondrial biogenesis-related proteins & Right, quantitative results. (C) Relative mRNA levels of PGC1 alpha, NRF1, TFAM & COX1. Results are expressed as mean ± SEM, n = 5–7, *p < 0.05 vs. corresponding sham group, †p < 0.05 vs. corresponding TAC vehicle group. One-way ANOVA & Tukey post hoc test. EMPA, empagliflozin; SEM, standard error of the mean; TAC, transverse aortic constriction; PGC1-alpha, peroxisome proliferator-activated receptor gamma coactivator 1-alpha; NRF-1, nuclear respiratory factor 1; TFAM, mitochondrial transcription factor A; COX1, cyclooxygenase1; GAPDH, glyceraldehyde 3-phosphate dehydrogenase. Image collected & cropped by CiteAb from the following publication (https://pubmed.ncbi.nlm.nih.gov/35647080), licensed under a CC-BY license. Not internally tested by Novus Biologicals.
Immunocytochemistry/ Immunofluorescence: PGC1 alpha Antibody - BSA Free [NBP1-04676] -
Immunocytochemistry/ Immunofluorescence: PGC1 alpha Antibody - BSA Free [NBP1-04676] - Role of PGC1 alpha in NIX-dependent mitophagy.a–e Nontargeting (NT) or GR siRNA was transfected to hippocampal neurons & SH-SY5Y cells for 24 h prior to corticosterone & cortisol for 12 h, respectively. a, b Peroxisome proliferator-activated receptor gamma coactivator 1-alpha (PGC1 alpha) expression was detected in western blot where beta-actin was used as a loading control in both cell types. n = 5. c Colocalization of PGC1 alpha (red) & DAPI (blue) in hippocampal neurons was visualized with SRRF imaging system. Scale bars, 20 μm (magnification, ×1000). n = 5. d Colocalization of PGC1 alpha (green) & DAPI (blue) in SH-SY5Y was visualized with SRRF imaging system. Scale bars, 20 μm (magnification, ×1000). n = 5. e PGC1 alpha protein expressions in subcellular fraction samples were detected by western blotting. Lamin A/C & alpha-tubulin were used as a nuclear & cytosolic loading control, respectively. n = 5. f, g SH-SY5Y cells were transfected with pcDNA3.1/c-eGFP or pcDNA3.1/PPARGC1A-c-eGFP vector for 24 h prior to cortisol treatment for 24 h. f NIX expression was detected in western blot where beta-actin was used as a loading control. n = 5. g TOMM20 levels were detected by western blot. Loading control for western blot is beta-actin. n = 5. All blots & immunofluorescence images are representative. n = 5 from independent experiments with two technical replicates each. Quantitative data are presented as a mean ± S.E.M. Two-sided two-way ANOVA was conducted. ** indicates p < 0.01 versus control. #, ## indicates p < 0.05, p < 0.01 versus corticosterone in hippocampal neurons & cortisol in SH-SY5Y, respectively. Data are provided as a Source data file. Image collected & cropped by CiteAb from the following publication (https://pubmed.ncbi.nlm.nih.gov/33473105), licensed under a CC-BY license. Not internally tested by Novus Biologicals.
Western Blot: PGC1 alpha Antibody - BSA Free [NBP1-04676] -
Western Blot: PGC1 alpha Antibody - BSA Free [NBP1-04676] - Role of PGC1 alpha in NIX-dependent mitophagy.a–e Nontargeting (NT) or GR siRNA was transfected to hippocampal neurons & SH-SY5Y cells for 24 h prior to corticosterone & cortisol for 12 h, respectively. a, b Peroxisome proliferator-activated receptor gamma coactivator 1-alpha (PGC1 alpha) expression was detected in western blot where beta-actin was used as a loading control in both cell types. n = 5. c Colocalization of PGC1 alpha (red) & DAPI (blue) in hippocampal neurons was visualized with SRRF imaging system. Scale bars, 20 μm (magnification, ×1000). n = 5. d Colocalization of PGC1 alpha (green) & DAPI (blue) in SH-SY5Y was visualized with SRRF imaging system. Scale bars, 20 μm (magnification, ×1000). n = 5. e PGC1 alpha protein expressions in subcellular fraction samples were detected by western blotting. Lamin A/C & alpha-tubulin were used as a nuclear & cytosolic loading control, respectively. n = 5. f, g SH-SY5Y cells were transfected with pcDNA3.1/c-eGFP or pcDNA3.1/PPARGC1A-c-eGFP vector for 24 h prior to cortisol treatment for 24 h. f NIX expression was detected in western blot where beta-actin was used as a loading control. n = 5. g TOMM20 levels were detected by western blot. Loading control for western blot is beta-actin. n = 5. All blots & immunofluorescence images are representative. n = 5 from independent experiments with two technical replicates each. Quantitative data are presented as a mean ± S.E.M. Two-sided two-way ANOVA was conducted. ** indicates p < 0.01 versus control. #, ## indicates p < 0.05, p < 0.01 versus corticosterone in hippocampal neurons & cortisol in SH-SY5Y, respectively. Data are provided as a Source data file. Image collected & cropped by CiteAb from the following publication (https://pubmed.ncbi.nlm.nih.gov/33473105), licensed under a CC-BY license. Not internally tested by Novus Biologicals.
Western Blot: PGC1 alpha Antibody - BSA Free [NBP1-04676] -
Western Blot: PGC1 alpha Antibody - BSA Free [NBP1-04676] - Mitochondrial content & PGC‐1 alpha levels are increased in cells with greater TFEB protein expression. (a) Mitochondrial content was measured in SH‐SY5Y cells & TFEB‐DDK cells under basal conditions by assaying citrate synthase (CS) activity. **p < 0.01 versus SH‐SY5Y; n = 6. (b) Western blotting for the mitochondrial proteins prohibitin 1 & cytochrome oxidase (COX) subunit IV also indicated that mitochondrial content was increased in TFEB‐DDK cells. (c) PGC‐1 alpha mRNA levels were measured in SH‐SY5Y cells & TFEB‐DDK cells under basal conditions by qPCR. Data normalised against beta‐actin mRNA levels. **p < 0.01 versus SH‐SY5Y cells; n = 3. (d) SH‐SY5Y cells were treated with scrambled (scram) or TFEB siRNA for 72 h & PGC‐1 alpha mRNA levels measured. *p < 0.05 versus scram; n = 4. (e) PGC‐1 alpha protein levels were detected by western blotting in total cell lysates of SH‐SY5Y cells, TFEB‐DDK cells & a SH‐SY5Y cell line over‐expressing human PGC‐1 alpha. The fold increase in PGC‐1 alpha protein density for this blot & PGC‐1 alpha mRNA levels of the respective cell lines are reported underneath the blot. (f) TFEB‐DDK cells were treated with 10 μM carbonyl cyanide m‐chlorophenylhydrazone (CCCP) for 18 h & cytosolic & nuclear fractions prepared. PGC‐1 alpha protein was detected in cytosolic (3.5% of total volume) & nuclear fractions (35% of total volume) by western blotting. The purity of the nuclear & cytosolic fractions was assessed by western blotting using lamin A & beta‐actin antibodies respectively. Image collected & cropped by CiteAb from the following publication (https://pubmed.ncbi.nlm.nih.gov/26509433), licensed under a CC-BY license. Not internally tested by Novus Biologicals.
Western Blot: PGC1 alpha Antibody - BSA Free [NBP1-04676] -
Western Blot: PGC1 alpha Antibody - BSA Free [NBP1-04676] - PGC1 alpha & HNF4 alpha interacts & binds to Vnn1 promoter in IUGR asthmatic mice. Asthma was induced with OVA in IUGR mice. PBS induction was used as the control. Nuclear protein was extracted from lung tissues. (A) Immunoblot assay was performed for expressions of PGC1 alpha & HNF4 alpha. (B) IP was performed using mouse anti-HNF4 alpha antibody & Protein G-coupled agarose beads, followed by immunoblot with rabbit-anti-PGC1 alpha antibody. The normal mouse IgG was used as the IP control. (C) In primary cultured bronchial epithelia cells isolated from IUGR mice injected with OVA or PBS, ChIP assay was performed using mouse anti-HNF4 alpha or rabbit anti-PGC1 alpha antibodies. The normal mouse or rabbit IgG was used as the control. Graphics show the percentage of total DNA immunoprecipitated by each indicated antibody. Data are shown as mean±s.d. n=4. *P<0.01 OVA versus PBS. Image collected & cropped by CiteAb from the following publication (https://pubmed.ncbi.nlm.nih.gov/32139393), licensed under a CC-BY license. Not internally tested by Novus Biologicals.
Western Blot: PGC1 alpha Antibody - BSA Free [NBP1-04676] -
Western Blot: PGC1 alpha Antibody - BSA Free [NBP1-04676] - Role of PGC1 alpha in NIX-dependent mitophagy.a–e Nontargeting (NT) or GR siRNA was transfected to hippocampal neurons & SH-SY5Y cells for 24 h prior to corticosterone & cortisol for 12 h, respectively. a, b Peroxisome proliferator-activated receptor gamma coactivator 1-alpha (PGC1 alpha) expression was detected in western blot where beta-actin was used as a loading control in both cell types. n = 5. c Colocalization of PGC1 alpha (red) & DAPI (blue) in hippocampal neurons was visualized with SRRF imaging system. Scale bars, 20 μm (magnification, ×1000). n = 5. d Colocalization of PGC1 alpha (green) & DAPI (blue) in SH-SY5Y was visualized with SRRF imaging system. Scale bars, 20 μm (magnification, ×1000). n = 5. e PGC1 alpha protein expressions in subcellular fraction samples were detected by western blotting. Lamin A/C & alpha-tubulin were used as a nuclear & cytosolic loading control, respectively. n = 5. f, g SH-SY5Y cells were transfected with pcDNA3.1/c-eGFP or pcDNA3.1/PPARGC1A-c-eGFP vector for 24 h prior to cortisol treatment for 24 h. f NIX expression was detected in western blot where beta-actin was used as a loading control. n = 5. g TOMM20 levels were detected by western blot. Loading control for western blot is beta-actin. n = 5. All blots & immunofluorescence images are representative. n = 5 from independent experiments with two technical replicates each. Quantitative data are presented as a mean ± S.E.M. Two-sided two-way ANOVA was conducted. ** indicates p < 0.01 versus control. #, ## indicates p < 0.05, p < 0.01 versus corticosterone in hippocampal neurons & cortisol in SH-SY5Y, respectively. Data are provided as a Source data file. Image collected & cropped by CiteAb from the following publication (https://pubmed.ncbi.nlm.nih.gov/33473105), licensed under a CC-BY license. Not internally tested by Novus Biologicals.
Western Blot: PGC1 alpha Antibody - BSA Free [NBP1-04676] -
Western Blot: PGC1 alpha Antibody - BSA Free [NBP1-04676] - Effects of SRTAW04 on expression of markers of mitochondrial & anti-oxidant function. (a) Western blot of protein extracts from optic nerve & retina of control (lanes 1–4), MHV-A59 infected (lanes 5–8), & MHV-A59 infected + SRTAW04-treated (lanes 9–12) mice. Average levels of SDHb measured by Western blotting (n = 4/group) showed a significant (*p < 0.05) decrease in protein extracts from optic nerves (a,b) & retinas (a,d) of MHV-A59 infected mice 7 days post-inoculation, compared to control mice. MHV-A59 infected mice treated with SRTAW04 (100 mg/kg/day) showed a significant increase (@p < 0.05) of SDHb protein expression compared to untreated MHV-A59 infected mice. There is a significant decrease (*p < 0.05) in expression of SOD2 (n = 4/group) in optic nerves (a,c) & retinas (a,e) of MHV-A59 infected mice compared to control mice, & treatment with SRTAW04 significantly (@p < 0.05) attenuates that change. PGC1-alpha expression shows a significant (*p < 0.05) decrease in retinas (a,f) (n = 4/group) during MHV-A59 infection & treatment with SRTAW04 for 7 days significantly (@p < 0.05) increases the PGC1-alpha protein levels. Image collected & cropped by CiteAb from the following publication (https://pubmed.ncbi.nlm.nih.gov/24383546), licensed under a CC-BY license. Not internally tested by Novus Biologicals.
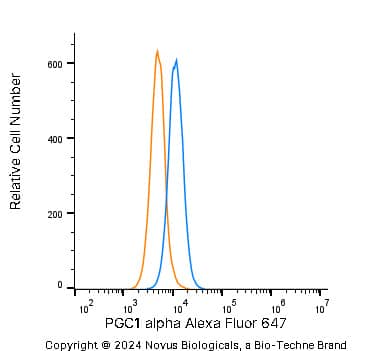
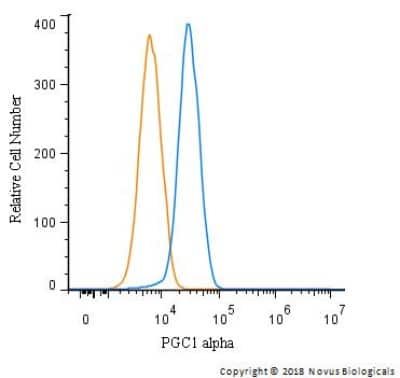
Detection of PGC1 alpha in A431 Human Cell Line by Flow Cytometry.
An intracellular stain was performed on A431 human skin carcinoma cell line using Rabbit anti-PGC1 alpha Affinity Purified Polyclonal Antibody conjugated to Alexa Fluor® 647 (Catalog # NBP1-04676AF647, blue histogram) or matched control antibody (Catalog # NBP2-24981AF647, orange histogram) at 2.5 µg/mL for 30 minutes at RT.



![Immunocytochemistry/Immunofluorescence: PGC1 alpha Antibody - BSA Free [NBP1-04676] - PGC1 alpha Antibody - BSA Free](https://resources.bio-techne.com/images/products/nbp1-04676_rabbit-polyclonal-pgc1-alpha-antibody-271220231253374.jpg)
![Western Blot: PGC1 alpha Antibody - BSA Free [NBP1-04676] - PGC1 alpha Antibody - BSA Free](https://resources.bio-techne.com/images/products/nbp1-04676_rabbit-polyclonal-pgc1-alpha-antibody-310202415291971.jpg)
![Western Blot: PGC1 alpha Antibody - BSA Free [NBP1-04676] - PGC1 alpha Antibody - BSA Free](https://resources.bio-techne.com/images/products/nbp1-04676_rabbit-polyclonal-pgc1-alpha-antibody-31020241534320.jpg)
![Western Blot: PGC1 alpha Antibody - BSA Free [NBP1-04676] - PGC1 alpha Antibody - BSA Free](https://resources.bio-techne.com/images/products/nbp1-04676_rabbit-polyclonal-pgc1-alpha-antibody-310202415345322.jpg)
![Immunocytochemistry/ Immunofluorescence: PGC1 alpha Antibody - BSA Free [NBP1-04676] - PGC1 alpha Antibody - BSA Free](https://resources.bio-techne.com/images/products/nbp1-04676_rabbit-polyclonal-pgc1-alpha-antibody-3102024153566.jpg)
![Western Blot: PGC1 alpha Antibody - BSA Free [NBP1-04676] - PGC1 alpha Antibody - BSA Free](https://resources.bio-techne.com/images/products/nbp1-04676_rabbit-polyclonal-pgc1-alpha-antibody-310202415334945.jpg)
![Western Blot: PGC1 alpha Antibody - BSA Free [NBP1-04676] - PGC1 alpha Antibody - BSA Free](https://resources.bio-techne.com/images/products/nbp1-04676_rabbit-polyclonal-pgc1-alpha-antibody-310202416171473.jpg)
![Western Blot: PGC1 alpha Antibody - BSA Free [NBP1-04676] - PGC1 alpha Antibody - BSA Free](https://resources.bio-techne.com/images/products/nbp1-04676_rabbit-polyclonal-pgc1-alpha-antibody-31020241616036.jpg)
![Western Blot: PGC1 alpha Antibody - BSA Free [NBP1-04676] - PGC1 alpha Antibody - BSA Free](https://resources.bio-techne.com/images/products/nbp1-04676_rabbit-polyclonal-pgc1-alpha-antibody-310202416154646.jpg)
![Western Blot: PGC1 alpha Antibody - BSA Free [NBP1-04676] - PGC1 alpha Antibody - BSA Free](https://resources.bio-techne.com/images/products/nbp1-04676_rabbit-polyclonal-pgc1-alpha-antibody-31020241618267.jpg)
![Immunocytochemistry/ Immunofluorescence: PGC1 alpha Antibody - BSA Free [NBP1-04676] - PGC1 alpha Antibody - BSA Free](https://resources.bio-techne.com/images/products/nbp1-04676_rabbit-polyclonal-pgc1-alpha-antibody-310202416154631.jpg)
![Western Blot: PGC1 alpha Antibody - BSA Free [NBP1-04676] - PGC1 alpha Antibody - BSA Free](https://resources.bio-techne.com/images/products/nbp1-04676_rabbit-polyclonal-pgc1-alpha-antibody-31020241616560.jpg)
![Western Blot: PGC1 alpha Antibody - BSA Free [NBP1-04676] - PGC1 alpha Antibody - BSA Free](https://resources.bio-techne.com/images/products/nbp1-04676_rabbit-polyclonal-pgc1-alpha-antibody-310202416182622.jpg)
![Immunocytochemistry/ Immunofluorescence: PGC1 alpha Antibody - BSA Free [NBP1-04676] - PGC1 alpha Antibody - BSA Free](https://resources.bio-techne.com/images/products/nbp1-04676_rabbit-polyclonal-pgc1-alpha-antibody-310202416173517.jpg)
![Western Blot: PGC1 alpha Antibody - BSA Free [NBP1-04676] - PGC1 alpha Antibody - BSA Free](https://resources.bio-techne.com/images/products/nbp1-04676_rabbit-polyclonal-pgc1-alpha-antibody-31020241615460.jpg)
![Western Blot: PGC1 alpha Antibody - BSA Free [NBP1-04676] - PGC1 alpha Antibody - BSA Free](https://resources.bio-techne.com/images/products/nbp1-04676_rabbit-polyclonal-pgc1-alpha-antibody-31020241617358.jpg)
![Western Blot: PGC1 alpha Antibody - BSA Free [NBP1-04676] - PGC1 alpha Antibody - BSA Free](https://resources.bio-techne.com/images/products/nbp1-04676_rabbit-polyclonal-pgc1-alpha-antibody-31020241616088.jpg)
![Western Blot: PGC1 alpha Antibody - BSA Free [NBP1-04676] - PGC1 alpha Antibody - BSA Free](https://resources.bio-techne.com/images/products/nbp1-04676_rabbit-polyclonal-pgc1-alpha-antibody-310202416175288.jpg)
![Western Blot: PGC1 alpha Antibody - BSA Free [NBP1-04676] - PGC1 alpha Antibody - BSA Free](https://resources.bio-techne.com/images/products/nbp1-04676_rabbit-polyclonal-pgc1-alpha-antibody-310202416163780.jpg)
