Kristy R. Howell, PhD
The cellular recycling process known as autophagy may be induced by a variety of conditions including reduced nutrient availability, serum starvation and pharmacological agents (e.g., Rapamycin (mTOR)). Upon autophagy induction, a process of increased sequestration of dysfunctional cellular components into autophagosomes ensues. The autophagosome fuses with lysosomes, forming an autolysosome, whose components are subsequently degraded via a regulated signaling pathway. To fully understand the mechanisms behind autophagy, an assessment of cell cycle phase and organelle function using advanced technological methods such as flow cytometry is warranted.
LC3B and some of its caveats in monitoring autophagy
Although light chain 3 (LC3) proteins are in both the cytoplasm and nucleus, LC3 is known as an autophagosome marker that is often measured to determine autophagic activity. Particularly, the key biological marker of autophagy is the microtubule associated protein LC3-II (LC3B). LC3B is recruited to the autophagosome’s inner membrane as a cleaved, lipidated form of LC3-I 1,2. The autolysosome’s content, including LC3B, is then degraded and recycled for cell repair and regeneration.

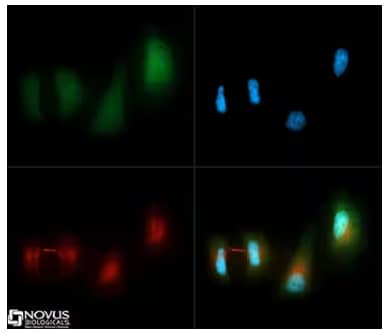
Immunocytochemistry/Immunofluorescence: LC3B Antibody [NB100-2220] - LC3B antibody was tested in HeLa cells with DyLight 488 [NB110-53818G](green). Nuclei and alpha-tubulin were counterstained with DAPI [NBP2-31156-1mg] (blue) and DyLight 550 [NB100-2220R] (red).
Various detection methods provide means to track LC3 protein levels, including use of western blot to monitor autophagy signaling. The sole biochemical use of LC3B expression as a marker of autophagy, however, becomes difficult to interpret given this protein correlates only with the number of autophagosomes, and not how the cells are undergoing this process. Another critical point is that LC3B expression increases through the cell cycle in a normal state2 in addition to being an autophagy substrate, preventing interpretation of whether autophagy is being induced or blocked. It is important, therefore, to consider other methods for measuring autophagy that may provide better strategies for quantifiable and functional data.
Measuring autophagic flux via flow cytometry
Flow cytometry allows for the assessment of a variety of dynamic cellular properties including cell morphology, cell cycle distribution, organelle function and specific organelle changes (e.g., size, organelle specific autophagy), which are critical for the analysis of autophagic activity2.
A commonly used approach to monitor and analyze autophagy flux is via blockade of autophagic activity. For example, chloroquine can be used for its unique properties of inhibiting lysosome acidification, thereby preventing lysosome-autophagosome fusion and the subsequent degradation of metabolic stress products2. Chloroquine thus creates a higher autophagic substrate-gradient for quantification by flow cytometry. One way to maximize outcomes of flow cytometry is through the use of tandem-fluorescently tagged LC3; LC3B-GFP/mCherry3 to determine autophagic flux as introduced in a previous blog: Best way to quantitatively measure Autophagic Flux. The benefit of this approach is the ability to monitor changes in the fluorescence of tandem-fluorescently tagged LC3 as it transitions from autophagosome to an autolysosome destined for degradation.
Physiological functions require lysosomes to have a lower pH to perform degradation. Thus, LC3B within the autolysosome would be cleared of the pH sensitive activated fluorophore (GFP), only showing the signal of the pH stable fluorophore (mCherry), while intact LC3B would be positive for both fluorophores. An autophagosome, therefore, would be positive for both the GFP and mCherry, while an autolysosome will only show red fluorescence due to the elimination of the GFP in the acidic environment. Autophagic flux, or LC3 recycling, is determined by a ratio of the stable fluorophore-mCherry signal and the GFP signal.
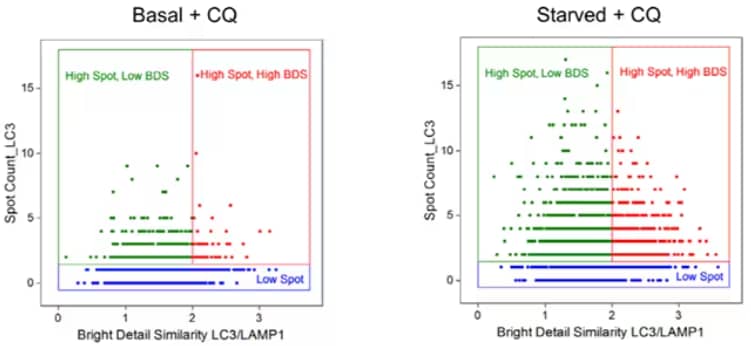
Another method to monitor autophagy flux is multispectral imaging flow cytometry (MIFC), which provides high throughput capabilities, multiplexing potential and can acquire images of every cell for precise quantitative analyses4. MIFC allows the visualization of fluorescently labeled LC3 puncta and/or the co-localization of fluorescently labeled LC3 and lysosomal markers. There are four experimental designs that have used MIFC to examine various readouts for autophagy: 1. Bright Detail Intensity, 2. Spot Count-measure LC3 puncta accumulation, 3. Bright Detail Similarity-visualizes autolysosome formation, and 4. Bright Detail Similarity/Spot Count combination method-assesses autophagosome and lysosome co-localization in addition to LC3 puncta4. While all methods are appropriate, solely using LC3 puncta counts or autolysosome formation as a readout for autophagy, particularly after stressful conditions or pharmacological agents that can induce the process, may lead to misrepresentation of cellular functions that could be better depicted by assessing autophagic product turnover.

Multispectral Imaging Flow Cytometry of T Lymphocytes: Jurkat cells in basal conditions or amino acid starved conditions treated with and without Chloroquine (100 μM for 2hours). Chloroquine increased the number of LC3 puncta alongside an increase in the co-localization of the autophagosomes and lysosomes, which is amplified by nutrient starvation-induced autophagy. This modified figure from Pugsley, 2017 displays use of Bright Detail Similarity/Spot Count combination method to represent measurement of autophagy and autophagic flux. For license, refer to creativecommons.org/licenses/by/4.0/
The benefit of using combined methods such as these would reveal a multitude of phenotypic changes that can provide researchers with functional data in their models. The Bright Detail Similarity/Spot Count combination method, therefore, may be best for measuring autophagic flux due to its ability to quantify lysosome-autophagosome fusion in addition to puncta, which can then help one visualize the intracellular morphological changes occurring in real time. Given that changes in autophagy are observed with both aging and various diseases7, the effective measurement and determination of the cellular consequences of autophagy would provide knowledge for an array of disease models and age-related disorders. Previous work has validated use of LC3 quantification by flow cytometry5,6 using NBP2-46892 and NB100-2220. Further validation of these antibodies using MIFC, however, would significantly advance the autophagy field.

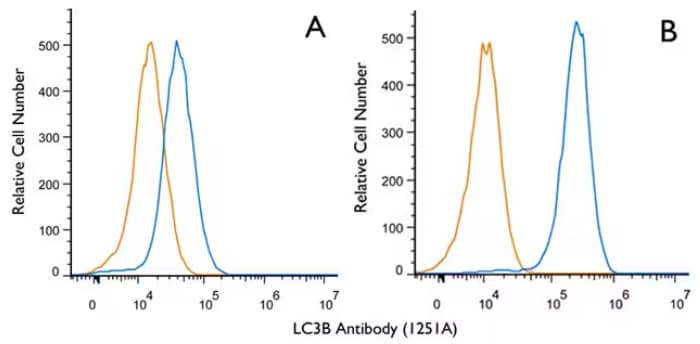
Biological Strategies Validation. Flow Cytometry (Intracellular): LC3B Antibody (1251A) [NBP2-46892] - Jurkat cells were either untreated (A) or treated with 50uM chloroquine for 24 hours (B). An intracellular stain was performed with LC3B (1251A) antibody [NBP2-46892] (blue) and a matched isotype control, rabbit IgG isotype control [MAB1050] (orange). Cells were fixed with 4% paraformaldehyde, and following fixation, cells were permeabilized with 0.1% saponin. Cells were incubated in an antibody dilution of 1 ug/mL for 30 minutes at room temperature, followed by rabbit IgG APC-conjugated secondary antibody [F0111, R&D Systems].

Kristy R. Howell, PhD
Kristy is an animal behavior and molecular signaling expert, whose research has focused on the detrimental role of prenatal obstetric complications on neurodevelopment which underlie neuropsychiatric disorders.
-
Tanida, I., Ueno, T., & Kominami, E (2008) LC3 and autophagy Methods in Molecular Biology
-
Warnes, G. (2015) Flow cytometric assays for the study of autophagy Methods
-
Zhang, Y. et al. (2018) ZZ-dependent regulation of p62/SQSTM1 in autophagy Nature Communications
-
Pugsley, H. R. (2017) Measuring LC3 puncta and autolysosome formation in cells using multispectral imaging flow cytometry Methods
-
Verwey, M. et al. (2016) Autophagy induced by a sulphamoylated estrone analogue contributes to its cytotoxic effect on breast cancer cells Cancer Cell International
-
Parks, A., & Marceau, F. (2016) Lysosomotropic cationic drugs induce cytostatic and cytotoxic effects: Role of liposolubility and autophagic flux and antagonism by cholesterol ablation Toxicology and Applied Pharmacology
-
Fîlfan, M. et al. (2017) Autophagy in aging and disease Romanian Journal of Morphology and Embryology