Detection of Human Progranulin/PGRN by Knockout Validated
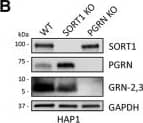
GRN levels are regulated by SORT1 and TMEM106B expression. A, HAP1 PGRN KO cells were treated with C-TAP PGRN or N-TAP PGRN (5 µg/ml) for 24 h and lysates were analyzed for PGRN and GRN-2,3 by immunoblot. B, HAP1 WT, SORT1 KO, and PGRN KO cell lysates were analyzed for endogenous levels of SORT1, PGRN, and GRN-2,3 by immunoblot. C, D, Quantification of (C) PGRN and (D) GRN-2,3 from the experiment in B. E, Overexpression of TMEM106B in HeLa cells for 48-h results in the formation of large vacuoles. Scale bar, 20 µm. F, HeLa cells were transfected with empty vector or TMEM106B for 48 h and lysates were analyzed for PGRN and GRN-2,3 by immunoblot. G-I, Quantification of (G) intracellular PGRN, (H) intracellular GRN-2,3, and (I) secreted PGRN (by ELISA) from the experiment in F. Arrow in F denotes endogenous, intermediate PGRN cleavage product. J, Overexpression of TMEM106B for 24 h in HAP1 PGRN KO cells results in the formation of large vacuoles. Scale bar, 10 µm. K, HAP1 PGRN KO cells were transfected with TMEM106B for 24 h and then treated with mCherry-PGRN (5 µg/ml) for an additional 24 h. Lysates were analyzed for PGRN and GRN-2,3 by immunoblot. L, M, Quantification of (L) PGRN and (M) GRN-2,3 from the experiment in K. For all immunoblots, PGRN and GRN-2,3 were detected with R&D AF2420 and Sigma antibodies, respectively. All immunoblot images are representative of at least three independent experiments and quantitative data are presented as mean ± SEM of three independent experiments; *differs from control p < 0.05; **p < 0.01; ***p < 0.001; ns = not significant. Image collected and cropped by CiteAb from the following publication (https://pubmed.ncbi.nlm.nih.gov/28828399), licensed under a CC-BY license. Not internally tested by R&D Systems.
Detection of Human Progranulin/PGRN by Immunohistochemistry
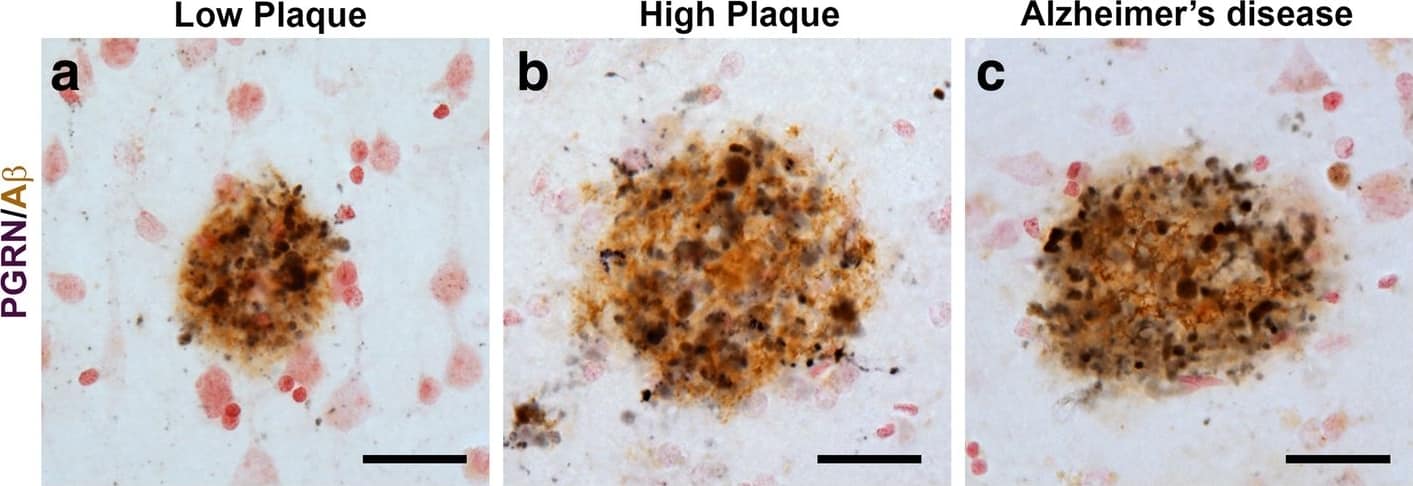
Progranulin Interactions with AD pathological Features. (a-c). Representative photomicrographs of progranulin (PGRN)(purple) immunoreactivity associated with amyloid beta (A beta) plaques (brown) in MTG sections of low plaque, high plaque and Alzheimer’s disease cases. Scale bar represents 30 μm. (d-f). Photomicrographs of PGRN (purple) immunoreactivity associated with CD45 immunoreactive microglia in MTG sections of low plaque (d), high plaque (e), and Alzheimer’s disease cases (f). Insets a) show at higher magnification PGRN-positive stained neurons present in each section. Neurons are identified by their size and characteristic shape. Insets b) show higher magnification of PGRN-positive microglia. Scale bar represents 20 μm (d-f), and 10 μm for insets. (g-i). Photomicrographs of PGRN (purple) with plaque-associated CD45-positive microglia (brown). Progressive increase in accumulation of CD45-positive microglia in low plaque (g), high plaque (h) and Alzheimer’s disease (i) cases. Scale bar represents 30 μm. (j-o). Absence of PGRN immunoreactivity of neurofibrillary tangles. (j-i) Photomicrographs of PGRN (purple) and phosphorylated tau (AT8)(brown) double-stained sections from low plaque (j), high-plaque (k), and Alzheimer’s disease cases (l). (m-o). Confocal micrographs of PGRN (green) and phosphorylated tau (AT180)-positive tangles in low-plaque (m), high-plaque (n) and Alzheimer’s disease (o) cases. Scale bar represents 10 μm. Image collected and cropped by CiteAb from the following publication (https://pubmed.ncbi.nlm.nih.gov/31864418), licensed under a CC-BY license. Not internally tested by R&D Systems.
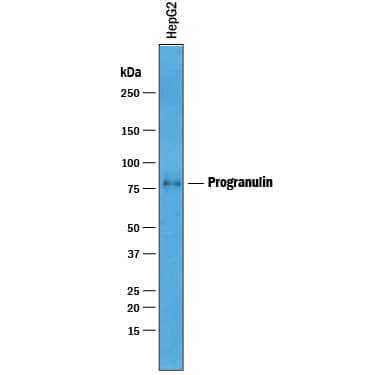
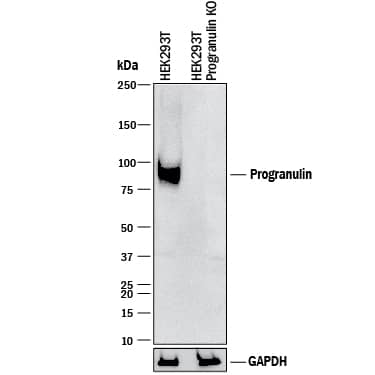
Detection of Human Progranulin/PGRN by Western Blot
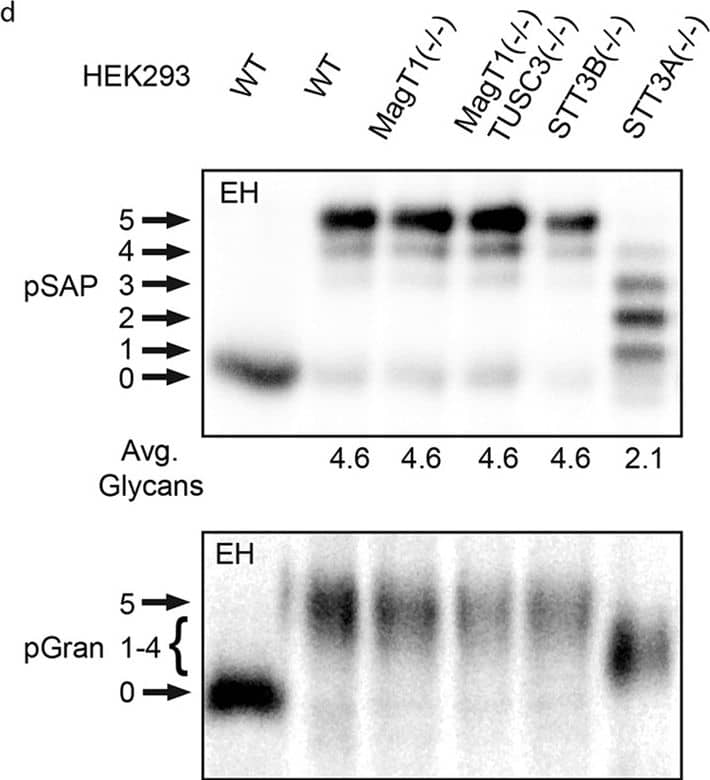
Hypoglycosylation of proteins in knockout HEK293 cell lines.Cell lines were transfected with expression vectors for the following human glycoproteins: (a) SHBG, (b) SHBG derivatives (see diagram) with single glycosylation sites (SHBG N380Q and N396Q), (c) a cathepsin C derivative with a single glycosylation site (CatC delta234-HA), (d) prosaposin (pSAP-DDKHis), (e) haptoglobin (Hp-DDKHis), (f) hemopexin (Hpx-DDKHis). Endogenous progranulin (pGran) (d) was analyzed using non-transfected cells. The cells were pulse labeled for 10 min and chased for 10 min (pSAP, pGran and CatC delta234-HA) or pulse labeled for 5 min and chased for 20 min (Hp, SHBG and Hpx). Glycoproteins precipitated with anti-DDK, anti-HA or anti-SHBG were resolved by PAGE in SDS. EH designates treatment with endoglycosidase H. Quantified values below gel lanes (a–f) are for the displayed image, which is representative of two or more experiments. (b) The vertical line indicates the excision of three intervening gel lanes. (d) Resolution of pGran glycoforms is not sufficient for quantification. Nonglycosylated forms of pSAP, Hp, and Hpx that comigrate with the EH-digested form of the substrate in HEK293 cells correspond to a non-translocated precursor and were not used to calculate the average number of glycans. (a–f) Phosphorimages were cropped to display the region of interest. Full-length phosphorimages are shown in Supplemental Fig. S5. Image collected and cropped by CiteAb from the following publication (https://pubmed.ncbi.nlm.nih.gov/26864433), licensed under a CC-BY license. Not internally tested by R&D Systems.
Detection of Human Progranulin/PGRN by Immunocytochemistry/Immunofluorescence
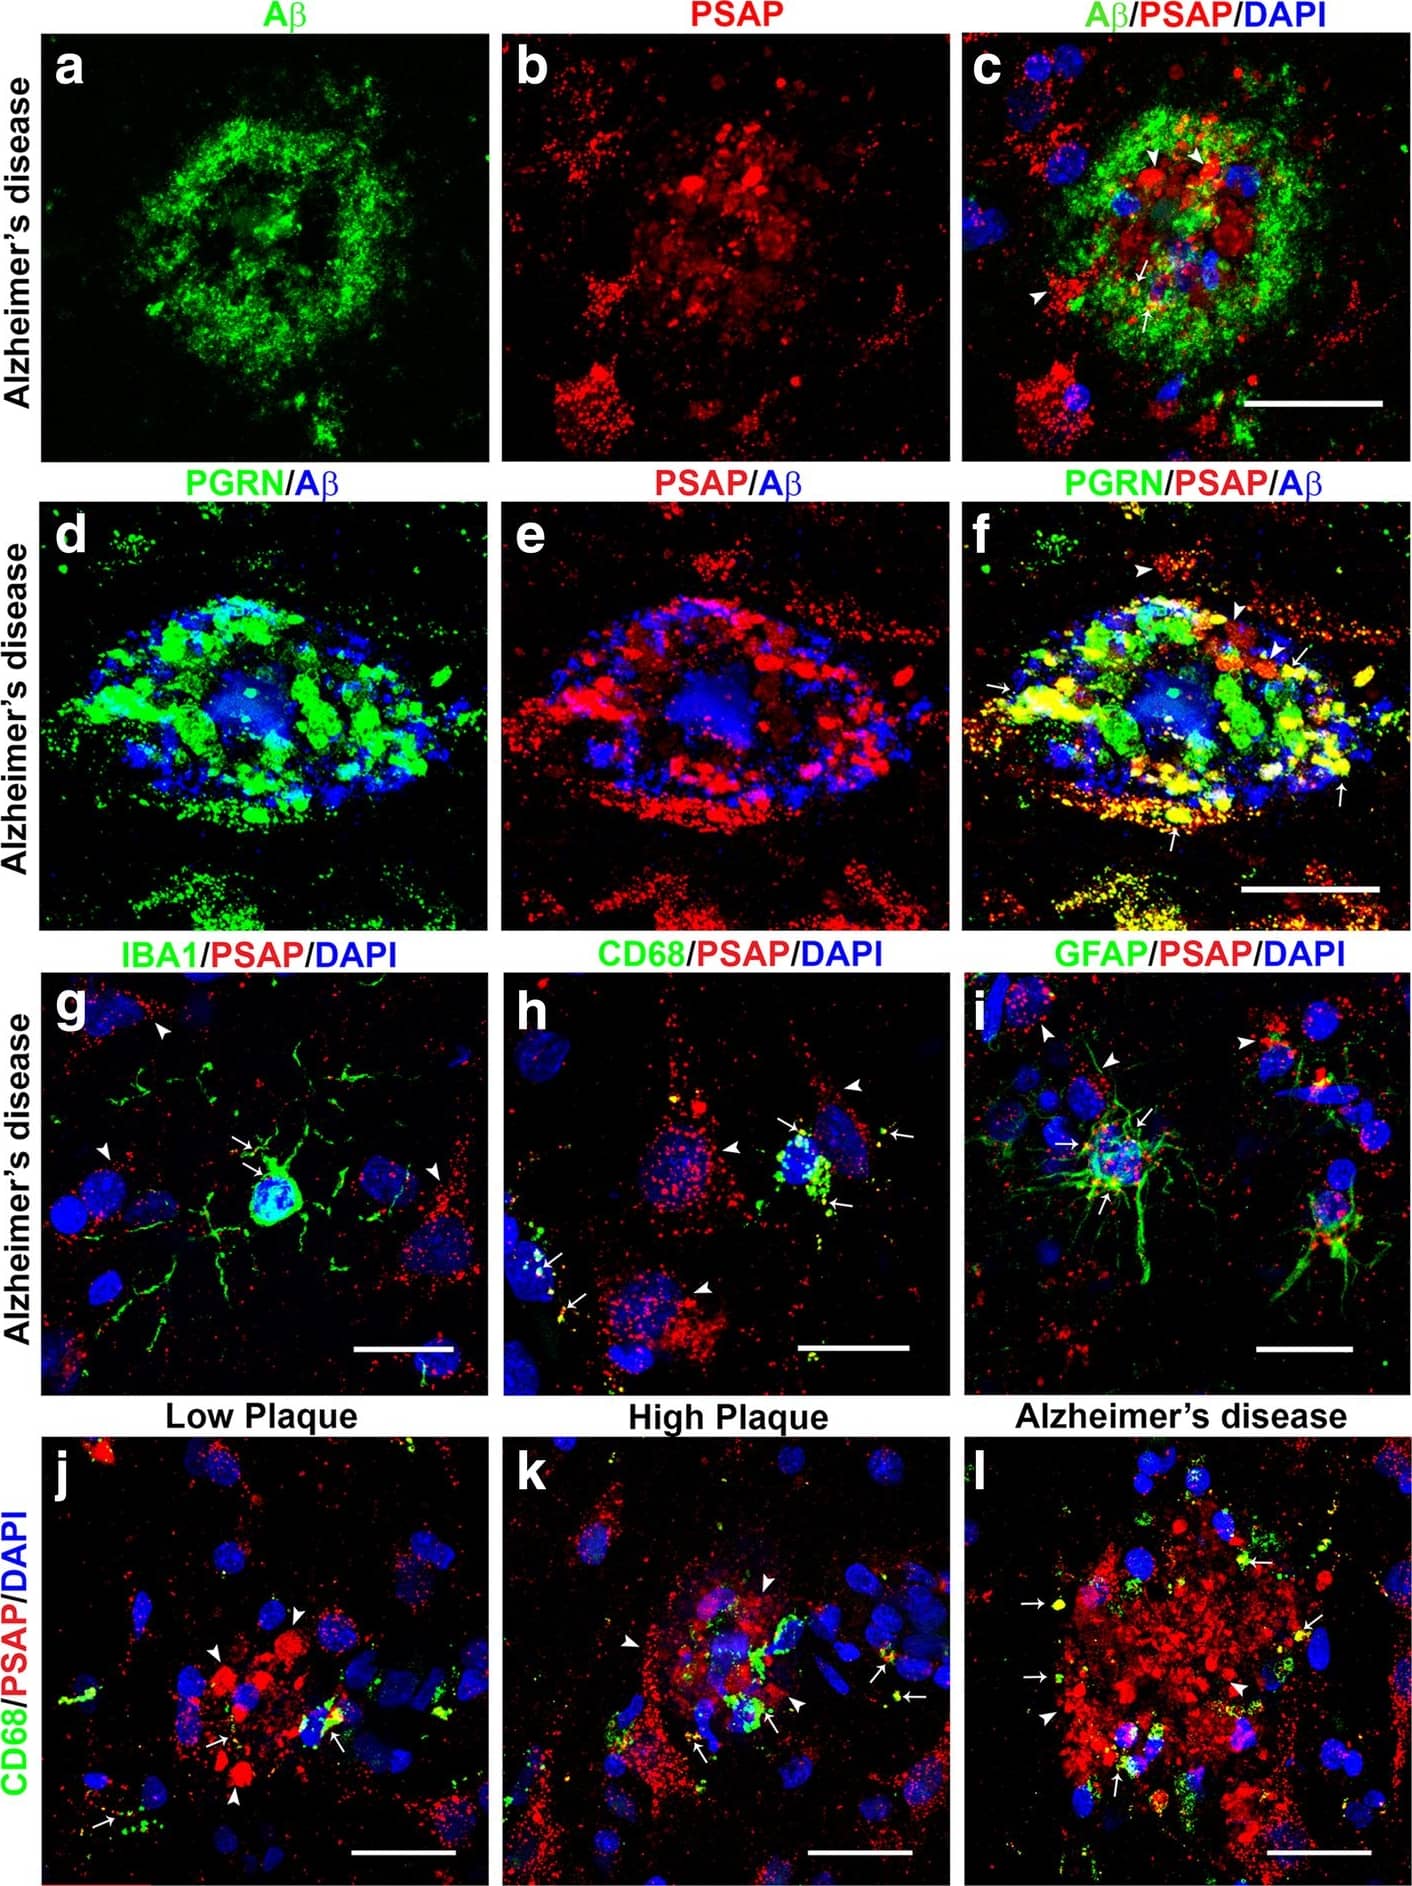
Confocal microscopy of prosaposin localization on plaques and different cell types. (a-c). A beta (green) (a) and PSAP (red) plaque (b) with limited colocalization (C – yellow) in an AD case. Scale bar represents 30 μm. (d-f). Comparison of colocalization in plaque of PGRN (green) and A beta (blue) (d) with PSAP (red) and A beta (blue) in triple-stained AD section. Merged images show extensive colocalization of PGRN and PSAP (yellow) but limited overlap with A beta-positive structures. Scale bar represents 30 μm. (G-I). Merged images of PSAP (red) immunoreactivity with microglial markers IBA-1 (g) and CD68 (h) (green) and astrocyte marker GFAP (green) show some expression of PSAP in both cell types (yellow). These images show that PSAP (red) is predominantly in cells with morphology of neurons. Scale bar represents 10 μm. (j-l). Merged images of CD68 (green) and PSAP (red) on plaques in low plaque case (J), high plaque case (k) and AD case (l). Significant amounts of PSAP immunoreactivity (red) can be observed on all plaques but with only limited colocalization with CD68 in infiltrating microglia. Scale bar represents 30 μm. (m-n) Merged images of AT180 (pTau) (green) and PSAP (red) on tangle in low plaque case (M), high plaque case (n) and Alzheimer’s disease case (o). Very limited amounts of PSAP immunoreactivity (yellow) can be observed on tangles. Panel M and N show intracellular tangles with DAPI-positive nuclei, while panel O shows extracellular tangle. Scale bar represents 30 μm. Image collected and cropped by CiteAb from the following publication (https://pubmed.ncbi.nlm.nih.gov/31864418), licensed under a CC-BY license. Not internally tested by R&D Systems.
Detection of Human Progranulin/PGRN by Immunohistochemistry
Progranulin Interactions with AD pathological Features. (a-c). Representative photomicrographs of progranulin (PGRN)(purple) immunoreactivity associated with amyloid beta (A beta) plaques (brown) in MTG sections of low plaque, high plaque and Alzheimer’s disease cases. Scale bar represents 30 μm. (d-f). Photomicrographs of PGRN (purple) immunoreactivity associated with CD45 immunoreactive microglia in MTG sections of low plaque (d), high plaque (e), and Alzheimer’s disease cases (f). Insets a) show at higher magnification PGRN-positive stained neurons present in each section. Neurons are identified by their size and characteristic shape. Insets b) show higher magnification of PGRN-positive microglia. Scale bar represents 20 μm (d-f), and 10 μm for insets. (g-i). Photomicrographs of PGRN (purple) with plaque-associated CD45-positive microglia (brown). Progressive increase in accumulation of CD45-positive microglia in low plaque (g), high plaque (h) and Alzheimer’s disease (i) cases. Scale bar represents 30 μm. (j-o). Absence of PGRN immunoreactivity of neurofibrillary tangles. (j-i) Photomicrographs of PGRN (purple) and phosphorylated tau (AT8)(brown) double-stained sections from low plaque (j), high-plaque (k), and Alzheimer’s disease cases (l). (m-o). Confocal micrographs of PGRN (green) and phosphorylated tau (AT180)-positive tangles in low-plaque (m), high-plaque (n) and Alzheimer’s disease (o) cases. Scale bar represents 10 μm. Image collected and cropped by CiteAb from the following publication (https://pubmed.ncbi.nlm.nih.gov/31864418), licensed under a CC-BY license. Not internally tested by R&D Systems.
Detection of Human Progranulin/PGRN by Western Blot
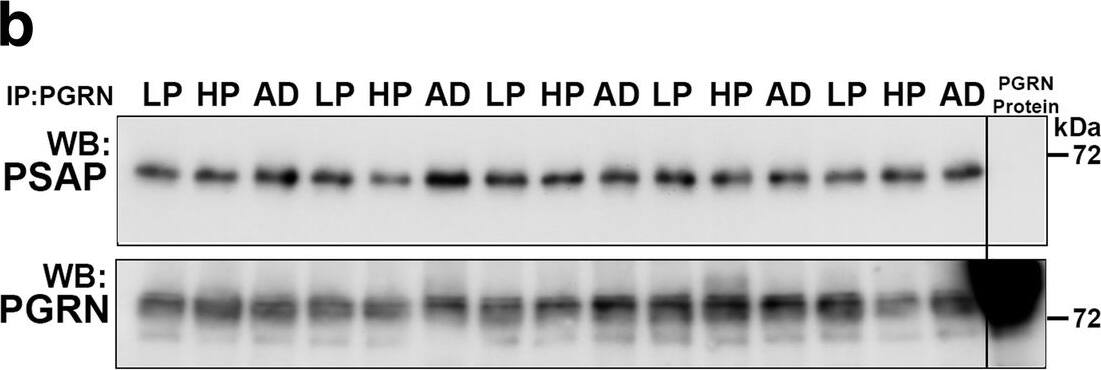
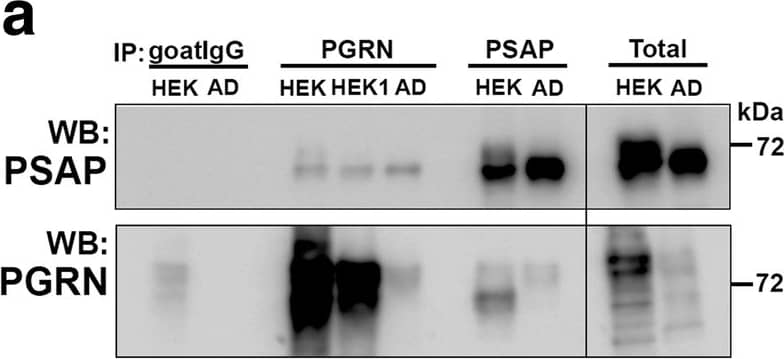
Biochemical analysis of interactions of progranulin and prosaposin in MTG brain samples. (a-b). Co-immunoprecipitation of Progranulin and Prosaposin. a). Western blot control analyses to show interactions of progranulin (PGRN) and prosaposin (PSAP). Immunoprecipitation of PGRN-overexpressing HEK (HEK and HEK1) cells and AD brain sample with protein G- (goat antibody) or protein A- (rabbit antibody) antibody-conjugated magnetic beads. Beads were prepared using non-immune goat IgG, goat anti-PGRN and rabbit anti-PSAP. Immunoprecipitated samples were separated by gel electrophoresis, transferred to membranes, and probed with antibodies to PSAP and PGRN. Samples of total protein (non-immunoprecipitated) from PGRN-overexpressing HEK (HEK) cells and brain sample (AD) were analyzed as specificity controls. Samples immunoprecipitated with PGRN antibody contained PSAP, and samples precipitated with PSAP antibody contained PGRN. b). All of the brain samples from LP, AD and HP cases precipitated with PGRN antibody pulled-down PSAP. A series of cases (n = 5) from each group were analyzed. Western blot images for both antibodies are shown. (c-f) Biochemical analysis of prosaposin in MTG brain protein extracts. c). Western blot analysis of total PSAP protein levels in MTG samples. Representative image of western blot demonstrating PSAP protein in samples from LP, HP and AD cases. The complete images of all samples analyzed for PSAP are shown as Additional file 4: Figure. S4B. D). Scatter plot showing expression levels of PSAP protein in the different groups. Results represent mean ±S.E.M. Significantly increased levels of PSAP protein were present in AD case compared to LP and HP cases but not between LP and HP cases. Significant increased levels of PSAP protein in MTG samples from AD compared to HP (* p < 0.05) and LP (** p < 0.01). e). Positive correlation between PSAP and PGRN protein levels in MTG samples (Pearson r = 0.4674, p = 0.0070). f). Positive correlation between PSAP and A beta protein levels in MTG samples (Pearson r = 0.4584, p = 0.0083). Image collected and cropped by CiteAb from the following publication (https://pubmed.ncbi.nlm.nih.gov/31864418), licensed under a CC-BY license. Not internally tested by R&D Systems.
Detection of Human Progranulin/PGRN by Immunohistochemistry
Progranulin Interactions with AD pathological Features. (a-c). Representative photomicrographs of progranulin (PGRN)(purple) immunoreactivity associated with amyloid beta (A beta) plaques (brown) in MTG sections of low plaque, high plaque and Alzheimer’s disease cases. Scale bar represents 30 μm. (d-f). Photomicrographs of PGRN (purple) immunoreactivity associated with CD45 immunoreactive microglia in MTG sections of low plaque (d), high plaque (e), and Alzheimer’s disease cases (f). Insets a) show at higher magnification PGRN-positive stained neurons present in each section. Neurons are identified by their size and characteristic shape. Insets b) show higher magnification of PGRN-positive microglia. Scale bar represents 20 μm (d-f), and 10 μm for insets. (g-i). Photomicrographs of PGRN (purple) with plaque-associated CD45-positive microglia (brown). Progressive increase in accumulation of CD45-positive microglia in low plaque (g), high plaque (h) and Alzheimer’s disease (i) cases. Scale bar represents 30 μm. (j-o). Absence of PGRN immunoreactivity of neurofibrillary tangles. (j-i) Photomicrographs of PGRN (purple) and phosphorylated tau (AT8)(brown) double-stained sections from low plaque (j), high-plaque (k), and Alzheimer’s disease cases (l). (m-o). Confocal micrographs of PGRN (green) and phosphorylated tau (AT180)-positive tangles in low-plaque (m), high-plaque (n) and Alzheimer’s disease (o) cases. Scale bar represents 10 μm. Image collected and cropped by CiteAb from the following publication (https://pubmed.ncbi.nlm.nih.gov/31864418), licensed under a CC-BY license. Not internally tested by R&D Systems.
Detection of Human Progranulin/PGRN by Western Blot
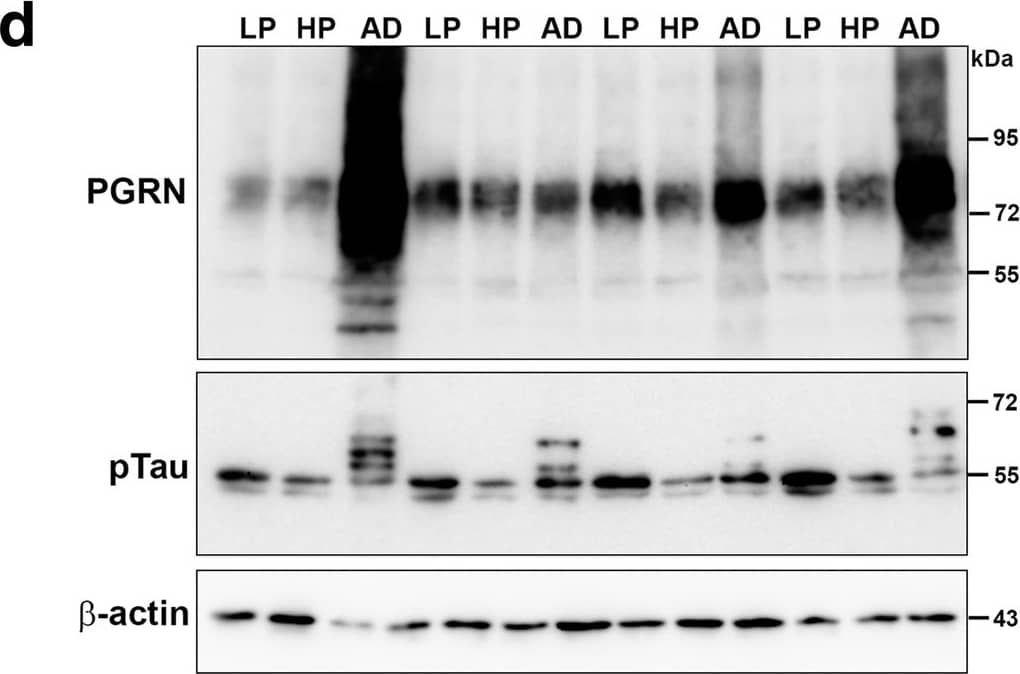
Biochemical analyses of Progranulin in MTG samples compared to A beta and phosphorylated tau. a). Scatter plot showing expression levels of PGRN protein in the different groups. Results presented represent the combination of levels of 75–80 kDa and lower molecular weight (55 kDa) PGRN protein bands. Results represent mean ±S.E.M. Significantly increased levels of PGRN protein were present in AD case compared to LP and HP cases but not between LP and HP cases (** p < 0.01, ns – not significant). b). Scatter plot showing expression levels of A beta protein in the different groups. Results presented represent the levels of all p-tau detected bands. Results represent mean ±S.E.M. Significantly increased levels of A beta (monomer) protein were present in AD case compared to LP and AD cases but not between LP and HP or HP and AD cases (** p < 0.01, ns – not significant). Outlier HP case indicated by red arrow (see text). c). Scatter plot showing expression levels of phosphorylated tau (p-tau – Thr 231) protein in the different disease groups. Results presented represent the levels of all p-tau detected bands. Results represent mean ±S.E.M. Significantly increased levels of p-tau protein were present in AD cases compared to LP and HP cases but not between LP and HP cases (* p < 0.05, ** p < 0.01, ns – not significant). d). Western blots showing bands detected with goat antibody to PGRN (PGRN) in MTG protein extracts from low plaque (LP), high plaque (HP) and AD cases. The complete series of samples are presented in Additional file 4: Fig. S4A). The same blots were reprobed with antibody AT180 to phosphorylated tau (pTau), and beta-actin for normalization purposes. e). Western blots showing bands detected with antibody 6E10 to A beta in MTG protein extracts from low plaque (LP), high plaque (HP) and AD cases. Results represent mean ±S.E.M. Samples were separate from those in panel A by using Tris-tricine gels to resolve low molecular weight bands. f). Correlation Analyses between PGRN protein and A beta protein levels for all samples. Significant correlation (r = 0.5422, p = 0.0013). g). Correlation Analyses between PGRN protein and p-tau (Thr231) protein levels for all samples. Significant correlation (r = 0.5264, p = 0.002). Image collected and cropped by CiteAb from the following publication (https://pubmed.ncbi.nlm.nih.gov/31864418), licensed under a CC-BY license. Not internally tested by R&D Systems.
Detection of Human Progranulin/PGRN by Western Blot
Biochemical analysis of interactions of progranulin and prosaposin in MTG brain samples. (a-b). Co-immunoprecipitation of Progranulin and Prosaposin. a). Western blot control analyses to show interactions of progranulin (PGRN) and prosaposin (PSAP). Immunoprecipitation of PGRN-overexpressing HEK (HEK and HEK1) cells and AD brain sample with protein G- (goat antibody) or protein A- (rabbit antibody) antibody-conjugated magnetic beads. Beads were prepared using non-immune goat IgG, goat anti-PGRN and rabbit anti-PSAP. Immunoprecipitated samples were separated by gel electrophoresis, transferred to membranes, and probed with antibodies to PSAP and PGRN. Samples of total protein (non-immunoprecipitated) from PGRN-overexpressing HEK (HEK) cells and brain sample (AD) were analyzed as specificity controls. Samples immunoprecipitated with PGRN antibody contained PSAP, and samples precipitated with PSAP antibody contained PGRN. b). All of the brain samples from LP, AD and HP cases precipitated with PGRN antibody pulled-down PSAP. A series of cases (n = 5) from each group were analyzed. Western blot images for both antibodies are shown. (c-f) Biochemical analysis of prosaposin in MTG brain protein extracts. c). Western blot analysis of total PSAP protein levels in MTG samples. Representative image of western blot demonstrating PSAP protein in samples from LP, HP and AD cases. The complete images of all samples analyzed for PSAP are shown as Additional file 4: Figure. S4B. D). Scatter plot showing expression levels of PSAP protein in the different groups. Results represent mean ±S.E.M. Significantly increased levels of PSAP protein were present in AD case compared to LP and HP cases but not between LP and HP cases. Significant increased levels of PSAP protein in MTG samples from AD compared to HP (* p < 0.05) and LP (** p < 0.01). e). Positive correlation between PSAP and PGRN protein levels in MTG samples (Pearson r = 0.4674, p = 0.0070). f). Positive correlation between PSAP and A beta protein levels in MTG samples (Pearson r = 0.4584, p = 0.0083). Image collected and cropped by CiteAb from the following publication (https://pubmed.ncbi.nlm.nih.gov/31864418), licensed under a CC-BY license. Not internally tested by R&D Systems.
Detection of Human Progranulin/PGRN by Immunocytochemistry/Immunofluorescence
Progranulin Interactions with AD pathological Features. (a-c). Representative photomicrographs of progranulin (PGRN)(purple) immunoreactivity associated with amyloid beta (A beta) plaques (brown) in MTG sections of low plaque, high plaque and Alzheimer’s disease cases. Scale bar represents 30 μm. (d-f). Photomicrographs of PGRN (purple) immunoreactivity associated with CD45 immunoreactive microglia in MTG sections of low plaque (d), high plaque (e), and Alzheimer’s disease cases (f). Insets a) show at higher magnification PGRN-positive stained neurons present in each section. Neurons are identified by their size and characteristic shape. Insets b) show higher magnification of PGRN-positive microglia. Scale bar represents 20 μm (d-f), and 10 μm for insets. (g-i). Photomicrographs of PGRN (purple) with plaque-associated CD45-positive microglia (brown). Progressive increase in accumulation of CD45-positive microglia in low plaque (g), high plaque (h) and Alzheimer’s disease (i) cases. Scale bar represents 30 μm. (j-o). Absence of PGRN immunoreactivity of neurofibrillary tangles. (j-i) Photomicrographs of PGRN (purple) and phosphorylated tau (AT8)(brown) double-stained sections from low plaque (j), high-plaque (k), and Alzheimer’s disease cases (l). (m-o). Confocal micrographs of PGRN (green) and phosphorylated tau (AT180)-positive tangles in low-plaque (m), high-plaque (n) and Alzheimer’s disease (o) cases. Scale bar represents 10 μm. Image collected and cropped by CiteAb from the following publication (https://pubmed.ncbi.nlm.nih.gov/31864418), licensed under a CC-BY license. Not internally tested by R&D Systems.
Detection of Human Progranulin/PGRN by Immunohistochemistry
Progranulin Interactions with AD pathological Features. (a-c). Representative photomicrographs of progranulin (PGRN)(purple) immunoreactivity associated with amyloid beta (A beta) plaques (brown) in MTG sections of low plaque, high plaque and Alzheimer’s disease cases. Scale bar represents 30 μm. (d-f). Photomicrographs of PGRN (purple) immunoreactivity associated with CD45 immunoreactive microglia in MTG sections of low plaque (d), high plaque (e), and Alzheimer’s disease cases (f). Insets a) show at higher magnification PGRN-positive stained neurons present in each section. Neurons are identified by their size and characteristic shape. Insets b) show higher magnification of PGRN-positive microglia. Scale bar represents 20 μm (d-f), and 10 μm for insets. (g-i). Photomicrographs of PGRN (purple) with plaque-associated CD45-positive microglia (brown). Progressive increase in accumulation of CD45-positive microglia in low plaque (g), high plaque (h) and Alzheimer’s disease (i) cases. Scale bar represents 30 μm. (j-o). Absence of PGRN immunoreactivity of neurofibrillary tangles. (j-i) Photomicrographs of PGRN (purple) and phosphorylated tau (AT8)(brown) double-stained sections from low plaque (j), high-plaque (k), and Alzheimer’s disease cases (l). (m-o). Confocal micrographs of PGRN (green) and phosphorylated tau (AT180)-positive tangles in low-plaque (m), high-plaque (n) and Alzheimer’s disease (o) cases. Scale bar represents 10 μm. Image collected and cropped by CiteAb from the following publication (https://pubmed.ncbi.nlm.nih.gov/31864418), licensed under a CC-BY license. Not internally tested by R&D Systems.
Detection of Human Progranulin/PGRN by Western Blot
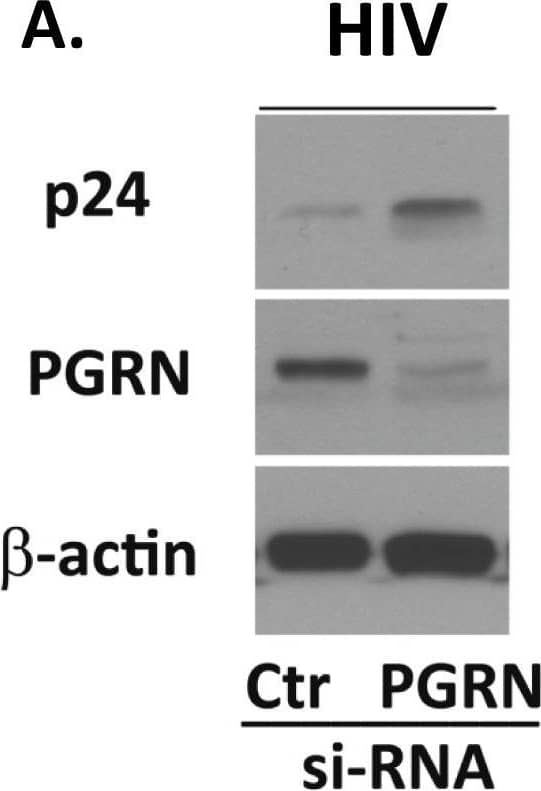
PGRN is an endogenous anti-HIV factor.Microglial PGRN was knocked down using RNAi 2–4 days prior to VSVg env HIV exposure as described in the Materials and Methods. Control cultures were treated with control, irrelevant siRNA (Ctr). The amounts of HIV (p24) and PGRN expression were determined by western blot analyses. (A) A representative western blot showing suppression of PGRN and increase of p24 following PGRN siRNA treatment. (B) Pooled densitometry data from four independent experiments showing significant inhibition of PGRN and increase of HIV (gag p24 express) in microglial cells treated with PGRN siRNA (vs. control siRNA). **P<0.01, ***P<0.001 by paired t-test. Image collected and cropped by CiteAb from the following publication (https://pubmed.ncbi.nlm.nih.gov/24878635), licensed under a CC-BY license. Not internally tested by R&D Systems.

