Osteocalcin in Human Cartilage.
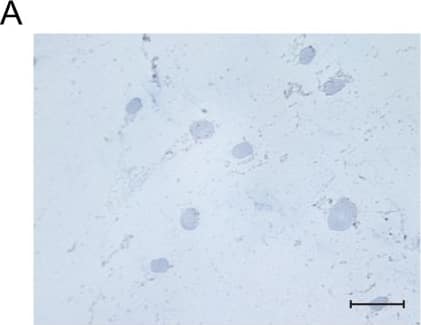
Osteocalcin was detected in immersion fixed paraffin-embedded sections of human cartilage using Mouse Anti-Human/Rat Osteocalcin Monoclonal Antibody (Catalog # MAB1419) at 8 µg/mL overnight at 4 °C. Tissue was stained using the Anti-Mouse HRP-DAB Cell & Tissue Staining Kit (brown; Catalog #
CTS002) and counterstained with hematoxylin (blue). Specific labeling was localized to the cytoplasm of chondrocytes. View our protocol for Chromogenic IHC Staining of Paraffin-embedded Tissue Sections.
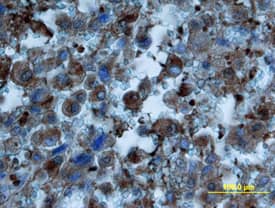
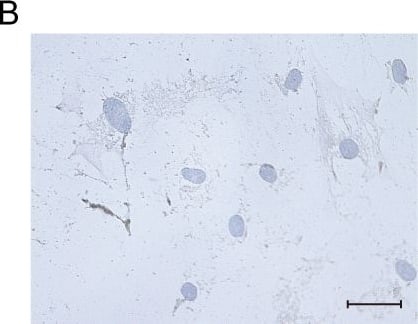
Osteocalcin in Human Osteosarcoma.
Osteocalcin was detected in immersion fixed paraffin-embedded sections of human osteosarcoma using Mouse Anti-Human/Rat Osteocalcin Monoclonal Antibody (Catalog # MAB1419) at 25 µg/mL overnight at 4 °C. Tissue was stained using the Anti-Mouse HRP-DAB Cell & Tissue Staining Kit (brown; Catalog #
CTS002) and counterstained with hematoxylin (blue). View our protocol for Chromogenic IHC Staining of Paraffin-embedded Tissue Sections.
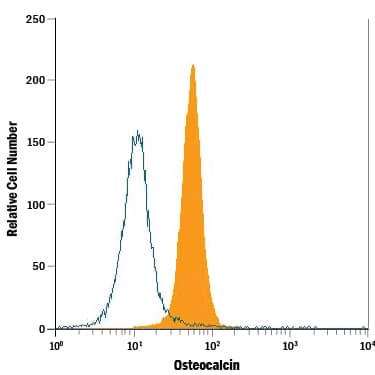
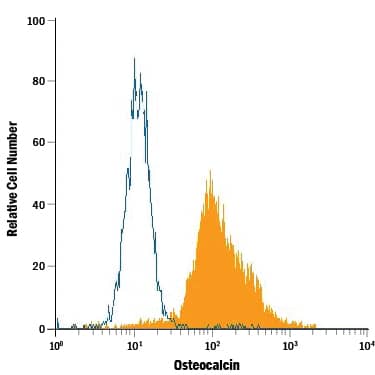
Detection of Osteocalcin in Saos‑2 Human Cell Line by Flow Cytometry.
Saos-2 human osteosarcoma cell line was stained with Mouse Anti-Human/Rat Osteocalcin Monoclonal Antibody (Catalog # MAB1419, filled histogram) or isotype control antibody (Catalog #
MAB002, open histogram), followed by Allophycocyanin-conjugated Anti-Mouse IgG Secondary Antibody (Catalog #
F0101B). To facilitate intracellular staining, cells were fixed with paraformaldehyde and permeabilized with saponin.
Detection of Osteocalcin in Human Osteoblasts by Flow Cytometry.
Human osteoblasts were stained with Mouse Anti-Human/Rat Osteocalcin Monoclonal Antibody (Catalog # MAB1419, filled histogram) or isotype control antibody (Catalog #
MAB002, open histogram), followed by Allophycocyanin-conjugated Anti-Mouse IgG Secondary Antibody (Catalog #
F0101B). To facilitate intracellular staining, cells were fixed with paraformaldehyde and permeabilized with saponin.
Detection of Human Osteocalcin by Western Blot
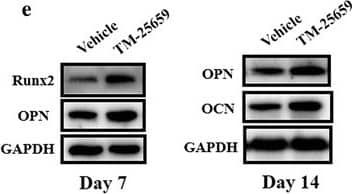
Exposure of TAZ activator TM-25659 promotes osteogenic differentiation of ADSCs in vitro. a Cell viability was determined after ADSCs were cultured with diverse concentrations of TM-25659 (0–50 μM) at 24 h and 48 h, respectively. B Enhanced osteogenic differentiation of ADSCs was detected and quantified by alkaline phosphatase (ALP) activity assay following ADSC culture with osteoinductive medium and TM-25659 at day 7. c, d Increased mineralization in ADSCs cultured in osteoinductive medium and TM-25659 was observed and quantified via Alizarin Red staining at days 7 and 14. Scale bar = 50 μm. e Significantly increased expression of the osteogenic markers runt-related transcription factor 2 (Runx2), osteopontin (OPN), and osteocalcin (OCN) was observed in ADSCs cultured in osteoinductive medium and TM-25659 at days 7 and 14, respectively. Representative images of Western blots from three independent experiments are shown. Data shown here are mean ± SD from three independent experiments; **P < 0.01, by Student’s t test. GAPDH glyeraldehyde-3-phosphate dehydrogenase, OD optical density Image collected and cropped by CiteAb from the following publication (https://pubmed.ncbi.nlm.nih.gov/29514703), licensed under a CC-BY license. Not internally tested by R&D Systems.
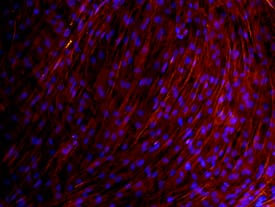
Detection of Human Osteocalcin by Immunocytochemistry/Immunofluorescence
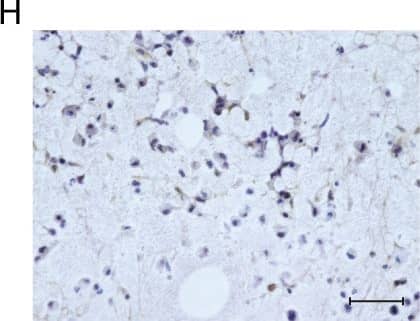
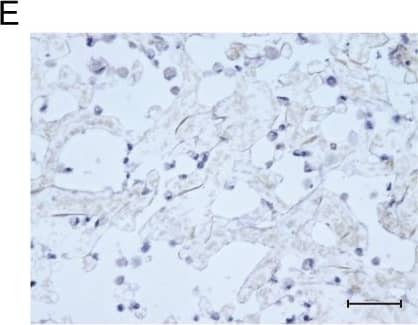
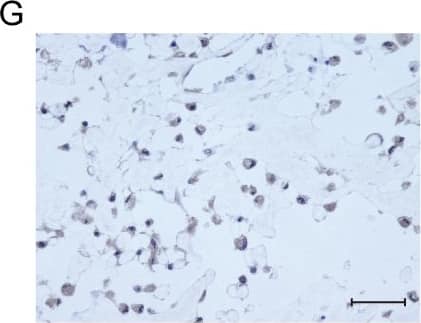
Nano-fiber plugs induce osteogenesis of human MSCs.Healthy donor-derived MSCs were seeded onto plastic plates (A-C) or injected into the nano-fiber plugs (D-I), and then cultured in MSCGM for 1 day (D), 7 days (E, G), 14 days (F, H) and 28 days (A-C, I). Then, the expression levels of RUNX2 (A, D, G), osteocalcin (B, E, H), and DMP-1 (C, F, I) were evaluated immunohistochemically. Representative results of three experiments are shown. (J) Healthy donor-derived MSCs were cultured in MSCGM onto plastic plates (two-dimensional) or nano-fiber plugs (three-dimensional) for 28 days. After RNA extraction, MEPE expression in the 4 groups of healthy donor-derived MSCswas evaluated by real-time PCR. *p<0.05 vs. two-dimensional culture by paired t-test. Scale bars, 50 μm. Image collected and cropped by CiteAb from the following publication (https://dx.plos.org/10.1371/journal.pone.0153231), licensed under a CC-BY license. Not internally tested by R&D Systems.
Detection of Human Osteocalcin by Western Blot
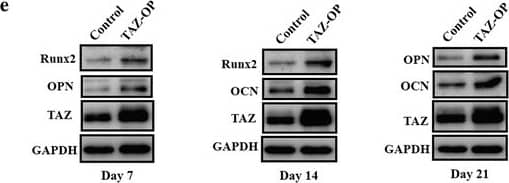
Enforced TAZ overexpression enhances osteogenic differentiation of ADSCs in vitro. a Transcriptional coactivator with PDZ-binding motif (TAZ) overexpression (OP) in ADSCs infected with lentiviral particles containing human TAZ cDNA sequence was verified by Western blot. Representative images of Western blots from three independent experiments are shown. b Accelerated cell proliferation was detected in TAZ-overexpressing ADSCs compared with control cells infected with empty lentiviral particles via MTT assay. c Enhanced osteogenic differentiation of ADSCs was detected and quantified by alkaline phosphatase (ALP) activity assay following TAZ overexpression in ADSCs induced in vitro at day 7. d Increased mineralization in TAZ-overexpressing ADSCs cultured in osteoinductive medium was observed via Alizarin Red staining at days 7 and 14. Scale bar = 50 μm. e Significantly enhanced expression of TAZ as well as the osteogenic markers osteopontin (OPN) and osteocalcin (OCN) in TAZ-overexpressing ADSCs cultured in osteoinductive medium at days 7, 14, and 21 was detected by Western blot. Representative images of Western blots from three independent experiments are shown. Data shown here are mean ± SD from three independent experiments; #P ˃ 0.05, *P < 0.05, **P < 0.01, by Student’s t test. GAPDH glyeraldehyde-3-phosphate dehydrogenase, OD optical density, Runx2 runt-related transcription factor 2 Image collected and cropped by CiteAb from the following publication (https://pubmed.ncbi.nlm.nih.gov/29514703), licensed under a CC-BY license. Not internally tested by R&D Systems.
Detection of Human Osteocalcin by Western Blot
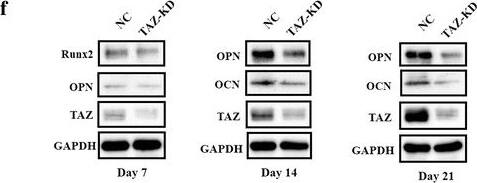
TAZ knockdown impairs osteogenic differentiation of ADSCs in vitro. a Transcriptional coactivator with PDZ-binding motif (TAZ) knockdown (KD) in ADSCs infected with shRNA lentiviral particles targeting human TAZ was verified by Western blot. Representative images of Western blots from three independent experiments are shown. b TAZ and its downstream targets CTGF and Cyr61 were downregulated in TAZ-knockdown ADSCs as determined by quantitative RT-PCR. c Cell proliferation was compromised in TAZ-knockdown ADSCs compared with control cells infected with nontargeting lentiviral vectors with scrambled sequence. d Compromised osteogenic differentiation of ADSCs was detected and quantified by alkaline phosphatase (ALP) activity assay following TAZ knockdown of ADSCs induced in vitro at day 7. e Reduced mineralization in TAZ-knockdown ADSCs cultured in osteoinductive medium was observed via Alizarin Red staining at days 7, 14, and 21. f Significantly reduced expression of TAZ as well as the osteogenic markers osteopontin (OPN) and osteocalcin (OCN) in TAZ-knockdown ADSCs cultured in osteoinductive medium at days 7, 14, and 21 was detected by Western blot. Representative images of Western blots from three independent experiments are shown. Data shown here are mean ± SD from three independent experiments, #P ˃ 0.05, *P < 0.05, **P < 0.01, by Student’s t test. GAPDH glyeraldehyde-3-phosphate dehydrogenase, NC normal control, OD optical density, Runx2 runt-related transcription factor 2 Image collected and cropped by CiteAb from the following publication (https://pubmed.ncbi.nlm.nih.gov/29514703), licensed under a CC-BY license. Not internally tested by R&D Systems.
Detection of Human Osteocalcin by Western Blot
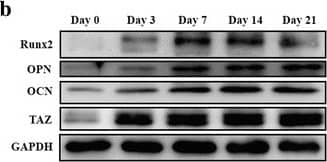
TAZ is upregulated during osteogenesis while it is downregulated during adipogenesis in human ADSCs. a Osteogenic differentiation of ADSCs was induced in vitro and monitored by Alizarin Red and von Kossa staining at the indicated time points (days 7, 14, 21, and 28 after induction). Scale bar = 50 μm. b,c Transcriptional coactivator with PDZ-binding motif (TAZ) protein was significantly increased during the osteogenic differentiation process of ADSCs, concomitant with markedly upregulated expression of the osteogenic markers runt-related transcription factor 2 (Runx2), osteopontin (OPN), and osteocalcin (OCN). Representative images of Western blots from three independent experiments are shown. d The mRNA levels of TAZ and the osteogenic markers were significantly increased during ADSC osteogenic differentiation in vitro as measured by quantitative RT-PCR. e Adipogenic differentiation of ADSCs was induced in vitro and determined by Oil Red O staining at the indicated time points (days 7, 14, and 21 after induction). Scale bar = 50 μm. f TAZ protein was significantly downregulated during the adipogenic differentiation process of ADSCs. Representative images of Western blots from three independent experiments are shown. g The mRNA levels of TAZ decreased while the adipogenic marker increased during ADSC adipogenic differentiation in vitro as measured by quantitative RT-PCR. Data shown here are mean ± SD from three independent experiments; #P ˃ 0.05, *P < 0.05, **P < 0.01, by ANOVA. ALP alkaline phosphatase, GAPDH glyeraldehyde-3-phosphate dehydrogenase, PPAR gamma peroxisome proliferator-activated receptor-gamma Image collected and cropped by CiteAb from the following publication (https://pubmed.ncbi.nlm.nih.gov/29514703), licensed under a CC-BY license. Not internally tested by R&D Systems.
Detection of Rat Osteocalcin by Immunocytochemistry/Immunofluorescence
In vitro differentiation capacity of young and old BM-MSCs: (A) Representative micrographs from each experimental group showing morphological change after 21 days of differentiation. (B) Results of adipogenic, osteogenic and chondrogenic differentiation. Representative micrographs showing anti-FABP4, Oil Red O, anti-osteocalcin, Alizarin Red-S and anti-aggrecan staining in cultured BM-MSCs from each experimental group. Image collected and cropped by CiteAb from the following publication (https://pubmed.ncbi.nlm.nih.gov/21992089), licensed under a CC-BY license. Not internally tested by R&D Systems.
Detection of Human Osteocalcin by Immunohistochemistry
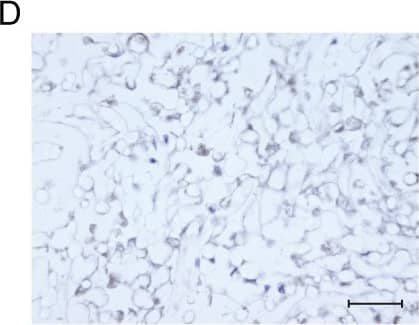
TM-25659 promotes in vivo bone formation of ADSCs. a Schematic description of experimental procedure for in vivo transplantation. Adipose-derived stem cells (ASCs) were initially treated with osteoinductive medium and TM-25659 for consecutive 7 days, then harvested, seeded on porous beta-TCP blocks as a carrier, and subcutaneously transplanted into nude mice (six animals per experimental group). Six weeks later all transplants were harvested for further analysis. b Hematoxylin and eosin (H&E) and Masson trichrome staining revealed markedly enhanced bone formation in samples from ADSCs treated with TM-25659 compared with vehicle-treated samples. Scale bar = 100 μm. c Quantification of bone formation in samples indicated significantly more bone formation in ADSCs treated with TM-25659. Ten images of Masson staining (400×) were randomly selected in the slides from two experimental groups and captured under microscopy. The area of new bone in each image was marked using ImageJ and the percentage of new bone over total area was calculated. d Immunohistochemical staining of osteopontin (OPN) and osteocalcin (OCN) in samples revealed elevated OPN and OCN abundance in samples from ADSCs treated with TM-25659 compared with vehicle-treated samples. Scale bar = 100 μm. Data are shown as fold-change compared with vehicle-treated samples which were defined as 1.0. Data shown here are mean ± SD from two independent experiments; **P < 0.01, by Student’s t test. NB new bone, S scaffold Image collected and cropped by CiteAb from the following publication (https://pubmed.ncbi.nlm.nih.gov/29514703), licensed under a CC-BY license. Not internally tested by R&D Systems.
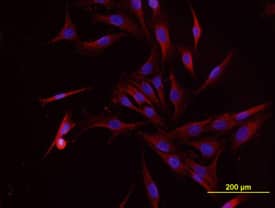
Detection of Human Osteocalcin by Immunocytochemistry/Immunofluorescence
Nano-fiber plugs induce osteogenesis of human MSCs.Healthy donor-derived MSCs were seeded onto plastic plates (A-C) or injected into the nano-fiber plugs (D-I), and then cultured in MSCGM for 1 day (D), 7 days (E, G), 14 days (F, H) and 28 days (A-C, I). Then, the expression levels of RUNX2 (A, D, G), osteocalcin (B, E, H), and DMP-1 (C, F, I) were evaluated immunohistochemically. Representative results of three experiments are shown. (J) Healthy donor-derived MSCs were cultured in MSCGM onto plastic plates (two-dimensional) or nano-fiber plugs (three-dimensional) for 28 days. After RNA extraction, MEPE expression in the 4 groups of healthy donor-derived MSCswas evaluated by real-time PCR. *p<0.05 vs. two-dimensional culture by paired t-test. Scale bars, 50 μm. Image collected and cropped by CiteAb from the following publication (https://dx.plos.org/10.1371/journal.pone.0153231), licensed under a CC-BY license. Not internally tested by R&D Systems.
Detection of Human Osteocalcin by Immunohistochemistry
TM-25659 delivery by oral gavage promotes in vivo bone formation of ADSCs. a Schematic description of the experimental procedure for in vivo transplantation. Adipose-derived stem cells (ASCs) were initially treated with osteoinductive medium for 7 consecutive days and then harvested, seeded on porous beta-TCP blocks as carriers, and subcutaneously transplanted into nude mice (six animals per experimental group). Six weeks later all transplants were harvested for further analysis. b Hematoxylin and eosin (H&E) and Masson trichrome staining revealed markedly enhanced bone formation in samples from animals treated with TM-25659 via oral gavage compared with vehicle-treated samples. Scale bar = 100 μm. c Quantification of bone formation in samples indicated significantly more bone formation in samples from animals treated with TM-25659. Ten images of Masson staining (400×) were randomly selected in the slides from two experimental groups and captured under microscopy. The area of new bone in each image was marked using ImageJ and the percentage of new bone over total area was calculated. d Immunohistochemical staining of osteopontin (OPN) and osteocalcin (OCN) in samples revealed elevated OPN and OCN abundance in samples from animals treated with TM-25659 compared with vehicle-treated samples. Scale bar = 100 μm. Data are shown as fold-change compared with vehicle-treated samples which were defined as 1.0. Data shown here are mean ± SD from two independent experiments; *P < 0.05, **P < 0.01, by Student’s t test. NB new bone, S scaffold Image collected and cropped by CiteAb from the following publication (https://pubmed.ncbi.nlm.nih.gov/29514703), licensed under a CC-BY license. Not internally tested by R&D Systems.
Detection of Human Osteocalcin by Immunohistochemistry
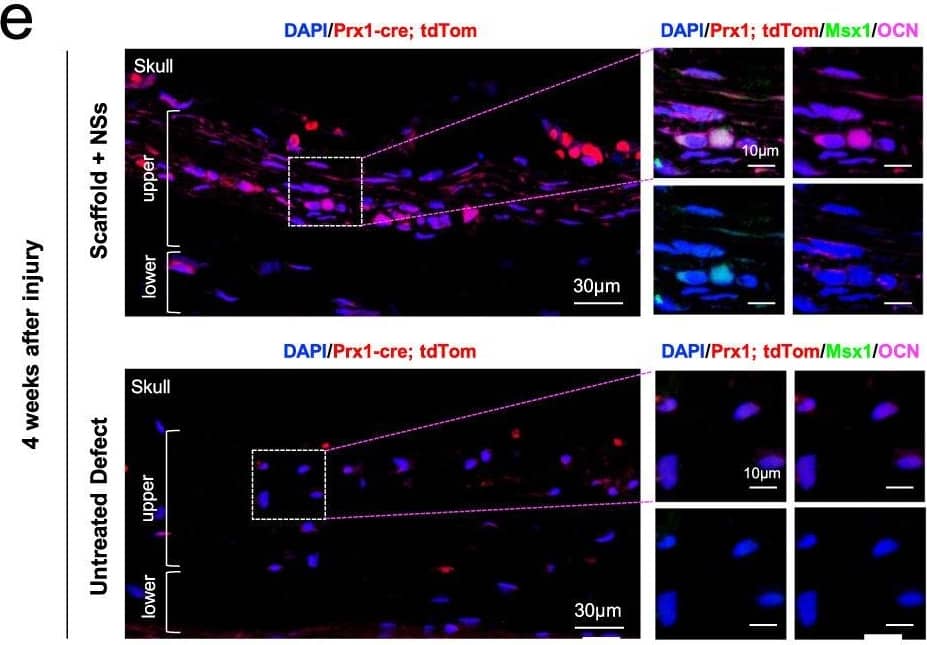
Msx1+ SSCs subset is a source of osteogenesis and closely correlates with endochondral ossification.a Schematic of the assessment of Msx1+ SSCs subset in differentiation hierarchy by Prx1-lineage tracing mice. b, c HE staining of newly formed calvarium tissues in skull bone injury at 2 weeks and 4 weeks after surgery, respectively. d–g Coronal sections of the calvarium tissues from Prx1Cre; RosatdTomato mice co-immunostained with Msx1 and Runx2 (d); Msx1 and OCN (e); Msx1 and ACAN (f); Msx1 and COL2 (g); Scale bars: low magnification: 30 μm, high magnification: 10 μm. At least three times of experiments were repeated independently. Image collected and cropped by CiteAb from the following open publication (https://pubmed.ncbi.nlm.nih.gov/36064711), licensed under a CC-BY license. Not internally tested by R&D Systems.
Detection of Human Osteocalcin by Immunohistochemistry
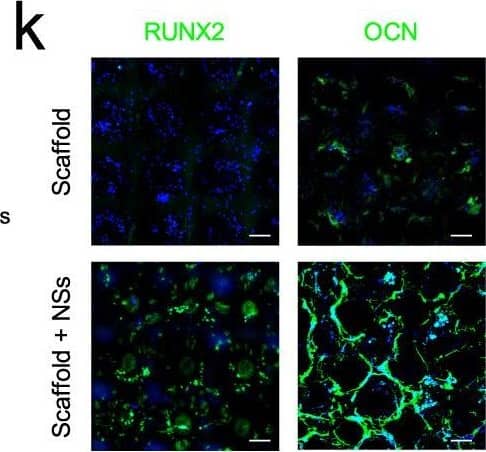
3D printed hydrogel scaffold with NSs enhances in vitro expansion and osteogenic potential of MSCs.a Schematic diagram of NSs-loaded 3D printing gel scaffold by DLP technology. b Bright field image of MSCs distribution and cell morphology on the surface and inside of the gel scaffold and NSs-loaded gel scaffold for 3 days and 7 days, bar = 200 μm. c Live/Dead staining (Green, live cells; Red, dead cells) of MSCs expanded on gel scaffold and NSs-loaded gel scaffold for 7 days and 14 days, bar = 50 μm. d Bright field image and Live/Dead staining (bar = 200 μm, 50μm); e Gross view and f ALP staining, bar = 100μm, Exact p value calculated with unpaired t-test: ***p = 0.0003, n = 5 biologically independent samples; g immunostaining of RUNX2 and OCN after 7 days’ osteogenic differentiation of expanded MSCs on gel scaffold after 7 days (bar = 30 μm). h Bright field image and Live/Dead staining (bar = 200 μm, 50 μm); i Gross view and j Alizarin Red S staining, bar = 100 μm, Exact p value calculated with unpaired t-test: ***p = 0.0004, n = 4 biologically independent samples; k immunostaining of RUNX2 and OCN after 14 days’ osteogenic differentiation of expanded MSCs on gel scaffold after 7 days (bar = 30 μm). Bone marrow stem cells are isolated from orthopedic individuals with written informed consent. All data represent mean ± SEM, and source data are provided as a Source Data file. At least three times of experiments were repeated independently. Image collected and cropped by CiteAb from the following open publication (https://pubmed.ncbi.nlm.nih.gov/36064711), licensed under a CC-BY license. Not internally tested by R&D Systems.

