Detection of Mouse IL‑1 beta/IL‑1F2 by Simple WesternTM.
Simple Western lane view shows lysates of RAW 264.7 mouse monocyte/macrophage cell line untreated (-) or treated (+) with 10 µg/mL LPS for 24 hours, loaded at 0.5 mg/mL. A specific band was detected for IL-1 beta/IL-1F2 at approximately 40 kDa (as indicated) using 2.5 µg/mL of Goat Anti-Mouse IL-1 beta/IL-1F2 Antigen Affinity-purified Polyclonal Antibody (Catalog # AF-401-NA) followed by 1:50 dilution of HRP-conjugated Anti-Goat IgG Secondary Antibody (
HAF109). This experiment was conducted under reducing conditions and using the 12-230 kDa separation system.
Cell Proliferation Induced by IL‑1 beta/IL‑1F2 and Neutralization by Mouse IL-1 beta/IL-1F2 Antibody.
Recombinant Mouse IL-1 beta/IL-1F2 (
401-ML) stimulates proliferation in the the D10.G4.1 mouse helper T cell line in a dose-dependent manner (orange line) as measured by Resazurin (
AR002). Proliferation elicited by Recombinant Mouse IL-1 beta/IL-1F2 (50 pg/mL) is neutralized (green line) by increasing concentrations of Goat Anti-Mouse IL-1 beta/IL-1F2 Antigen Affinity-purified Polyclonal Antibody (Catalog # AF-401-NA). The ND
50 is typically ≤ 0.25 µg/mL.
Detection of IL-1 beta/IL-1F2 in Mouse Intestine.
IL-1 beta/IL-1F2 was detected in perfusion fixed paraffin-embedded sections of Mouse Intestine using Goat Anti-Mouse IL-1 beta/IL-1F2 Antigen Affinity-purified Polyclonal Antibody (Catalog # AF-401-NA) at 5 µg/mL for 1 hour at room temperature followed by incubation with the Anti-Sheep IgG VisUCyte™ HRP Polymer Antibody (Catalog #
VC006). Before incubation with the primary antibody, tissue was subjected to heat-induced epitope retrieval using VisUCyte Antigen Retrieval Reagent-Basic (Catalog #
VCTS021). Tissue was stained using DAB (brown) and counterstained with hematoxylin (blue). Specific staining was localized to cytoplasm in epithelial cells. View our protocol for IHC Staining with VisUCyte HRP Polymer Detection Reagents.
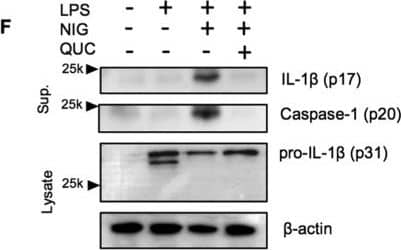
Detection of Mouse IL-1 beta/IL-1F2 by Western Blot
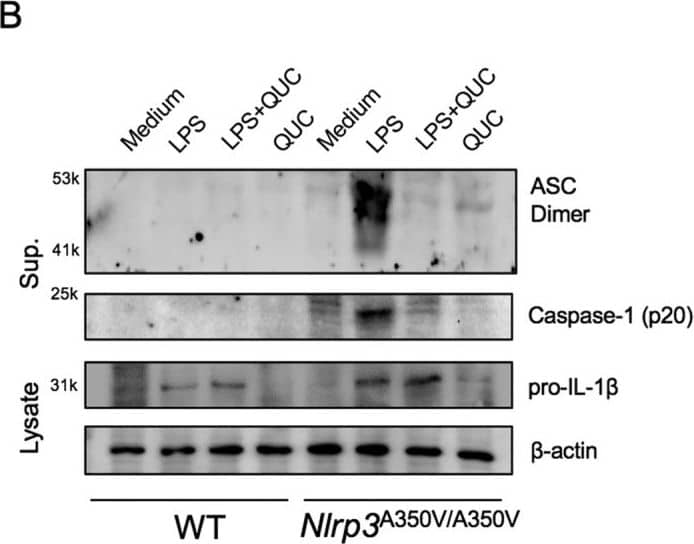
Quercetin inhibits auto-reactive NLRP3 inflammasome.(A) IL-1 beta concentrations in Nlrp3A350V/A350V and WT BMDM culture supernatants primed with LPS (500 ng/ml) for 90 min and treated with quercetin 1 h after LPS. (B) Supernatants of BMDM were analyzed by anti-ASC, anti-Caspase-1 immunoblotting. Lysates of BMDM were analyzed by anti-IL-1 beta and anti-beta -actin immunoblotting. Data shown are representative of two or more experiments (means ± SD) ***p < 0.001. Image collected and cropped by CiteAb from the following publication (https://pubmed.ncbi.nlm.nih.gov/28148962), licensed under a CC-BY license. Not internally tested by R&D Systems.
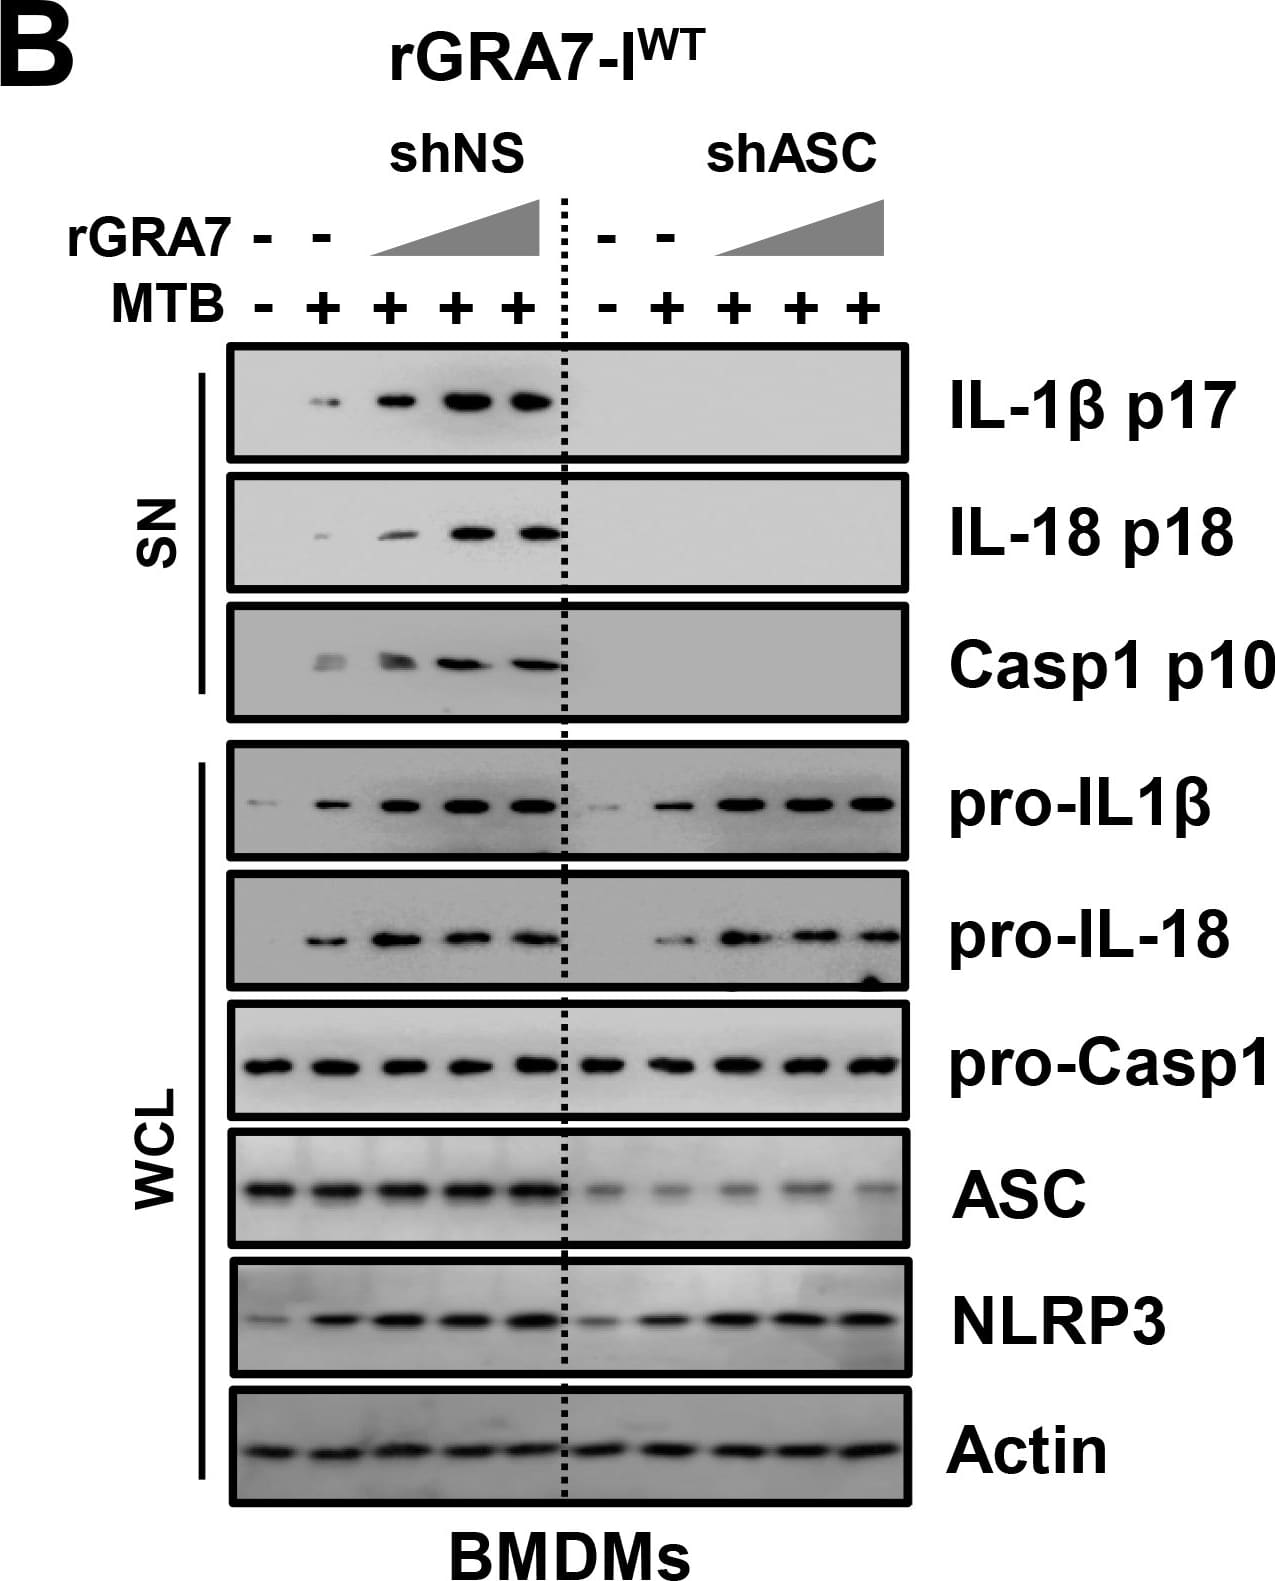
Detection of Mouse IL-1 beta/IL-1F2 by Western Blot
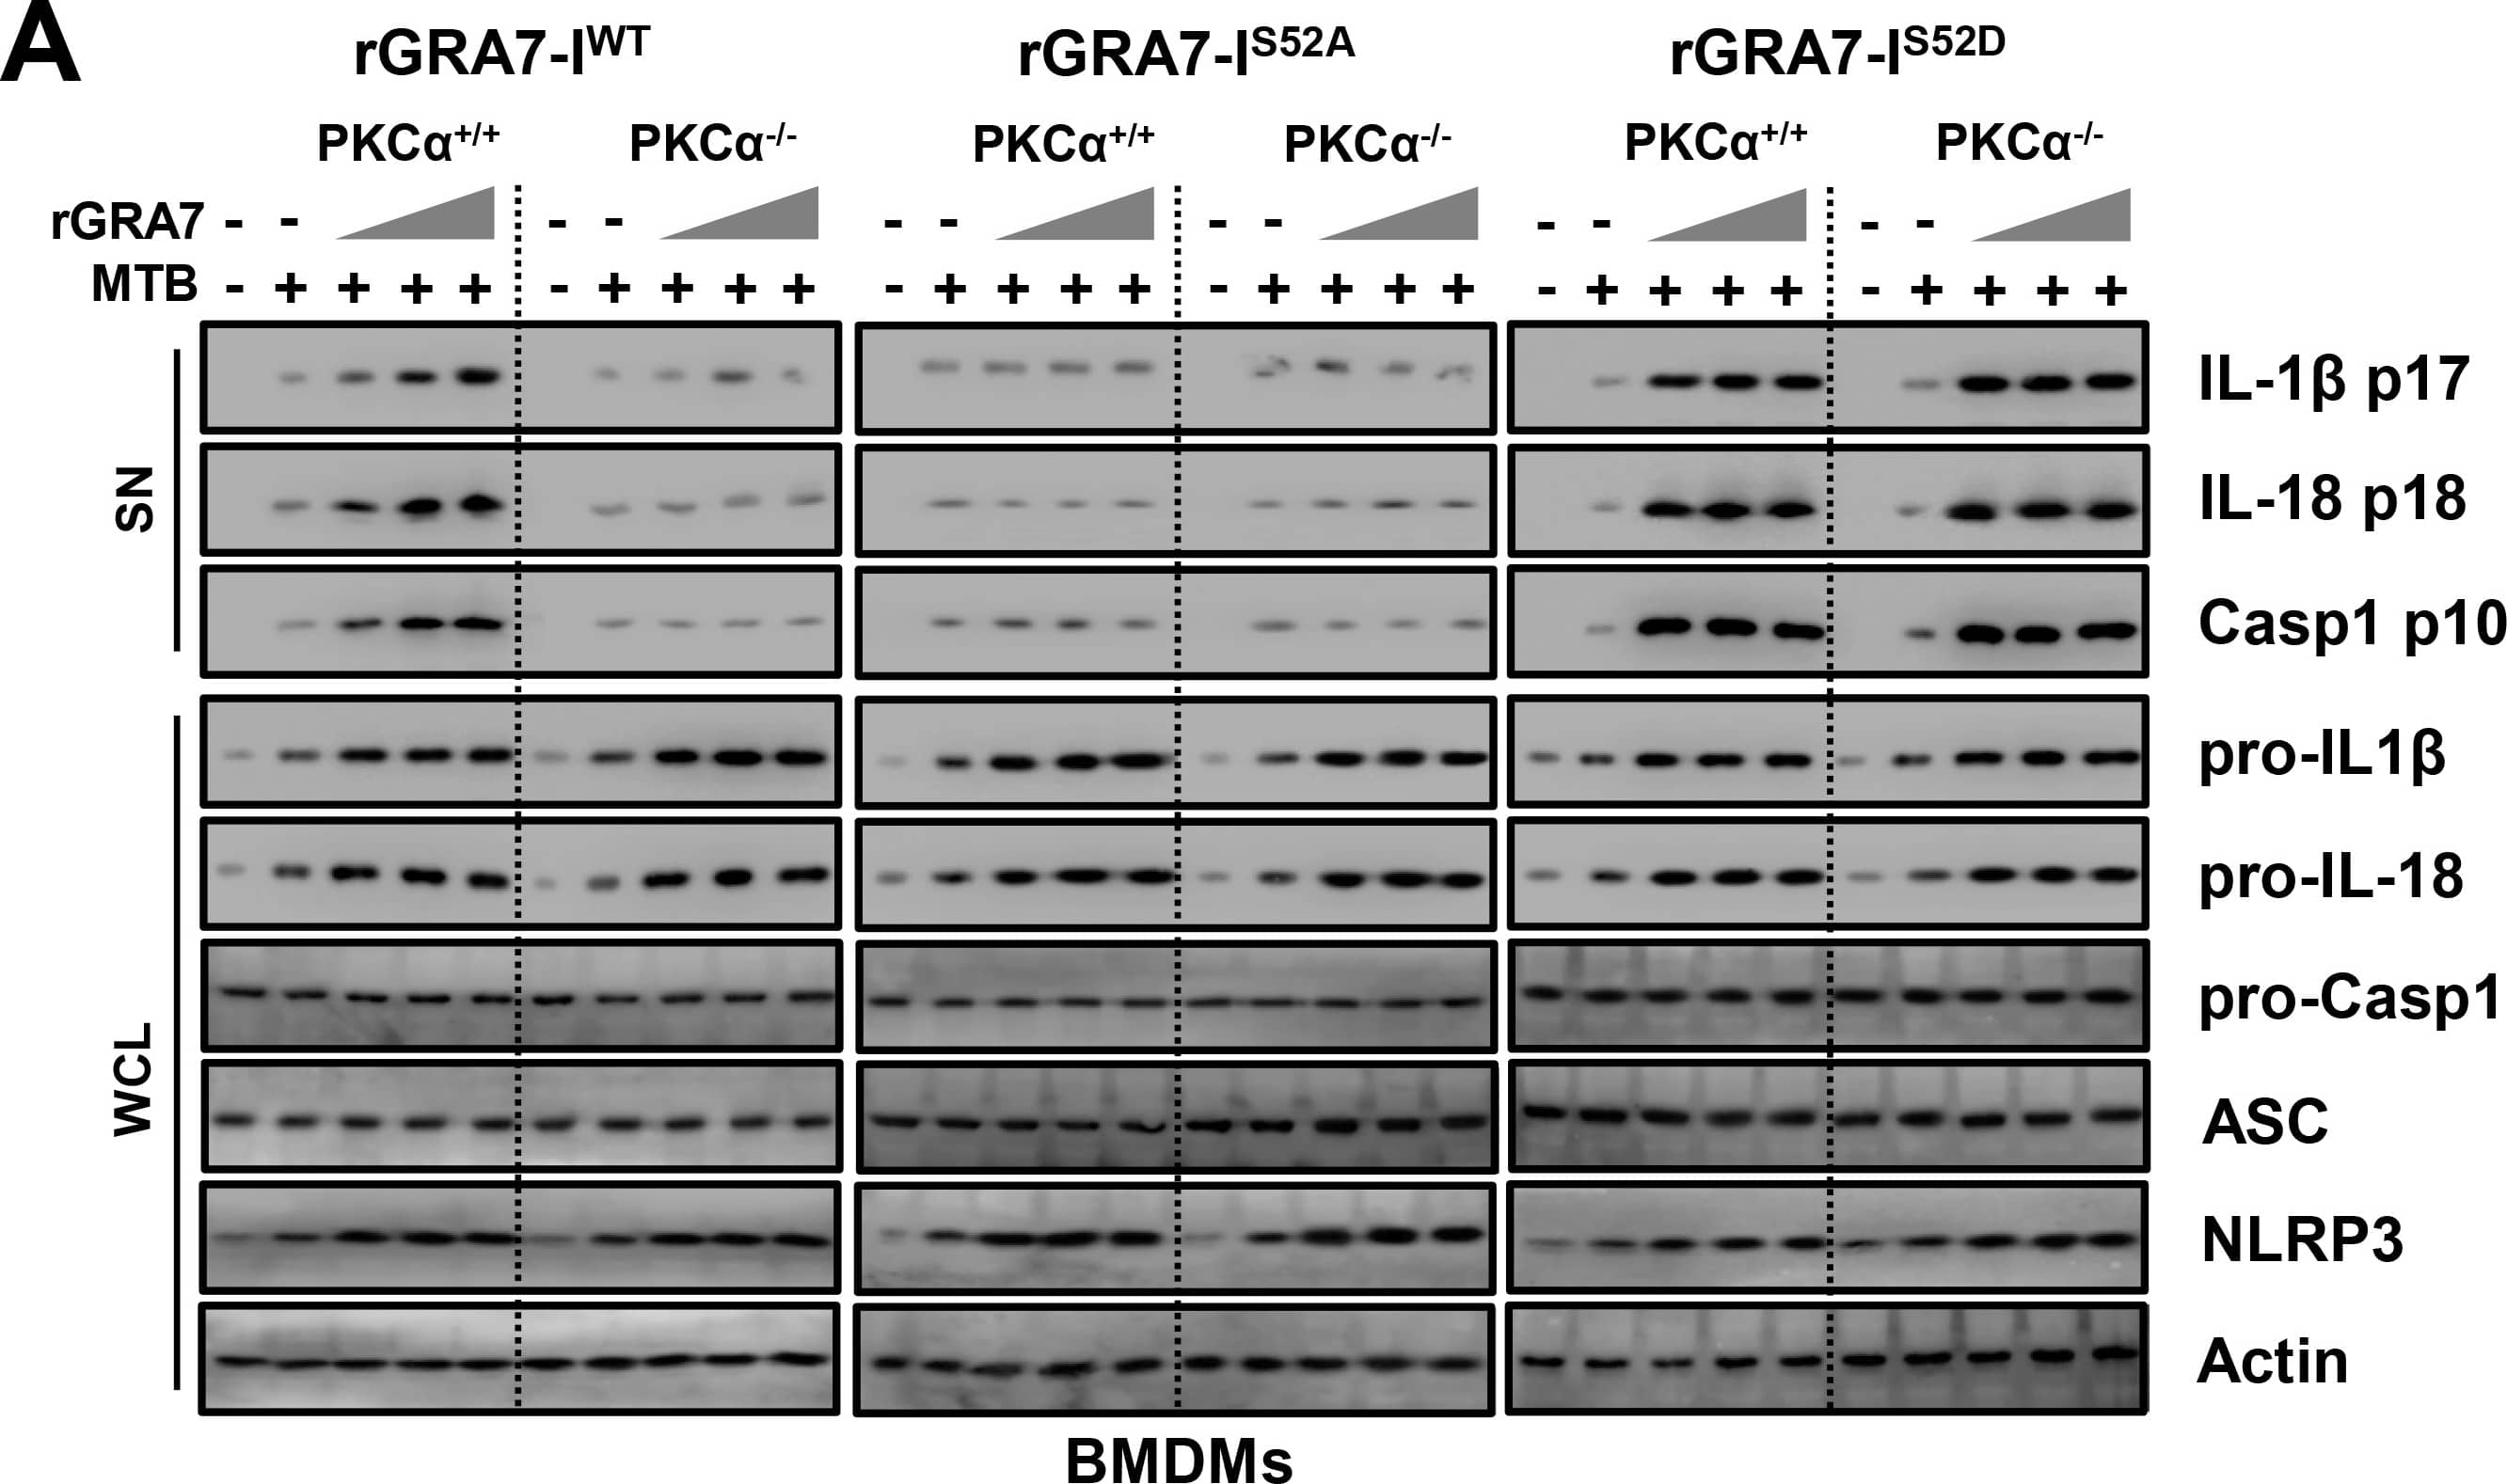
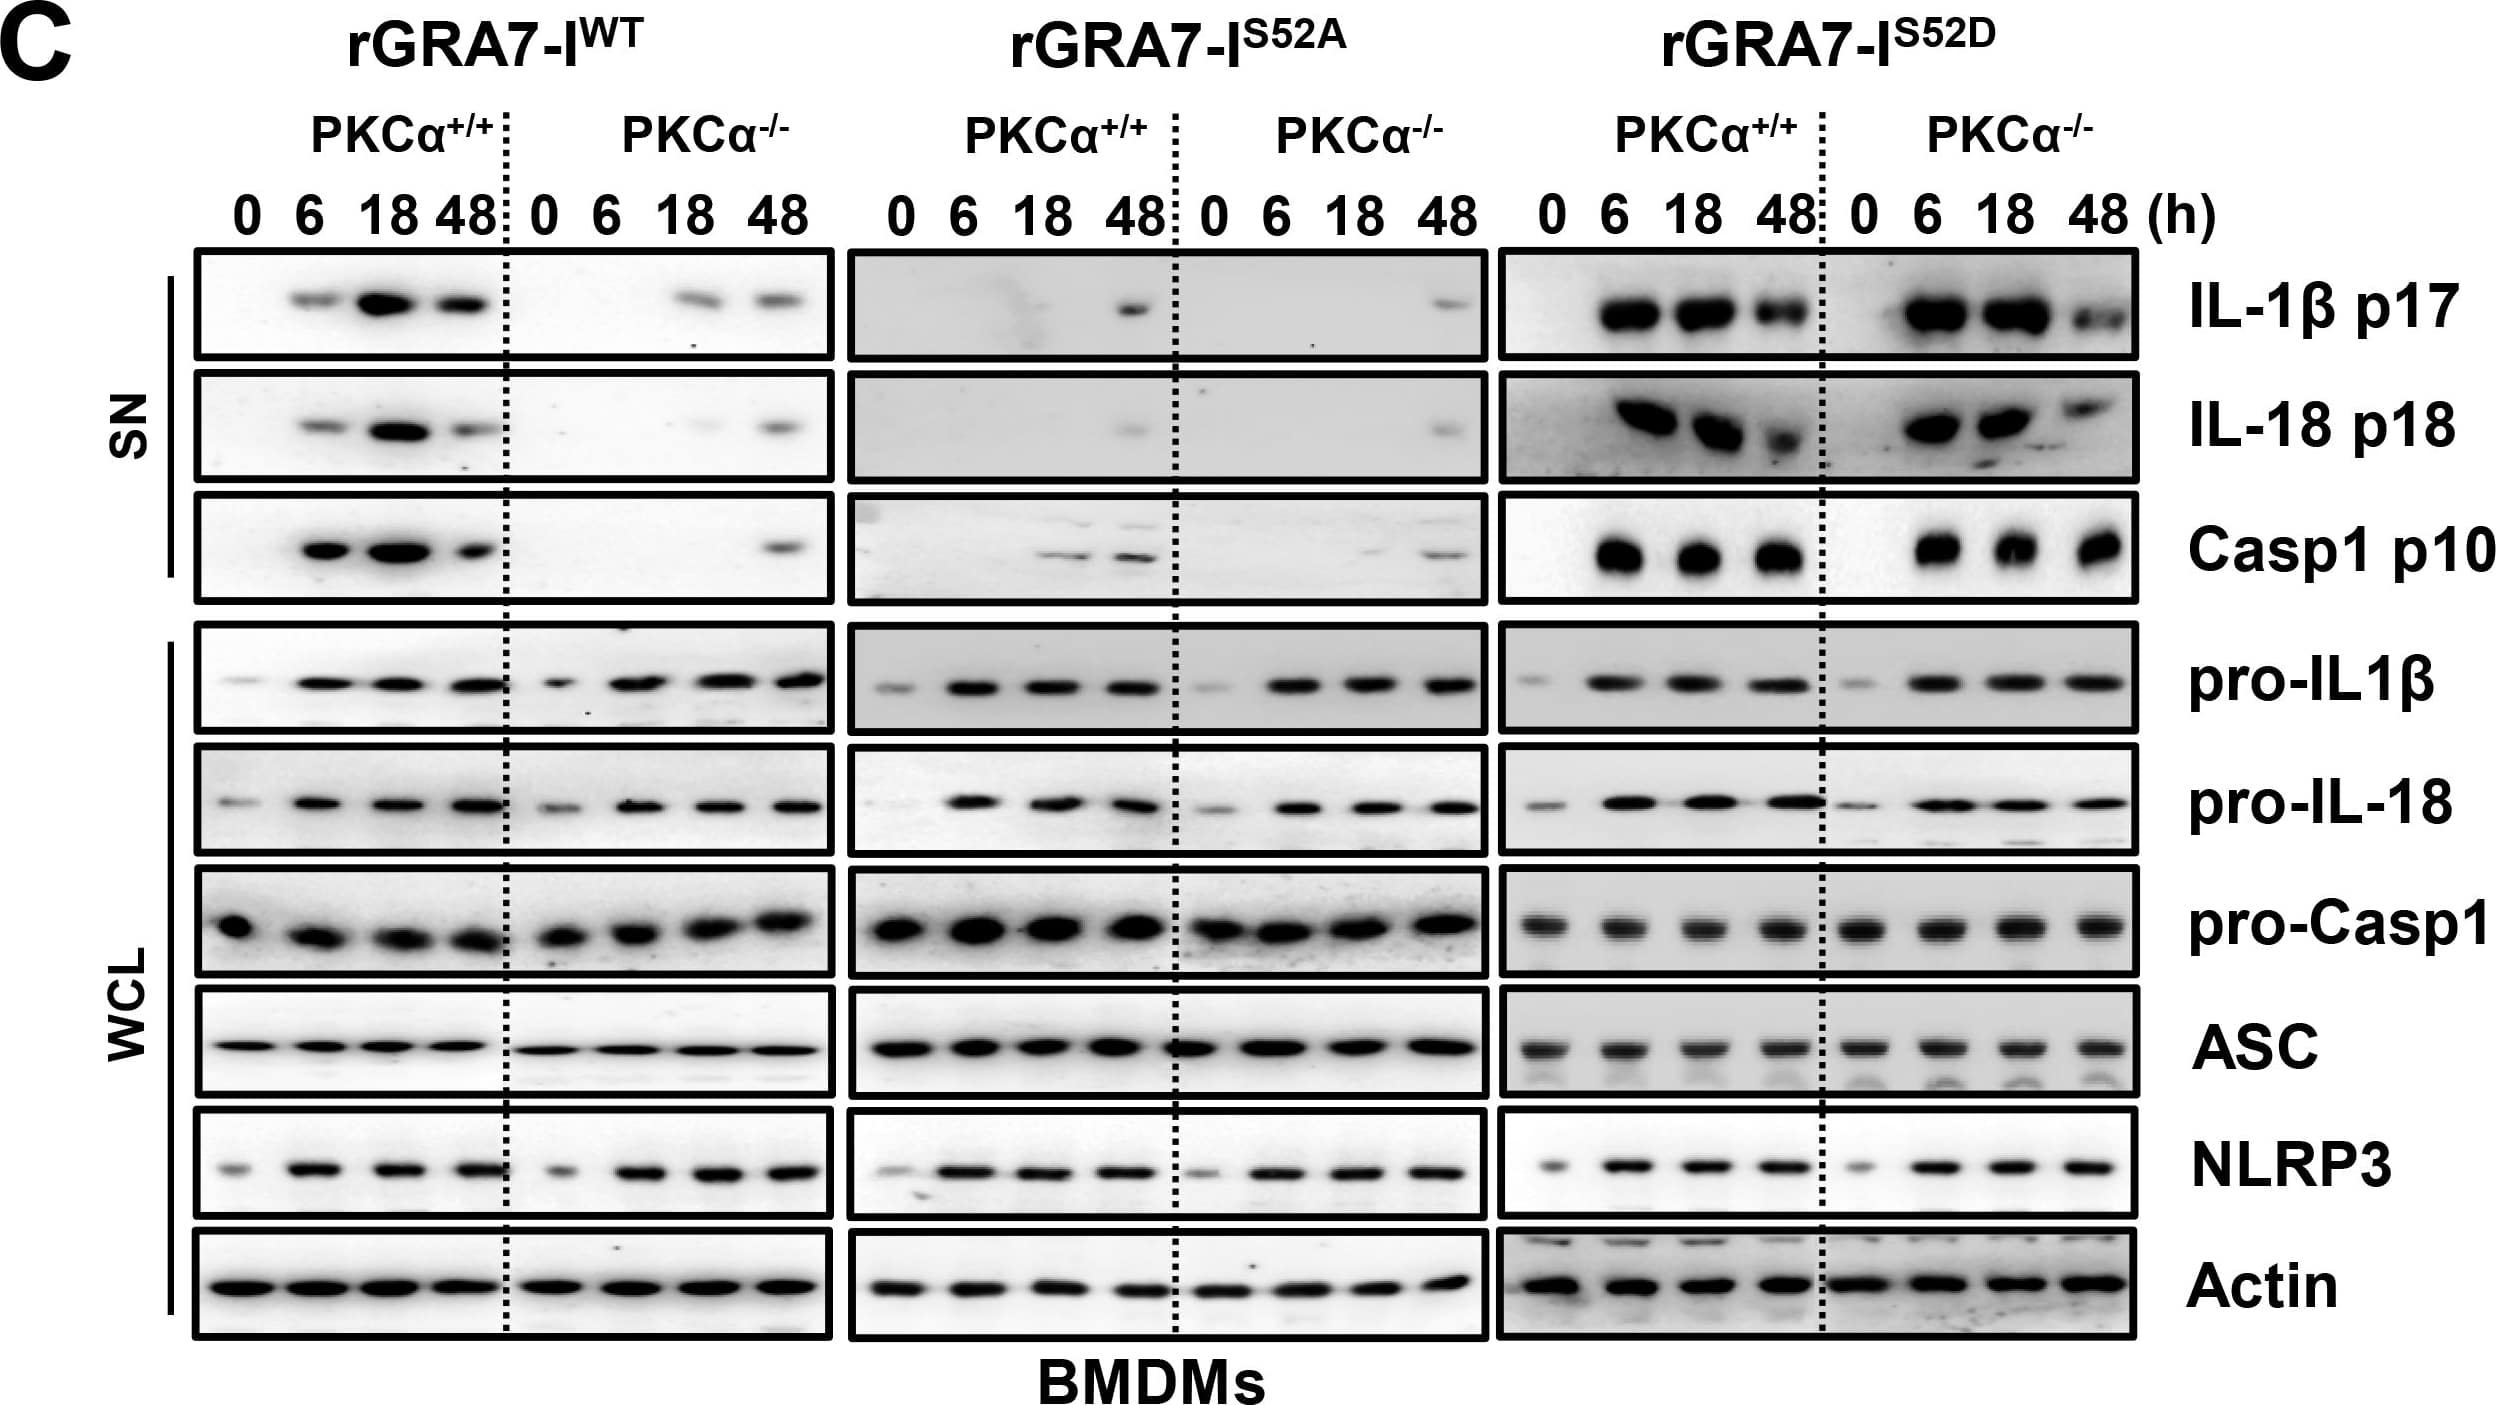
GRA7-I-induced inflammasome activation was required for antimicrobial activity in MTB-infected macrophages.(A and B) BMDMs from PKC alpha+/+ and PKC alpha-/- mice (A) and BMDMs were transduced with lentivirus-shRNA-NS or lentivirus-shRNA-ASC for 2 days (B) infected with MTB (MOI = 1) for 4 h and then stimulated with rGRA7 (1, 5, 10 μg/ml) and its mutants for 18 h. IB analysis for IL-1 beta p17, IL-18 p18, or caspase-1 p10 in supernatants (SN), ASC, NLRP3, pro-IL-1 beta, pro-IL-18, or pro-caspase-1 in whole-cell lysates (WCL). Actin was used as a loading control. (C and D) Intracellular survival of MTB was assessed by CFU assay. BMDMs were infected with MTB for 4 h, followed by treatment with rGRA7, and then lysed to determine intracellular bacterial loads. The data are representative of five independent experiments with similar results (A and B). Data shown are the mean ± SD of five experiments (C and D). Significant differences (*P < 0.05; **P < 0.01; ***P < 0.001) compared with rVector. CFU, colony-forming units. ns, not significant. Image collected and cropped by CiteAb from the following publication (https://dx.plos.org/10.1371/journal.ppat.1006126), licensed under a CC-BY license. Not internally tested by R&D Systems.
Detection of Mouse IL-1 beta/IL-1F2 by Western Blot
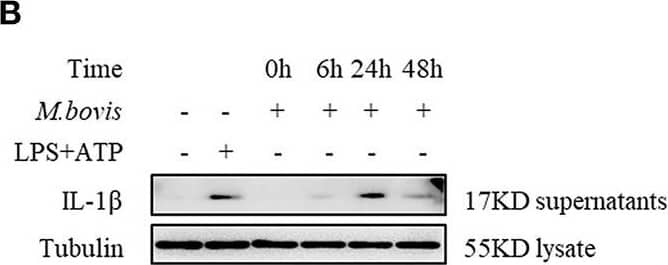
M. bovis-induced inflammasome activation requires ERS. (A) Immunoblot analysis at different time-points of Bip and p-IRE1 alpha in lysates of BMDMs infected with M. bovis (MOI 10). (B) Immunoblot analysis at different time-points of IL-1 beta in supernatants of BMDMs infected with M. bovis (MOI 10). (C) ELISA for IL-1 beta analysis from supernatants of BMDMs infected with M. bovis (MOI 10). (D) IL-1 beta immunoblot analysis of supernatants from BMDM infected for 24 h with M. bovis (MOI 10) in the presence or absence of 4-PBA. (E) ELISA for IL-1 beta quantification from supernatants of BMDMs treated with or without 4-PBA for 1 h and then infected with M. bovis (MOI 10) for 24 h. ELISA for (F) TNF- alpha and (G) IL-6 detection in supernatants from M. bovis (MOI 10) infected BMDMs. ELISA for (H) TNF-alpha and (I) IL-6 detection from supernatants of BMDMs treated with or without 4-PBA for 1 h and then infected with M. bovis (MOI 10) for 24 h. TM, tunicamycin, positive control for ERS induced mitochondrial damage, 10 μg/mL; LPS+ATP, positive control for inflammasome activation, 200 ng/mL, and 1 mM, respectively; LPS, positive control for TNF-alpha and IL-6 production, 200 ng/mL; UNT, untreated; 4-PBA, 4-phenyl butyric acid, ERS inhibitor, 5 mM; MOI, multiplicity of infection. For (C,F,G), Data are representative of at least three independent experiments, each performed in triplicate for WB. The results are shown are the mean ± SD. The asterisks indicate statistically significant differences compared with untreated cells (*P < 0.05, **P < 0.01, ***P < 0.001, n.s., not significant). P-values were obtained by using one-way ANOVA followed by post-hoc Turkey' comparison test. For (E,H,I), data are representative of at least three independent experiments. The results are shown as the mean ± SD. *P < 0.05, **P < 0.01, ***P < 0.001, n.s., not significant. P-values were analyzed using Student's t-test. Image collected and cropped by CiteAb from the following publication (https://pubmed.ncbi.nlm.nih.gov/30846986), licensed under a CC-BY license. Not internally tested by R&D Systems.
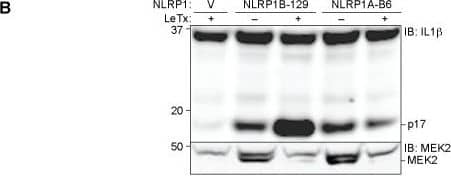
Detection of Human IL-1 beta/IL-1F2 by Western Blot
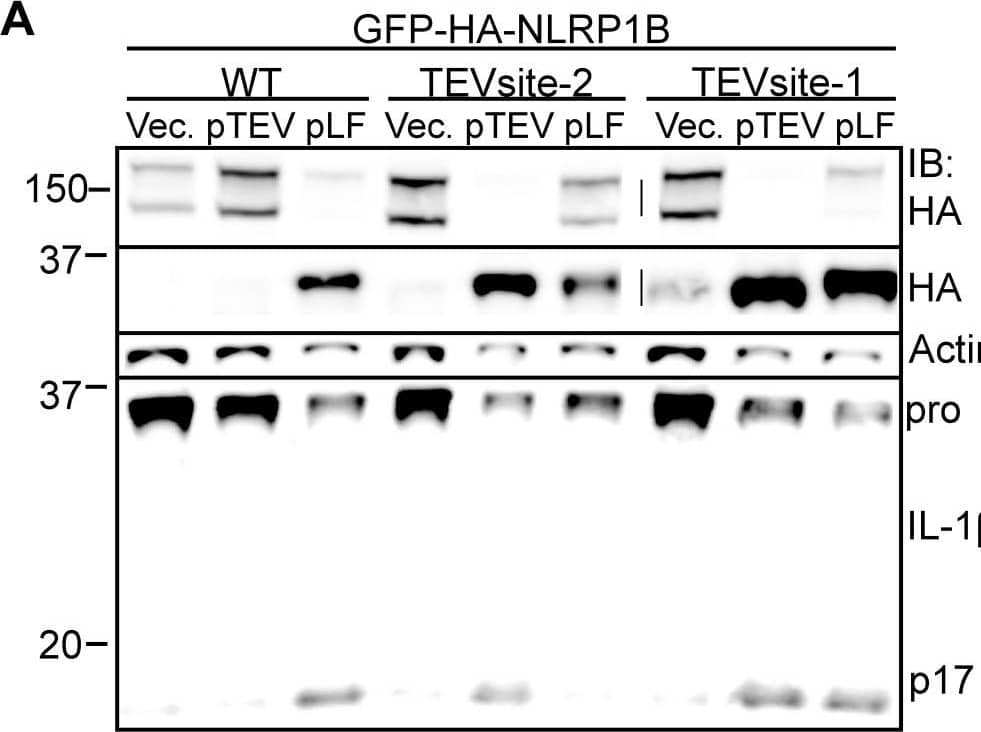
NLRP1A is activated by N-terminal proteolysis.(A) The amino acid sequence of the first 244 residues of NLRP1AB6 was aligned to NLRP1B129 and NLRP1BB6. The arrow above the alignment indicates the LF-cleavage site in NLRP1B129. (B) 293T cells were transfected for 36h with 200ng empty vector (V) or plasmids pcDNA3.1-HA-NLRP1B129 or -NLRP1AB6-MYC (CMV promoter) along with 200ng mCASP1 and 200ng mIL-1 beta expression vectors. Cells were treated overnight with anthrax lethal toxin (LeTx, 1μg/ml) 24h post-transfection, and then lysates were analyzed by immunoblotting (IB) with the indicated antibodies. (C) 293T cells were transfected for 36h with plasmids encoding 400ng GFP-HA-NLRP1B129 or GFP-HA-NLRP1AB6 (under the control of the LTR promoter in pMSCV) or with mutants engineered to contain an N-terminal TEV protease site. Cells were also co-transfected with 100ng empty vector (V) or plasmids encoding TEV-protease (pTEV) or lethal factor protease (pLF), plus 300ng empty pMSCV. (D) To assess IL-1 beta cleavage, cells were transfected as in C, but with 8ng of GFP-HA-NLRP1B and co-transfected with vectors encoding 200ng mCASP1 and 200ng mIL-1 beta. For panels B-D, data shown are representative of at least three similar experiments. Image collected and cropped by CiteAb from the following publication (https://dx.plos.org/10.1371/journal.ppat.1006052), licensed under a CC-BY license. Not internally tested by R&D Systems.
Detection of Mouse IL-1 beta/IL-1F2 by Western Blot
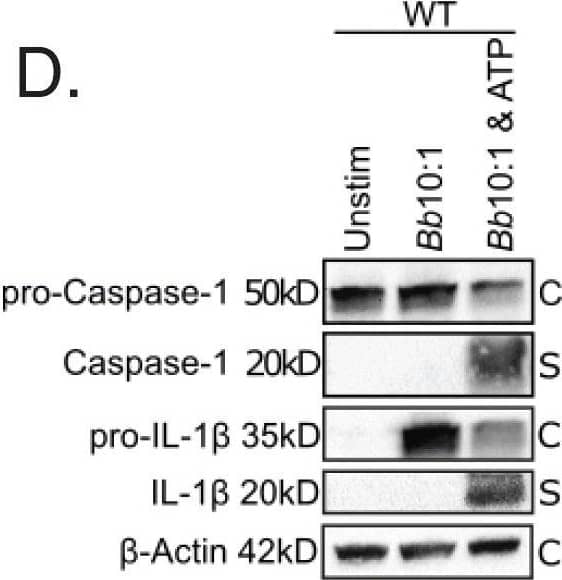
Colocalization of phagosome markers with internalized Bb in WT and MyD88−/− BMDMs. a-b Confocal 40x images of WT (a) and MyD88−/− (b) BMDMs after 6 h stimulation with Bb at MOI 10:1, depicting colocalization of Bb-containing phagosomes with LAMP-1. White box indicates phagosome depicted in inset. Graph shows the intensity of each indicated pixel across the white line (distance on x-axis). Green is Bb, red is LAMP-1 and yellow is actin. c Quantitation of colocalization between Bb and LAMP-1 in 10 phagosomes of WT (black dots) and MyD88−/− (red dots) BMDMs by measuring intensity difference between LAMP-1 staining and Bb staining. d Western blot of protein lysate isolated from WT BMDMs after 6 h stimulation with Bb +/− ATP (C = cell lysate, S = supernatant) Image collected and cropped by CiteAb from the following publication (https://pubmed.ncbi.nlm.nih.gov/34000990), licensed under a CC-BY license. Not internally tested by R&D Systems.
Detection of Mouse IL-1 beta/IL-1F2 by In vivo assay
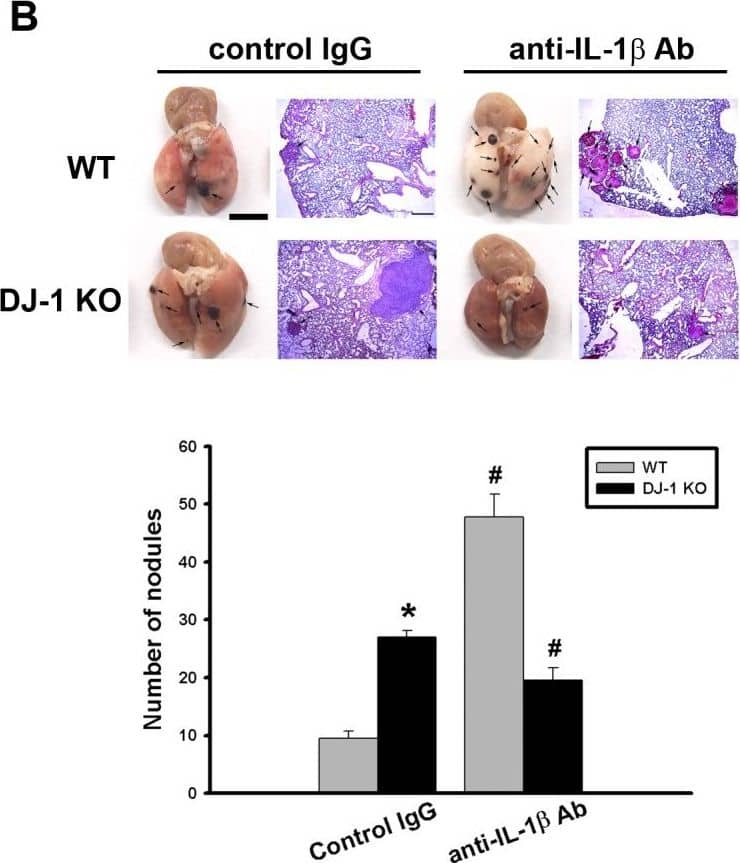
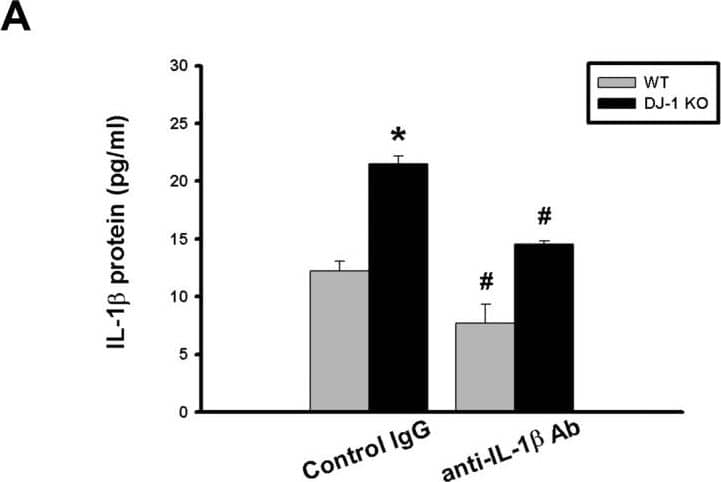
Differential effects of IL-1 beta neutralization on melanoma lung nodules in WT and DJ-1 KO mice.(A) IL-1 beta antibody (10μg) or control IgG was intravenously injected into mice once. The melanoma cells (6×10⁴) were intravenously injected 30 minutes later. The mice were sacrificed three weeks later. Bar chart showed that the anti-IL-1 beta neutralizing antibody can effectively lower serum IL-1 beta levels as compared with control IgG in both WT and DJ-1 KO mice. Note that serum IL-1 beta levels were higher in DJ-1 KO mice than those in WT mice. (B) Inhibition of IL-1 beta neutralization on lung nodules formation in DJ-1 KO mice. Upper panels: melanoma nodules in lungs of WT (top) and KO (bottom) mice treated with control IgG (left) or neutralizing anti-IL-1 beta antibody (right). For each experimental condition, the gross and microscopic morphologies of tumor nodules are indicated by arrows, and are shown at left and right sites, respectively. Scale bars: 0.5 mm for lung photographs and 0.5 mm for H&E staining. Lower panel: Bar chart showed the summarized results of lung nodule numbers in WT and DJ-1 KO mice. Note that IL-1 beta neutralization enhanced and suppressed melanoma nodules formation in WT and DJ-1 KO mice, respectively. Data are presented as mean ± S.E.M. n = 5 for each group, * p < 0.05 compared with control IgG-treated WT mice, # p<0.05 compared with respective control IgG in WT and DJ-1 KO mice. Image collected and cropped by CiteAb from the following publication (https://dx.plos.org/10.1371/journal.pone.0115827), licensed under a CC-BY license. Not internally tested by R&D Systems.
Detection of Mouse IL-1 beta/IL-1F2 by Western Blot
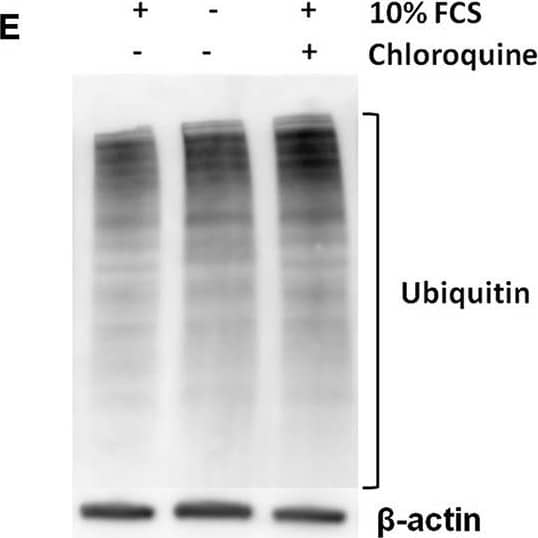
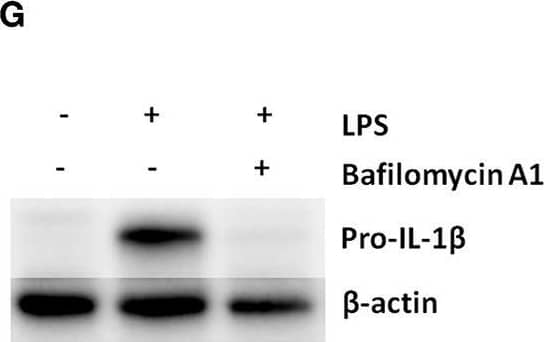
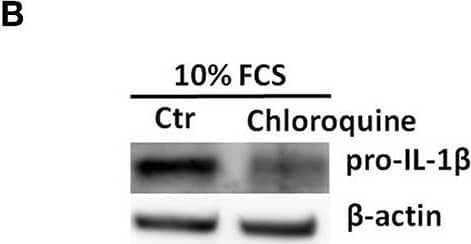
Pro-IL-1 beta degradation is induced by the autophagy inhibitors chloroquine and bafilomycin A, and by the proteasome activator betulinic acid. (A) Chloroquine selectively attenuates IL-1 beta release from cardiac fibroblasts. The cells were incubated with LPS and/or 20 μM chloroquine phosphate as indicated for 18 h, then activated with 3 mM ATP for 60 min. IL-1 beta, TNF, MIP-2, and IL-6 were quantified in the conditioned media (n = 3). (B,C) Cardiac fibroblasts were incubated with LPS for 18 h with or without 20 μM chloroquine phosphate and pro-IL-1 beta quantified with western blot (n = 3). (D) Pro-IL-1 beta mRNA expression was quantified with qPCR (n = 3). (E,F) Cardiac fibroblasts were incubated with LPS for 20 h with or without 10% FCS or 20 μM chloroquine phosphate as indicated. The amount of total ubiquitinated protein was quantified with western blot (n = 4). (G,H) Cardiac fibroblasts were incubated with 10% FCS with or without 10 ng/mL LPS and/or 100 nM bafilomycin A1 for 20 h. Pro-IL-1 beta was quantified with western blot. (I,J) Cardiac fibroblasts were incubated with 10% FCS with or without 10 ng/mL LPS and/or 20 μM betulinic acid as indicated for 20 h. Pro-IL-1 beta was quantified with western blot. All columns are mean with SEM. *p < 0.05, **p < 0.01 (paired student t-test). Image collected and cropped by CiteAb from the following publication (https://pubmed.ncbi.nlm.nih.gov/31244838), licensed under a CC-BY license. Not internally tested by R&D Systems.
Detection of Human IL-1 beta/IL-1F2 by Western Blot
The B6 variant of NLRP1B is not cleaved by LF but can form an inflammasome in response to proteolysis.(A) The amino acid sequence of the first 244 residues of NLRP1BB6 was aligned to the homologous sequence of NLRP1B129. The arrow above the alignment indicates the LF-cleavage site in NLRP1B129. Asterisks indicate sites of amino acid identity. (B) For detection of NLRP1B expression, 293T cells were transfected with the indicated amounts of and empty vector (V) or plasmids encoding GFP-HA-NLRP1B129 or GFP-HA-NLRP1BB6 (construct schematics and the predicted molecular weight of each protein is depicted in the upper panel). Cells were treated overnight with anthrax lethal toxin protein (LeTx, 1μg/ml) 24h post-transfection, and then lysates were analyzed by immunoblotting (IB) with the indicated antibodies. For NLRP1 expression and cleavage, CASP1 and IL1B were omitted to prevent cell death and resulting apparent differences of expression. For blots probed with anti-HA (NLRP1B), the lysates were not boiled prior to loading to prevent aggregation and smearing of full-length and FIIND-processed NLRP1B on the immunoblot. To visualize the N-terminal processed form of NLRP1B, the lysates were boiled and resolved on a separate gel. (C) 293T Cells were transfected with the same amount of titrated NLRP1B encoding plasmid and treated as in B, but transfections also included plasmids encoding mouse CASP1 (200ng), IL-1 beta (200ng) and 200ng of empty vector. (D) For detection of NLRP1B expression, 293T cells were transfected for 36h with 250ng of plasmids encoding WT 129 or B6 NLRP1B or mutants engineered to express the TEV-protease site. Each plasmid was co-transfected with either 100ng of empty vector (V) or plasmids encoding TEV-protease (pTEV) or lethal factor protease (pLF), supplemented with 300ng empty vector (pMSCV). Cells were not treated with LeTx and lysates were analyzed by immunoblotting as in (B). (E) Cells were treated as in C, but with 8ng of plasmids encoding NLRP1B, along with 200ng of plasmids encoding mCASP-1 and mIL-1 beta, and 200ng empty vector to normalize plasmid quantities. Lower quantities of NLRP1B were transfected as compared to panel D so to avoid spontaneous NLPR1B activation. For panels B-E, data shown are representative of at least three similar experiments. Image collected and cropped by CiteAb from the following publication (https://dx.plos.org/10.1371/journal.ppat.1006052), licensed under a CC-BY license. Not internally tested by R&D Systems.
Detection of Mouse IL-1 beta/IL-1F2 by Western Blot
Pro-IL-1 beta degradation is induced by the autophagy inhibitors chloroquine and bafilomycin A, and by the proteasome activator betulinic acid. (A) Chloroquine selectively attenuates IL-1 beta release from cardiac fibroblasts. The cells were incubated with LPS and/or 20 μM chloroquine phosphate as indicated for 18 h, then activated with 3 mM ATP for 60 min. IL-1 beta, TNF, MIP-2, and IL-6 were quantified in the conditioned media (n = 3). (B,C) Cardiac fibroblasts were incubated with LPS for 18 h with or without 20 μM chloroquine phosphate and pro-IL-1 beta quantified with western blot (n = 3). (D) Pro-IL-1 beta mRNA expression was quantified with qPCR (n = 3). (E,F) Cardiac fibroblasts were incubated with LPS for 20 h with or without 10% FCS or 20 μM chloroquine phosphate as indicated. The amount of total ubiquitinated protein was quantified with western blot (n = 4). (G,H) Cardiac fibroblasts were incubated with 10% FCS with or without 10 ng/mL LPS and/or 100 nM bafilomycin A1 for 20 h. Pro-IL-1 beta was quantified with western blot. (I,J) Cardiac fibroblasts were incubated with 10% FCS with or without 10 ng/mL LPS and/or 20 μM betulinic acid as indicated for 20 h. Pro-IL-1 beta was quantified with western blot. All columns are mean with SEM. *p < 0.05, **p < 0.01 (paired student t-test). Image collected and cropped by CiteAb from the following publication (https://pubmed.ncbi.nlm.nih.gov/31244838), licensed under a CC-BY license. Not internally tested by R&D Systems.
Detection of Mouse IL-1 beta/IL-1F2 by Western Blot
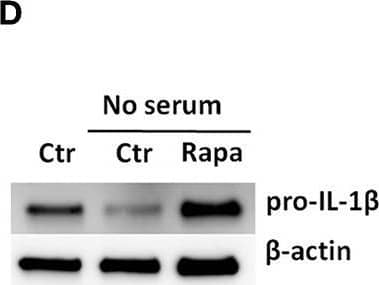
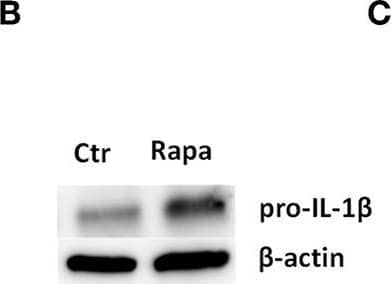
Rapamycin increases pro-IL-1 beta protein levels, rescues serum starvation-induced pro-IL-1 beta degradation, inhibits mTOR but induces no autophagy in LPS-stimulated cardiac fibroblasts. (A) IL-1 beta release was quantified in conditioned media from cardiac fibroblasts primed with 10 ng/mL LPS for 20 h with or without 500 nM rapamycin, as indicated, prior to activation with 3 mM ATP for 60 min. (B,C) Fibroblasts were primed with 10 ng/mL LPS for 20 h with or without 500 nM rapamycin and pro-IL-1 beta western blot performed (n = 3). (D,E) Control cells were incubated with 10% FCS, while serum deprived cells were incubated with or without 500 nM Rapamycin. Protein expressions were quantified with western blot (n = 4) (F,G). IL-1 beta and TNF-alpha were quantified in conditioned media from cardiac fibroblasts incubated with or without 10% FCS and 500 nM rapamycin and stimulated with LPS 10 ng/mL for 20 h prior to activation with 3 mM ATP for 60 min as indicated (n = 6) (H,I) IL-1 beta and TNF mRNA were quantified with PCR. (J–L) Cardiac fibroblasts were incubated with 10% FCS with or without 10 ng/mL LPS and/or 500 nM rapamycin for 20 h and mTOR (K) and p70 S6 kinase (L) activity were quantified with western blot (n = 5). (M,N) Cardiac fibroblasts primed with LPS (10 ng/mL) were incubated with 10% FCS (control) or no serum for 4 h. Cells were labeled with anti-LC3B and Hoechst and whole slides scanned with an automated immunofluorescence microscope. LC3B puncta in all cells in were automatically counted and ratio to number of Hoechst-labeled kernels calculated. Columns are mean with SEM of paired data normalized to control = 1 (n = 5). (O) Cardiac fibroblasts were incubated with 10% FCS, 10 ng/mL LPS, and/or 5 mM 3-methyladenine (3-MA) for 18 h and/or ATP 3 mM for 60 min as indicated (n = 3). Rapa: rapamycin. 3-MA: 3-methyladenine, ns: not significant, *p < 0.05, **p < 0.01, ****p < 0.0001 (paired student t-test). Image collected and cropped by CiteAb from the following publication (https://pubmed.ncbi.nlm.nih.gov/31244838), licensed under a CC-BY license. Not internally tested by R&D Systems.
Detection of Mouse IL-1 beta/IL-1F2 by Western Blot
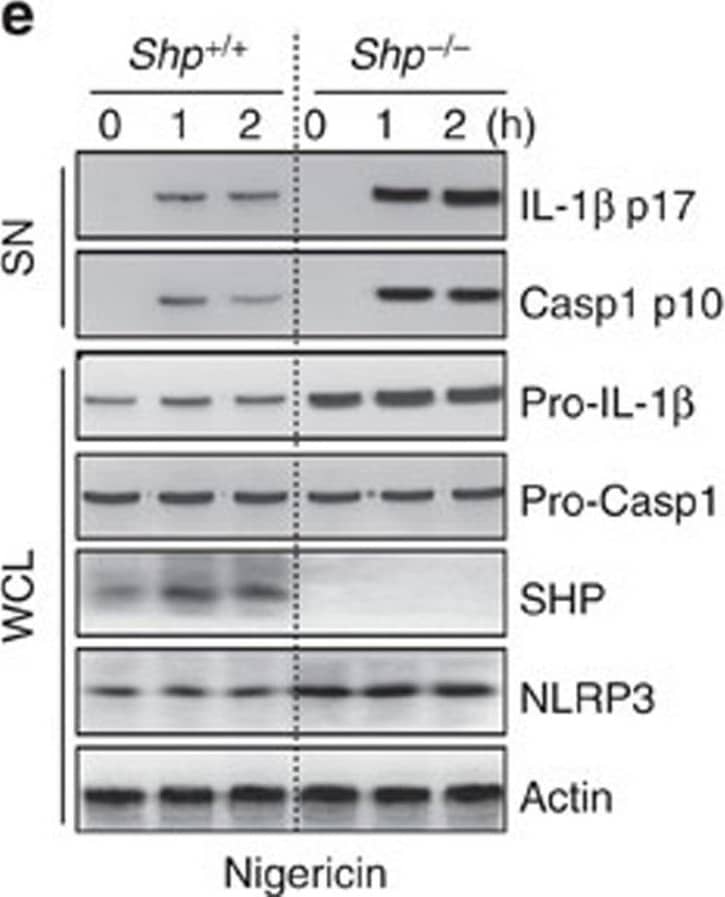
SHP deficiency increases caspase-1 cleavage and IL-1 beta maturation.(a–e) LPS-primed BMDMs from SHP+/+ and SHP−/− mice were stimulated with ATP (5 mM, a,d), nigericin (15 μM, b,e), or transfected with polyinosine–polycytidylic acid (poly I:C, 5 μg ml−1, c) for the indicated durations. (a–c) Supernatants were collected and subjected to ELISA for interleukin (IL)-1 beta, IL-18 and tumour necrosis factor (TNF)-alpha. (d,e) IB analysis for IL-1 beta p17 or caspase-1 p10 in supernatants (SN), SHP, pro-IL-1 beta or pro-caspase-1 in whole-cell lysates (WCL). Actin was used as a loading control. *P<0.05; **P<0.01; ***P<0.001, compared with SHP+/+ cell cultures (two-tailed Student’s t-test). Data are the means±s.d. of values from four independent experiments (a–c). Data are representative of three independent experiments with similar results (d,e). Image collected and cropped by CiteAb from the following publication (https://www.nature.com/articles/ncomms7115), licensed under a CC-BY license. Not internally tested by R&D Systems.
Detection of Mouse IL-1 beta/IL-1F2 by Western Blot
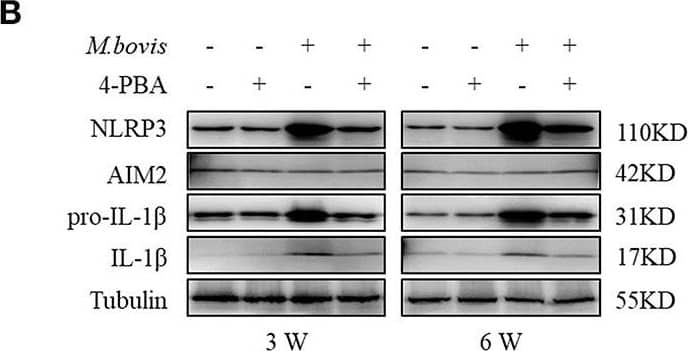
ERS mediates M. bovis-induced inflammasome activation in vivo. (A) ELISA detection of IL-1 beta in serum samples from C57BL/6 mice treated with or without 4-PBA (18.6 mg/mouse/day) and infected with M. bovis (CFU 200) (n = 7). (B) Immunoblot analysis of NLRP3, AIM2, pro-IL-1 beta, and IL-1 beta in the lung tissues of M. bovis-infected mice in the presence or absence of 4-PBA. (C,D) Pathological lesions (H&E staining) in the lung of mice infected with M. bovis for 3 weeks (C) or 6 weeks (D) in the presence or absence of 4-PBA (18.6 mg/mouse/day) (n = 3). 4-PBA, 4-phenyl butyric acid, ERS inhibitor, 18.6 mg/mouse/day; CFU, colony forming units (n = 3). The results are shown as the mean ± SD. ***P < 0.001, n.s., not significant. P-values were analyzed by using Student's t-test (C,D). Scale bar = 100 μm. Image collected and cropped by CiteAb from the following publication (https://pubmed.ncbi.nlm.nih.gov/30846986), licensed under a CC-BY license. Not internally tested by R&D Systems.
Detection of Mouse IL-1 beta/IL-1F2 by Western Blot
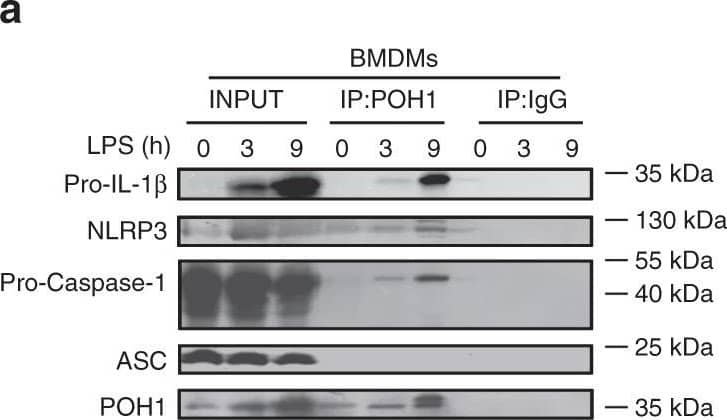
POH1 negatively modifies K63-linked polyubiquitination of pro-IL-1 beta. a BMDMs stimulated with LPS for the indicated time periods were immunoprecipitated (IP) with an anti-POH1 or control IgG antibody and immunoblotted (IB) with the indicated antibodies. b HEK293T cells transfected with His-POH1 and either Flag-NLRP3, Flag-caspase-1 or Flag-ASC were subjected to IP with an anti-Flag antibody and IB with an anti-His antibody. c The lysates of HEK293T cells expressing Flag-POH1 and His-pro-IL-1 beta were IP with an anti-Flag antibody and IB with an anti-His antibody in cell lysates. d HEK293T cells transfected with Vsv-ASC, V5-tagged pro-caspase-1, HA-tagged K48-only or K63-only Ub and His-tagged pro-IL-1 beta, along with or without Flag-tagged POH1, were subjected to IP with an anti-V5 antibody or anti-His antibody and then IB with the indicated antibodies. ePoh1 delta/+ and Poh1 delta/ delta BMDMs treated as indicated were subjected to IP with an anti-pro-IL-1 beta antibody and IB with the indicated antibodies. f HEK293T cells were transfected with Flag-caspase-1, Vsv-ASC, His-pro-IL-1 beta, Flag-POH1 (WT) or Flag-H113Q-POH1, along with HA-tagged K63-only Ub, then cells were subjected to IP with an anti-His or control IgG antibody and IB with the indicated antibodies. Similar results were obtained from three independent experiments Image collected and cropped by CiteAb from the following publication (https://pubmed.ncbi.nlm.nih.gov/30315153), licensed under a CC-BY license. Not internally tested by R&D Systems.
Detection of Mouse IL-1 beta/IL-1F2 by Western Blot
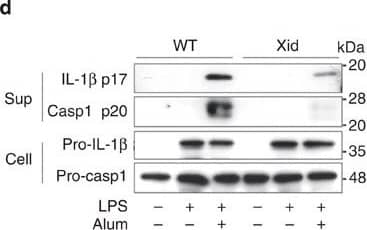
BTK inhibitors and its dysfunctional mutation suppress NLRP3 inflammasome activation.(a) Enzyme-linked immunosorbent assay (ELISA) of human IL-1 beta in supernatants and immunoblot analysis of human IL-1 beta p17, caspase-1 p20/p22 in supernatants and pro-IL-1 beta in cell lysates of THP-1-Mφs that were pretreated with the indicated inhibitors for 30 min and then stimulated with alum for 6 h. ELISA of murine IL-1 beta (b,c) and TNF-alpha (b) in supernatants of LPS-primed murine peritoneal macrophages that were pretreated with LFM-A13 and then stimulated with alum for 3 h. (d,e) Immunoblot analysis of the indicated proteins (d) and ELISA of murine IL-1 beta and IL-6 in supernatants of LPS-primed peritoneal macrophages from Xid and WT mice stimulated with alum for 6 h. (f) ELISA of murine IL-1 beta in supernatants of LPS-primed murine peritoneal macrophages pretreated with LFM-A13 and/or Syk inhibitor (R406), then stimulated with alum for 3 h. (g) ELISA of murine IL-1 beta and immunoblot analysis of murine caspase-1 p20 in supernatant of LPS-primed murine peritoneal macrophages stimulated with the indicated NLRP3 inflammasome activators for 3 h. Immunoblot analysis of murine IL-1 beta p17, caspase-1 p20 in supernatants, pro-IL-1 beta, pro-caspase-1 and ASC in cell lysates (h), and ELISA of murine IL-1 beta in supernatants (i) of LPS-primed murine peritoneal macrophages that were pretreated with LFM-A13 and then stimulated with alum or poly(dA:dT) for 3 h. Data are representative of three independent experiments. Data are presented as mean±s.d. (triplicate). **P<0.01; ***P<0.003. Two-sided Student's t-test. Image collected and cropped by CiteAb from the following publication (https://pubmed.ncbi.nlm.nih.gov/26059659), licensed under a CC-BY license. Not internally tested by R&D Systems.
Detection of Mouse IL-1 beta/IL-1F2 by Western Blot
Rapamycin increases pro-IL-1 beta protein levels, rescues serum starvation-induced pro-IL-1 beta degradation, inhibits mTOR but induces no autophagy in LPS-stimulated cardiac fibroblasts. (A) IL-1 beta release was quantified in conditioned media from cardiac fibroblasts primed with 10 ng/mL LPS for 20 h with or without 500 nM rapamycin, as indicated, prior to activation with 3 mM ATP for 60 min. (B,C) Fibroblasts were primed with 10 ng/mL LPS for 20 h with or without 500 nM rapamycin and pro-IL-1 beta western blot performed (n = 3). (D,E) Control cells were incubated with 10% FCS, while serum deprived cells were incubated with or without 500 nM Rapamycin. Protein expressions were quantified with western blot (n = 4) (F,G). IL-1 beta and TNF-alpha were quantified in conditioned media from cardiac fibroblasts incubated with or without 10% FCS and 500 nM rapamycin and stimulated with LPS 10 ng/mL for 20 h prior to activation with 3 mM ATP for 60 min as indicated (n = 6) (H,I) IL-1 beta and TNF mRNA were quantified with PCR. (J–L) Cardiac fibroblasts were incubated with 10% FCS with or without 10 ng/mL LPS and/or 500 nM rapamycin for 20 h and mTOR (K) and p70 S6 kinase (L) activity were quantified with western blot (n = 5). (M,N) Cardiac fibroblasts primed with LPS (10 ng/mL) were incubated with 10% FCS (control) or no serum for 4 h. Cells were labeled with anti-LC3B and Hoechst and whole slides scanned with an automated immunofluorescence microscope. LC3B puncta in all cells in were automatically counted and ratio to number of Hoechst-labeled kernels calculated. Columns are mean with SEM of paired data normalized to control = 1 (n = 5). (O) Cardiac fibroblasts were incubated with 10% FCS, 10 ng/mL LPS, and/or 5 mM 3-methyladenine (3-MA) for 18 h and/or ATP 3 mM for 60 min as indicated (n = 3). Rapa: rapamycin. 3-MA: 3-methyladenine, ns: not significant, *p < 0.05, **p < 0.01, ****p < 0.0001 (paired student t-test). Image collected and cropped by CiteAb from the following publication (https://pubmed.ncbi.nlm.nih.gov/31244838), licensed under a CC-BY license. Not internally tested by R&D Systems.
Detection of Mouse IL-1 beta/IL-1F2 by Western Blot
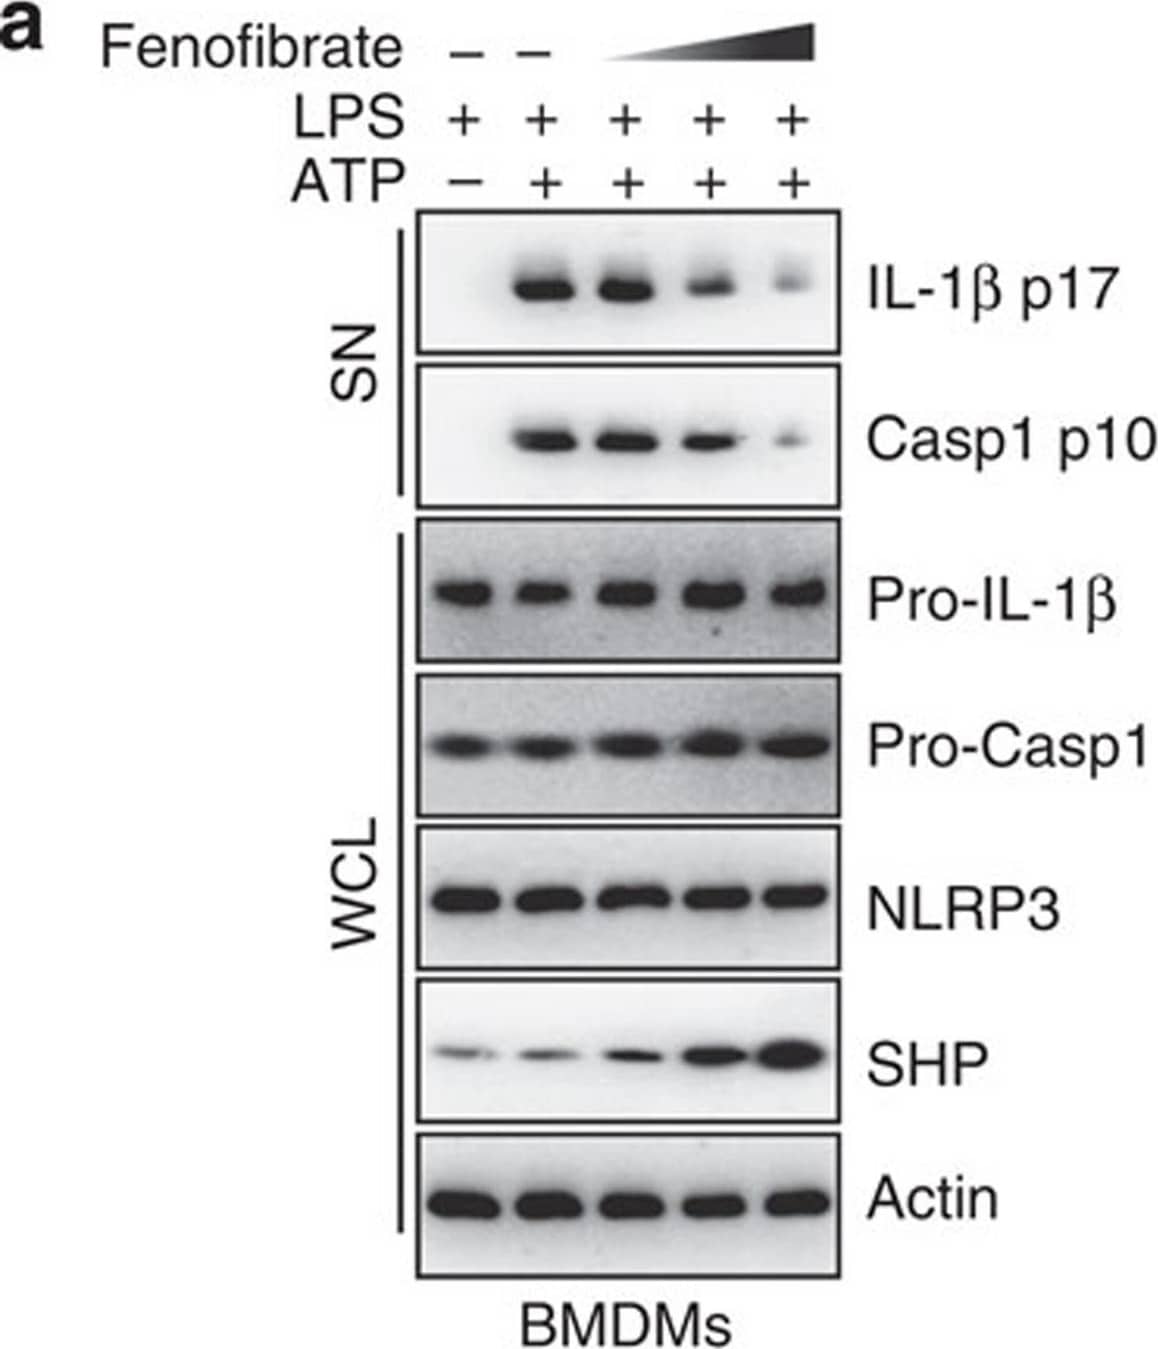
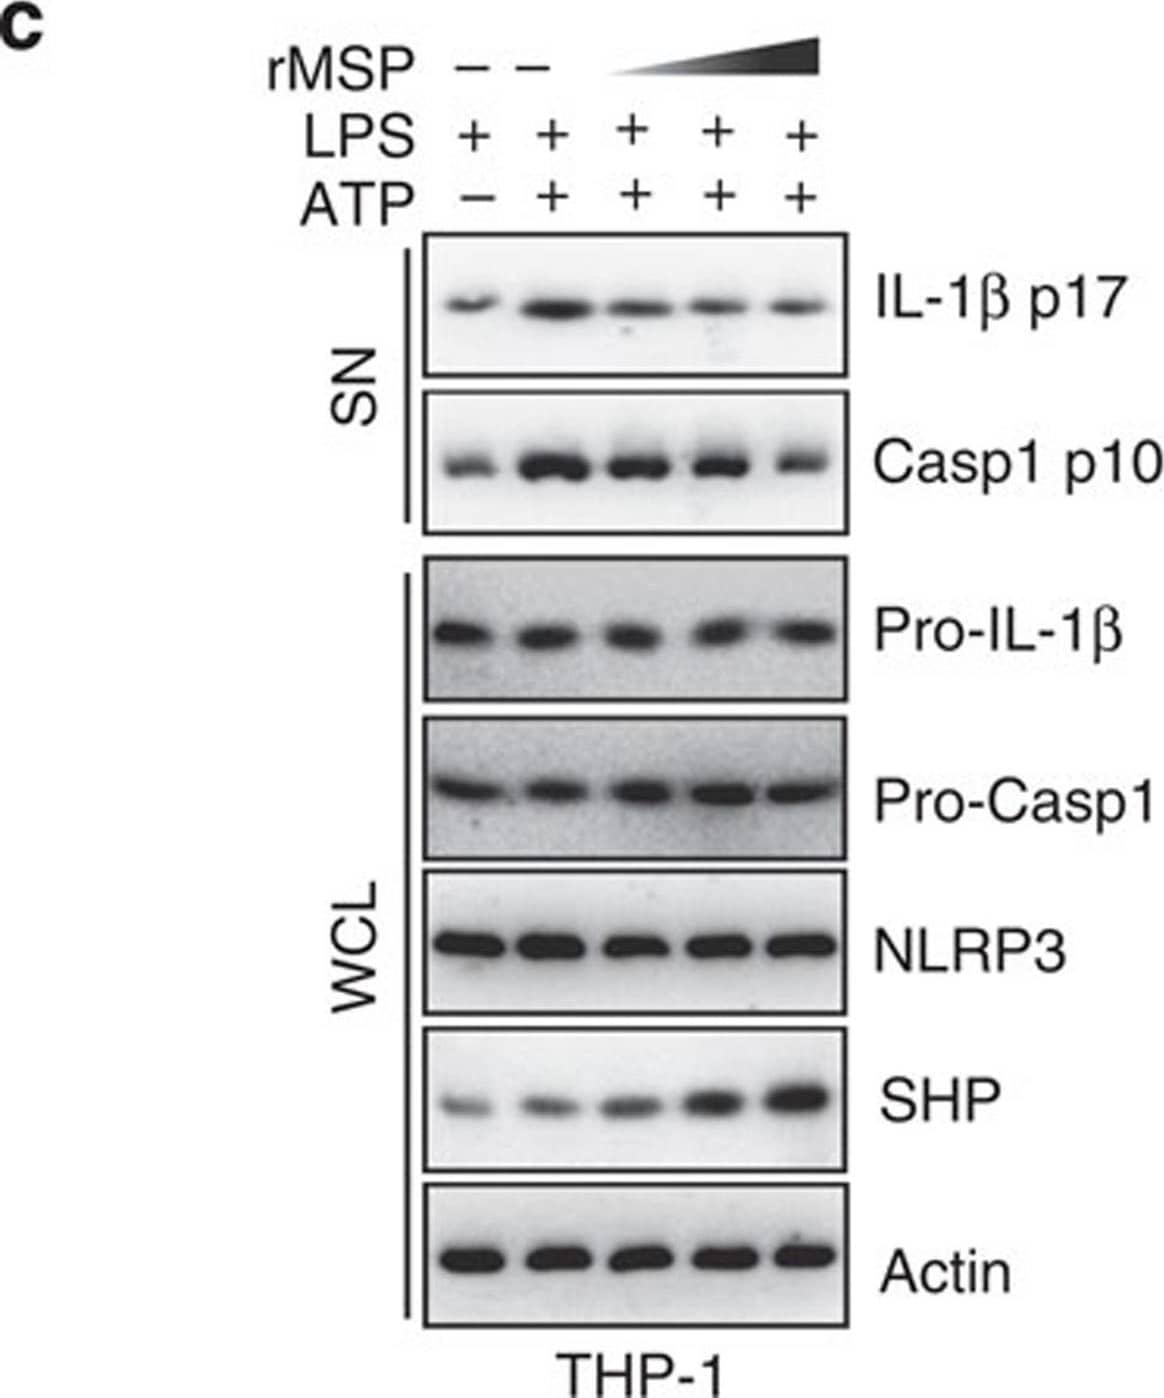
SHP inhibits the signal 2 activation of NLRP3 inflammasome.(a,b) LPS-primed BMDMs were treated with fenofibrate (10, 20, 50 μM for 4 h), or (c,d) LPS-primed THP-1 cells were treated with recombinant macrophage-stimulating protein (MSP 10, 50, 100 ng ml−1 for 4 h), and then activated with ATP (5 mM) for 30 min, followed by IB analysis of IL-1 beta p17 or caspase-1 p10 in supernatants (SN), pro-IL-1 beta or pro-caspase-1 in whole-cell lysates (WCL), with actin as a loading control. Data are representative of three independent experiments (a,c). Supernatants were collected and subjected to ELISA for IL-1 beta, IL-18, TNF-alpha and IL-8. Data are the means±s.d. of values from four independent experiments (b,d). *P<0.05; **P<0.01; ***P<0.001, compared with control (two-tailed Student’s t-test). FF, fenofibrate. Image collected and cropped by CiteAb from the following publication (https://www.nature.com/articles/ncomms7115), licensed under a CC-BY license. Not internally tested by R&D Systems.
Detection of Mouse IL-1 beta/IL-1F2 by Western Blot
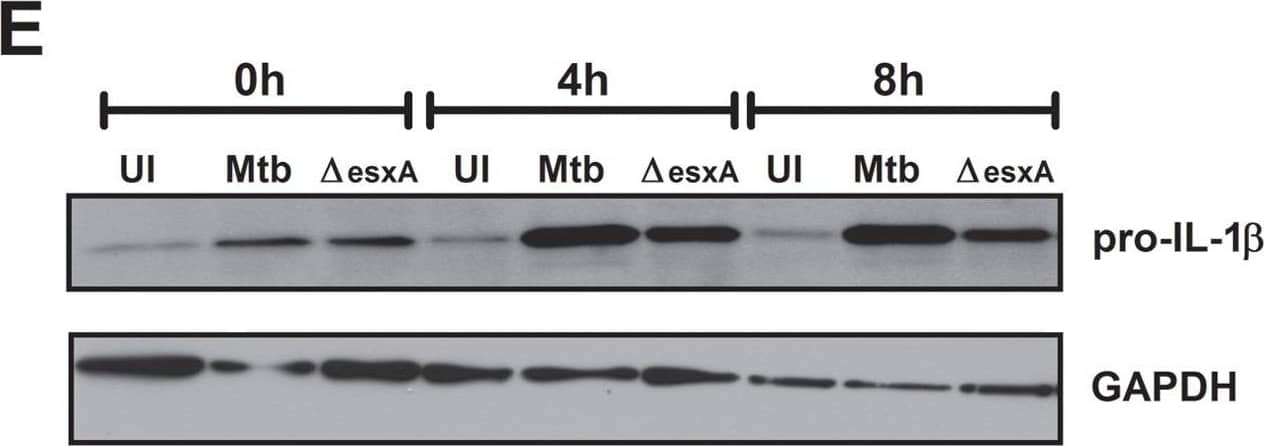
The ESX-1 secretion system of Mtb does not affect secretion of proinflammatory cytokines in dendritic cells but is important for complete inflammasome activation.BMDCs were left uninfected (UI), infected with wild-type Mtb (Mtb) or the esxA deletion mutant ( deltaesxA) for 4 h at MOI of 10, washed and incubated for an additional 24 h (A+B) or the indicated timepoints (C+D). (A) The cytokine profile in the supernatants was analyzed using a bead-based immunoassay (black = uninfected, white = Mtb, gray = deltaesxA). (B) and (C) IL-1 beta secretion was analyzed by ELISA. (D) The percent of cells with activated caspase-1 was determined via flow cytometry using fluorescent caspase-1 substrates (FLICA). (E) Pro-IL-1 beta protein levels in BMDCs. (F) GFP-labeled bacteria were used to infect BMDCs and rate of infection was determined via flow cytometry. Shown are means and standard deviation of triplicate measurements of one representative experiment out of three. In all figures, the asterisks denote range of p values (* = p<0.05, ** = 0.01>p>0.001,***p<0.001, ns = not significant ) as determined by one way ANOVA with Tukey's post test. Image collected and cropped by CiteAb from the following publication (https://dx.plos.org/10.1371/journal.pone.0040722), licensed under a CC-BY license. Not internally tested by R&D Systems.
Detection of Mouse IL-1 beta/IL-1F2 by In vivo assay
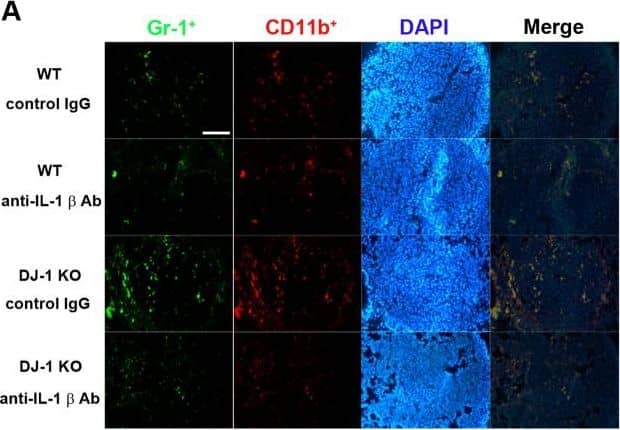
Effects of IL-1 beta neutralization on the accumulation of MDSCs in lungs.(A) Immunofluorescent photos showed that Gr-1+ (green)/CD11b+ (red) cells indicate MDSCs and increased in lungs of DJ-1 KO mice. Treatment with anti-IL-1 beta neutralizing antibody antagonized the accumulation of MDSCs. DAPI was used to stain nuclei. (B) Bar chart showed the summarized results of MDSCs in lungs of WT and DJ-1 KO mice. Note that the neutralizing antibody significantly reduced the number of MDSCs accumulated in lungs. n = 9 for each group, * p < 0.05 compared with control IgG-treated WT mice, # p<0.05 compared with respective control IgG in WT and DJ-1 KO mice. Image collected and cropped by CiteAb from the following publication (https://dx.plos.org/10.1371/journal.pone.0115827), licensed under a CC-BY license. Not internally tested by R&D Systems.
Detection of Mouse IL-1 beta/IL-1F2 by Western Blot
Pro-IL-1 beta degradation is induced by the autophagy inhibitors chloroquine and bafilomycin A, and by the proteasome activator betulinic acid. (A) Chloroquine selectively attenuates IL-1 beta release from cardiac fibroblasts. The cells were incubated with LPS and/or 20 μM chloroquine phosphate as indicated for 18 h, then activated with 3 mM ATP for 60 min. IL-1 beta, TNF, MIP-2, and IL-6 were quantified in the conditioned media (n = 3). (B,C) Cardiac fibroblasts were incubated with LPS for 18 h with or without 20 μM chloroquine phosphate and pro-IL-1 beta quantified with western blot (n = 3). (D) Pro-IL-1 beta mRNA expression was quantified with qPCR (n = 3). (E,F) Cardiac fibroblasts were incubated with LPS for 20 h with or without 10% FCS or 20 μM chloroquine phosphate as indicated. The amount of total ubiquitinated protein was quantified with western blot (n = 4). (G,H) Cardiac fibroblasts were incubated with 10% FCS with or without 10 ng/mL LPS and/or 100 nM bafilomycin A1 for 20 h. Pro-IL-1 beta was quantified with western blot. (I,J) Cardiac fibroblasts were incubated with 10% FCS with or without 10 ng/mL LPS and/or 20 μM betulinic acid as indicated for 20 h. Pro-IL-1 beta was quantified with western blot. All columns are mean with SEM. *p < 0.05, **p < 0.01 (paired student t-test). Image collected and cropped by CiteAb from the following publication (https://pubmed.ncbi.nlm.nih.gov/31244838), licensed under a CC-BY license. Not internally tested by R&D Systems.
Detection of Mouse IL-1 beta/IL-1F2 by Western Blot
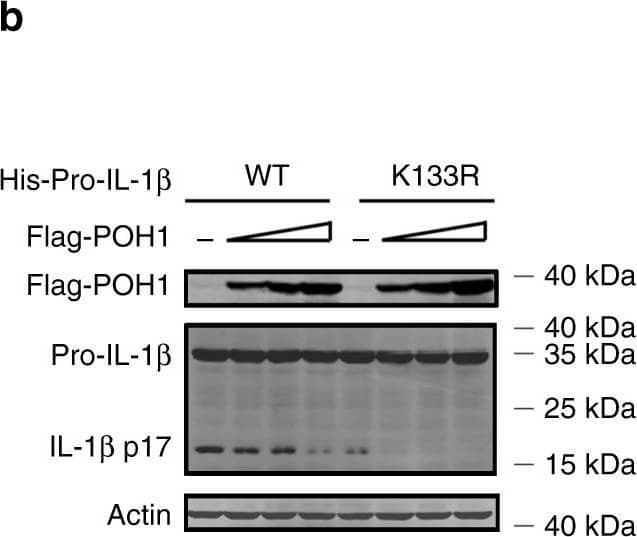
Pro-IL-1 beta maturation is regulated by POH1-mediated deubiquitination. a, b HEK293T cells were transfected with plasmids encoding Flag-caspase-1, Vsv-ASC, His-pro-IL-1 beta (WT) or His-pro-IL-1 beta-K133R with different amounts (125, 250, 500 ng) of plasmid encoding Flag-POH1 and 500 ng of control plasmid, the secretion of a IL-1 beta in the supernatants was quantified by ELISA 36 h after transfection; b the cell lysates were IB with the indicated antibodies. c Mutants of murine pro-IL-1 beta with replacement of various lysine residues. d-f HEK293T cells were transfected with Flag-POH1, V5-caspase-1, V5-ASC, His-pro-IL-1 beta (WT) or its mutants, along d with or e-f without HA-tagged K63-only Ub, then d cells were subjected to IP with an anti-His antibody and IB with the indicated antibodies. e The IL-1 beta levels in supernatants were measured by ELISA; or f the cell lysates were collected and IB with the indicated antibodies. g Proposed function of POH1 as a negative regulator in mediating IL-1 beta processing. POH1, upregulated by TLR3/4 activation, interacts with and deubiquitinates pro-IL-1 beta, resulting in restriction of IL-1 beta cleavage and secretion. Similar results were obtained from three independent experiments. The results represent the mean ± s.d. of three independent sets of experiments. **p < 0.01, ***p < 0.001 (one-way ANOVA with Tukey’s post-hoc test) Image collected and cropped by CiteAb from the following publication (https://pubmed.ncbi.nlm.nih.gov/30315153), licensed under a CC-BY license. Not internally tested by R&D Systems.
Detection of Mouse IL-1 beta/IL-1F2 by Western Blot
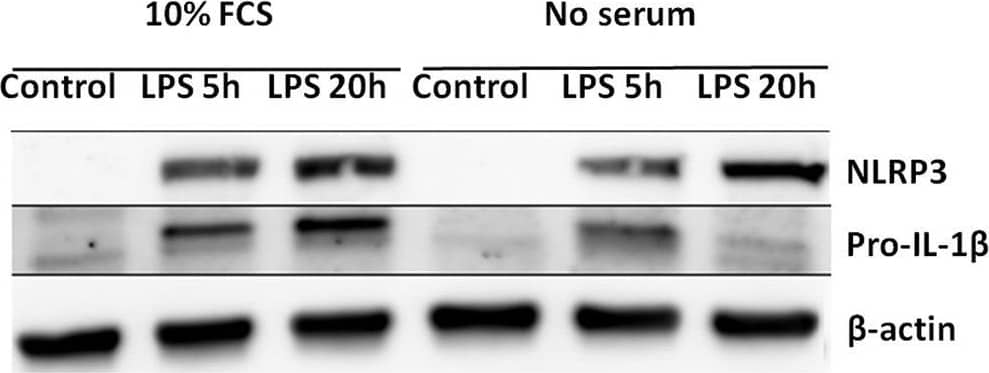
Serum starvation selectively induces pro-IL-1 beta degradation in cardiac fibroblasts. (A) Cells were incubated with 10 ng/mL LPS for 5 or 20 h with or without 10% FCS and western blot analysis of pro-IL-1 beta and NLRP3 performed. Blots are representative of 3 independent experiments. (B) Protein bands were quantified and the ratios to beta-actin normalized to mean control = 1 (n = 3). (C,D) Cardiac fibroblasts were incubated with or without 10% FCS and primed with LPS for 20 h. Western blot analysis of complex II (mitochondrial mass marker) and NLRP3- inflammasome protein components (NEK7, NLRP3, ASC, pro-caspase-1, and pro-IL-1 beta) were performed. Bands were quantified and the ratios to beta-actin normalized to mean control = 1 (n = 4, for ASC n = 10). (E,F) Cardiac fibroblasts (120,000 cells per well seeded in 6 well plates) were incubated with 10 ng/mL LPS for 20 h, with or without 10% FCS, then stained with 500 nM MitoTracker Deep Red for 45 min before MitoTracker fluorescence intensity was quantified with flow cytometry analysis (633 nm laser). All cells were analyzed and all gated cells included in the analysis. The presented dot plots (E) show the gate in red and are representative for 9 biological repeats. Median MitoTracker intensity with and without 10% FCS are shown (F). All columns are mean with SEM. *p < 0.05,**p < 0.01 (paired student t-test). Image collected and cropped by CiteAb from the following publication (https://pubmed.ncbi.nlm.nih.gov/31244838), licensed under a CC-BY license. Not internally tested by R&D Systems.
Detection of Mouse IL-1 beta/IL-1F2 by In vivo assay
Differential effects of IL-1 beta neutralization on melanoma lung nodules in WT and DJ-1 KO mice.(A) IL-1 beta antibody (10μg) or control IgG was intravenously injected into mice once. The melanoma cells (6×10⁴) were intravenously injected 30 minutes later. The mice were sacrificed three weeks later. Bar chart showed that the anti-IL-1 beta neutralizing antibody can effectively lower serum IL-1 beta levels as compared with control IgG in both WT and DJ-1 KO mice. Note that serum IL-1 beta levels were higher in DJ-1 KO mice than those in WT mice. (B) Inhibition of IL-1 beta neutralization on lung nodules formation in DJ-1 KO mice. Upper panels: melanoma nodules in lungs of WT (top) and KO (bottom) mice treated with control IgG (left) or neutralizing anti-IL-1 beta antibody (right). For each experimental condition, the gross and microscopic morphologies of tumor nodules are indicated by arrows, and are shown at left and right sites, respectively. Scale bars: 0.5 mm for lung photographs and 0.5 mm for H&E staining. Lower panel: Bar chart showed the summarized results of lung nodule numbers in WT and DJ-1 KO mice. Note that IL-1 beta neutralization enhanced and suppressed melanoma nodules formation in WT and DJ-1 KO mice, respectively. Data are presented as mean ± S.E.M. n = 5 for each group, * p < 0.05 compared with control IgG-treated WT mice, # p<0.05 compared with respective control IgG in WT and DJ-1 KO mice. Image collected and cropped by CiteAb from the following publication (https://dx.plos.org/10.1371/journal.pone.0115827), licensed under a CC-BY license. Not internally tested by R&D Systems.
Detection of Mouse IL-1 beta/IL-1F2 by Western Blot
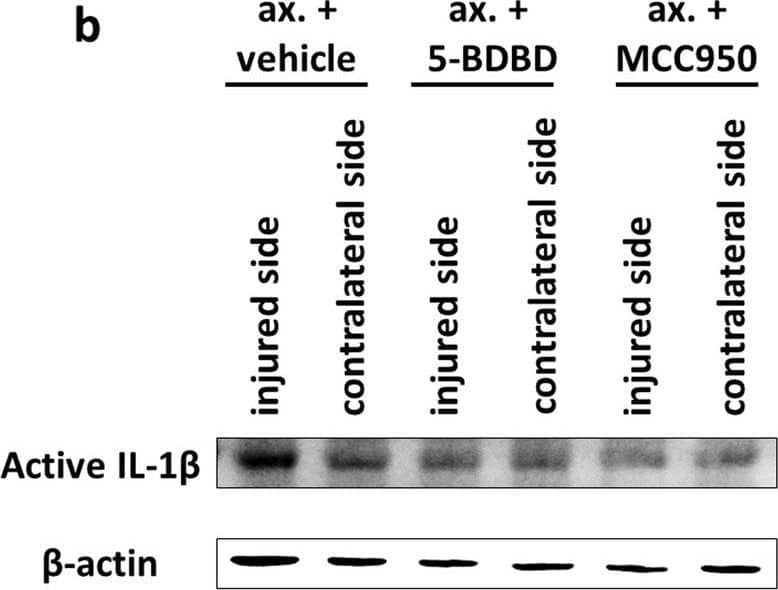
Inflammasome assembly and mature IL-1 beta release in the spinal cord after sciatic nerve axotomy. a Speck-like costaining of NLRP3 and ASC in injured neurons 3 days after the injury (arrows). b Representative WB images of mature IL-1 beta and beta-actin proteins 3 days after unilateral axotomy of sciatic nerve. c Quantification of active IL-1 beta protein expression. N = 3 animals/group. The graph shows values normalized to beta-actin levels and relative to contralateral side. Mean values are shown on bars. Bars represent average ± SEM. **p < 0.01 (ANOVA with Bonferroni post hoc, ax. + vehicle vs. contralateral side). #p < 0.05, ##p < 0.01 (ANOVA with Bonferroni post hoc, compared to ax. + vehicle). Ax. axotomy Image collected and cropped by CiteAb from the following publication (https://pubmed.ncbi.nlm.nih.gov/35305649), licensed under a CC-BY license. Not internally tested by R&D Systems.
Detection of Mouse IL-1 beta/IL-1F2 by Western Blot
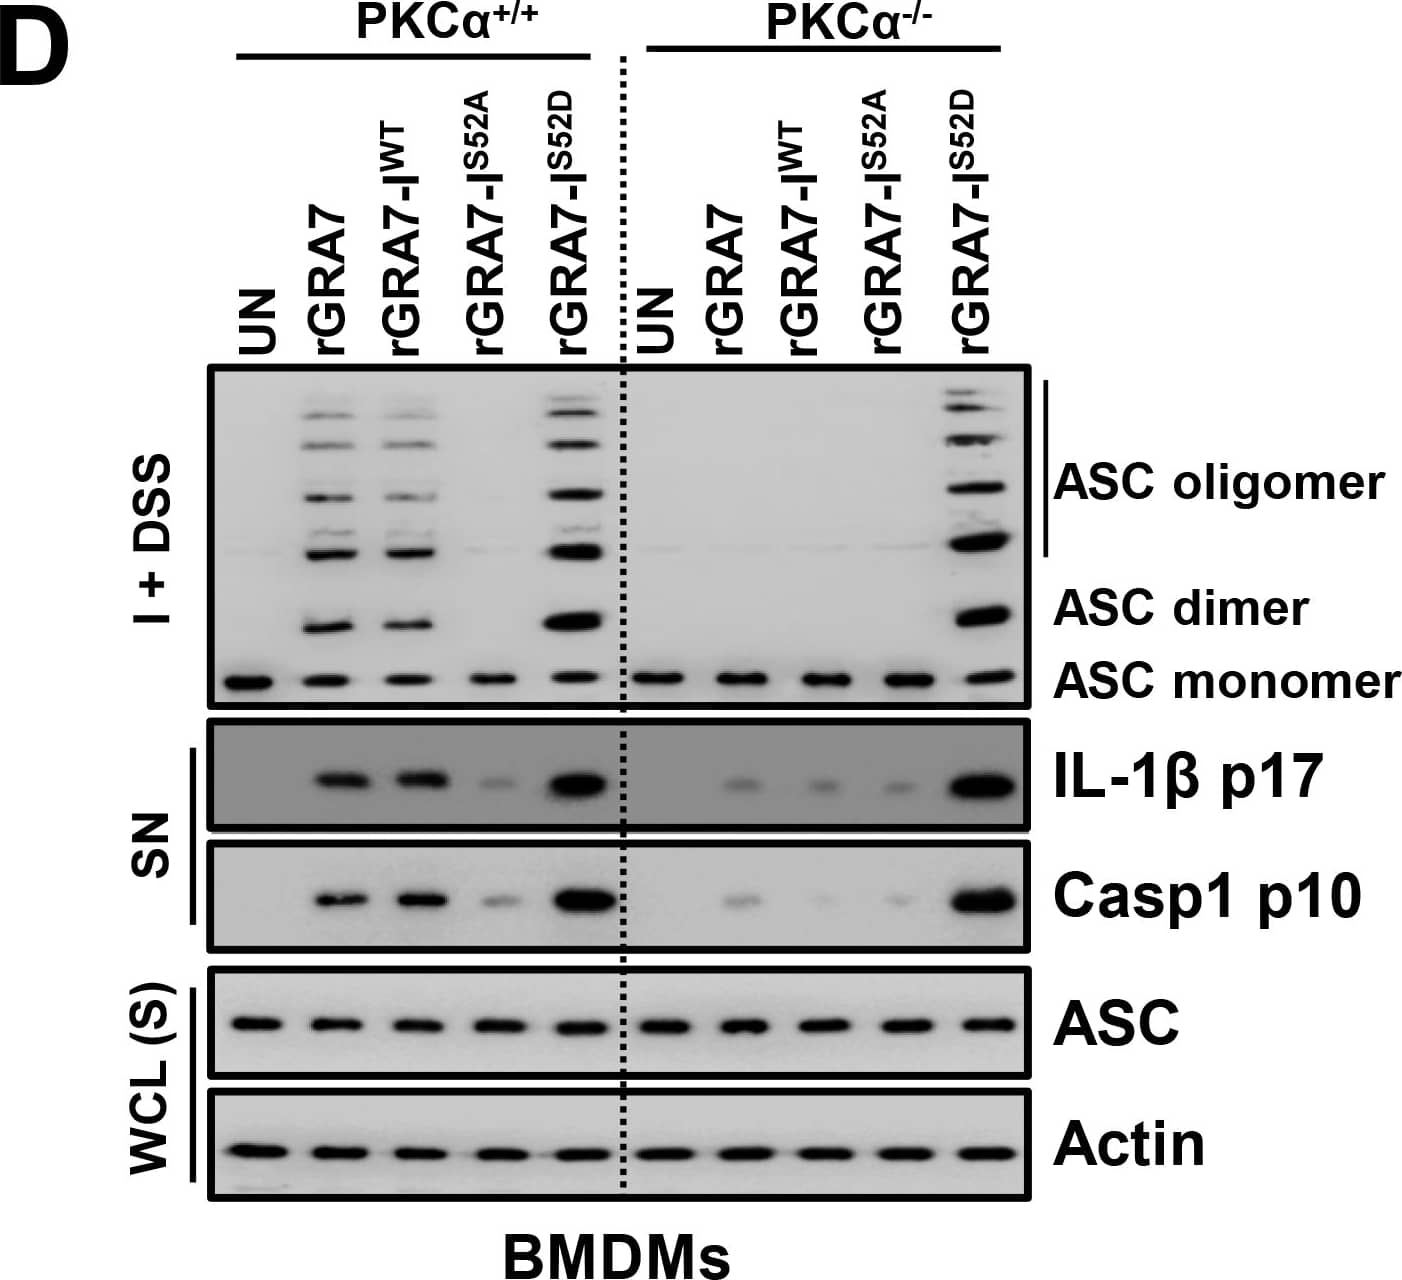
GRA7-I activated inflammasomes in an ASC-binding dependent manner.(A) Bacterially purified 6xHis-GRA7-I and its mutants were analyzed by Coomassie blue staining (left) or IB with alphaHis (right). (B) BMDMs from PKC alpha+/+ and PKC alpha-/- (left) or BMDMs were transduced with lentivirus-shRNA-NS or lentivirus-shRNA-ASC (MOI = 100) with polybrene (8 μg/mL) (right) for 2 days, the cells were stimulated with rGRA7 (5 μg/ml) and its mutants for the indicated times and culture supernatants were harvested and analyzed for cytokine ELISA for IL-1 beta and IL-18. Data shown are the means ± SD of five experiments. Significant differences (*P < 0.05; ***P < 0.001) compared with PKC alpha+/+ or shRNA-NS. (C) IB analysis for IL-1 beta p17, IL-18 p18, or caspase-1 p10 in supernatants (SN), ASC, NLRP3, pro-IL-1 beta, pro-IL-18, or pro-caspase-1 in whole-cell lysates (WCL). Actin was used as a loading control. (D) IB analysis of lysates of BMDMs as in B and C solubilized with Triton X-100–containing buffer, followed by cross-linkage of insoluble fractions with disuccinimidyl suberate to capture ASC oligomers and analysis of those fractions (I + DSS) and soluble fractions (S) with antibody to ASC. Actin was used as a loading control. (E) Fluorescence confocal images showing formation of speck-like ASC pyroptosomes in BMDMs from PKC alpha+/+ and PKC alpha-/- mice were stimulated with rGRA7 and its mutants for 18 h, fixed, immunostained with antibodies for ASC (Alexa 488). Scale bar, 10 μm. The data are representative of five independent experiments with similar results (A and C-E). Image collected and cropped by CiteAb from the following publication (https://dx.plos.org/10.1371/journal.ppat.1006126), licensed under a CC-BY license. Not internally tested by R&D Systems.
Detection of Human IL-1 beta/IL-1F2 by Western Blot
The B6 variant of NLRP1B is not cleaved by LF but can form an inflammasome in response to proteolysis.(A) The amino acid sequence of the first 244 residues of NLRP1BB6 was aligned to the homologous sequence of NLRP1B129. The arrow above the alignment indicates the LF-cleavage site in NLRP1B129. Asterisks indicate sites of amino acid identity. (B) For detection of NLRP1B expression, 293T cells were transfected with the indicated amounts of and empty vector (V) or plasmids encoding GFP-HA-NLRP1B129 or GFP-HA-NLRP1BB6 (construct schematics and the predicted molecular weight of each protein is depicted in the upper panel). Cells were treated overnight with anthrax lethal toxin protein (LeTx, 1μg/ml) 24h post-transfection, and then lysates were analyzed by immunoblotting (IB) with the indicated antibodies. For NLRP1 expression and cleavage, CASP1 and IL1B were omitted to prevent cell death and resulting apparent differences of expression. For blots probed with anti-HA (NLRP1B), the lysates were not boiled prior to loading to prevent aggregation and smearing of full-length and FIIND-processed NLRP1B on the immunoblot. To visualize the N-terminal processed form of NLRP1B, the lysates were boiled and resolved on a separate gel. (C) 293T Cells were transfected with the same amount of titrated NLRP1B encoding plasmid and treated as in B, but transfections also included plasmids encoding mouse CASP1 (200ng), IL-1 beta (200ng) and 200ng of empty vector. (D) For detection of NLRP1B expression, 293T cells were transfected for 36h with 250ng of plasmids encoding WT 129 or B6 NLRP1B or mutants engineered to express the TEV-protease site. Each plasmid was co-transfected with either 100ng of empty vector (V) or plasmids encoding TEV-protease (pTEV) or lethal factor protease (pLF), supplemented with 300ng empty vector (pMSCV). Cells were not treated with LeTx and lysates were analyzed by immunoblotting as in (B). (E) Cells were treated as in C, but with 8ng of plasmids encoding NLRP1B, along with 200ng of plasmids encoding mCASP-1 and mIL-1 beta, and 200ng empty vector to normalize plasmid quantities. Lower quantities of NLRP1B were transfected as compared to panel D so to avoid spontaneous NLPR1B activation. For panels B-E, data shown are representative of at least three similar experiments. Image collected and cropped by CiteAb from the following publication (https://dx.plos.org/10.1371/journal.ppat.1006052), licensed under a CC-BY license. Not internally tested by R&D Systems.
Detection of Mouse IL-1 beta/IL-1F2 by Western Blot
SHP inhibits the signal 2 activation of NLRP3 inflammasome.(a,b) LPS-primed BMDMs were treated with fenofibrate (10, 20, 50 μM for 4 h), or (c,d) LPS-primed THP-1 cells were treated with recombinant macrophage-stimulating protein (MSP 10, 50, 100 ng ml−1 for 4 h), and then activated with ATP (5 mM) for 30 min, followed by IB analysis of IL-1 beta p17 or caspase-1 p10 in supernatants (SN), pro-IL-1 beta or pro-caspase-1 in whole-cell lysates (WCL), with actin as a loading control. Data are representative of three independent experiments (a,c). Supernatants were collected and subjected to ELISA for IL-1 beta, IL-18, TNF-alpha and IL-8. Data are the means±s.d. of values from four independent experiments (b,d). *P<0.05; **P<0.01; ***P<0.001, compared with control (two-tailed Student’s t-test). FF, fenofibrate. Image collected and cropped by CiteAb from the following publication (https://www.nature.com/articles/ncomms7115), licensed under a CC-BY license. Not internally tested by R&D Systems.
Detection of Human IL-1 beta/IL-1F2 by Western Blot
NLRP1A is activated by N-terminal proteolysis.(A) The amino acid sequence of the first 244 residues of NLRP1AB6 was aligned to NLRP1B129 and NLRP1BB6. The arrow above the alignment indicates the LF-cleavage site in NLRP1B129. (B) 293T cells were transfected for 36h with 200ng empty vector (V) or plasmids pcDNA3.1-HA-NLRP1B129 or -NLRP1AB6-MYC (CMV promoter) along with 200ng mCASP1 and 200ng mIL-1 beta expression vectors. Cells were treated overnight with anthrax lethal toxin (LeTx, 1μg/ml) 24h post-transfection, and then lysates were analyzed by immunoblotting (IB) with the indicated antibodies. (C) 293T cells were transfected for 36h with plasmids encoding 400ng GFP-HA-NLRP1B129 or GFP-HA-NLRP1AB6 (under the control of the LTR promoter in pMSCV) or with mutants engineered to contain an N-terminal TEV protease site. Cells were also co-transfected with 100ng empty vector (V) or plasmids encoding TEV-protease (pTEV) or lethal factor protease (pLF), plus 300ng empty pMSCV. (D) To assess IL-1 beta cleavage, cells were transfected as in C, but with 8ng of GFP-HA-NLRP1B and co-transfected with vectors encoding 200ng mCASP1 and 200ng mIL-1 beta. For panels B-D, data shown are representative of at least three similar experiments. Image collected and cropped by CiteAb from the following publication (https://dx.plos.org/10.1371/journal.ppat.1006052), licensed under a CC-BY license. Not internally tested by R&D Systems.
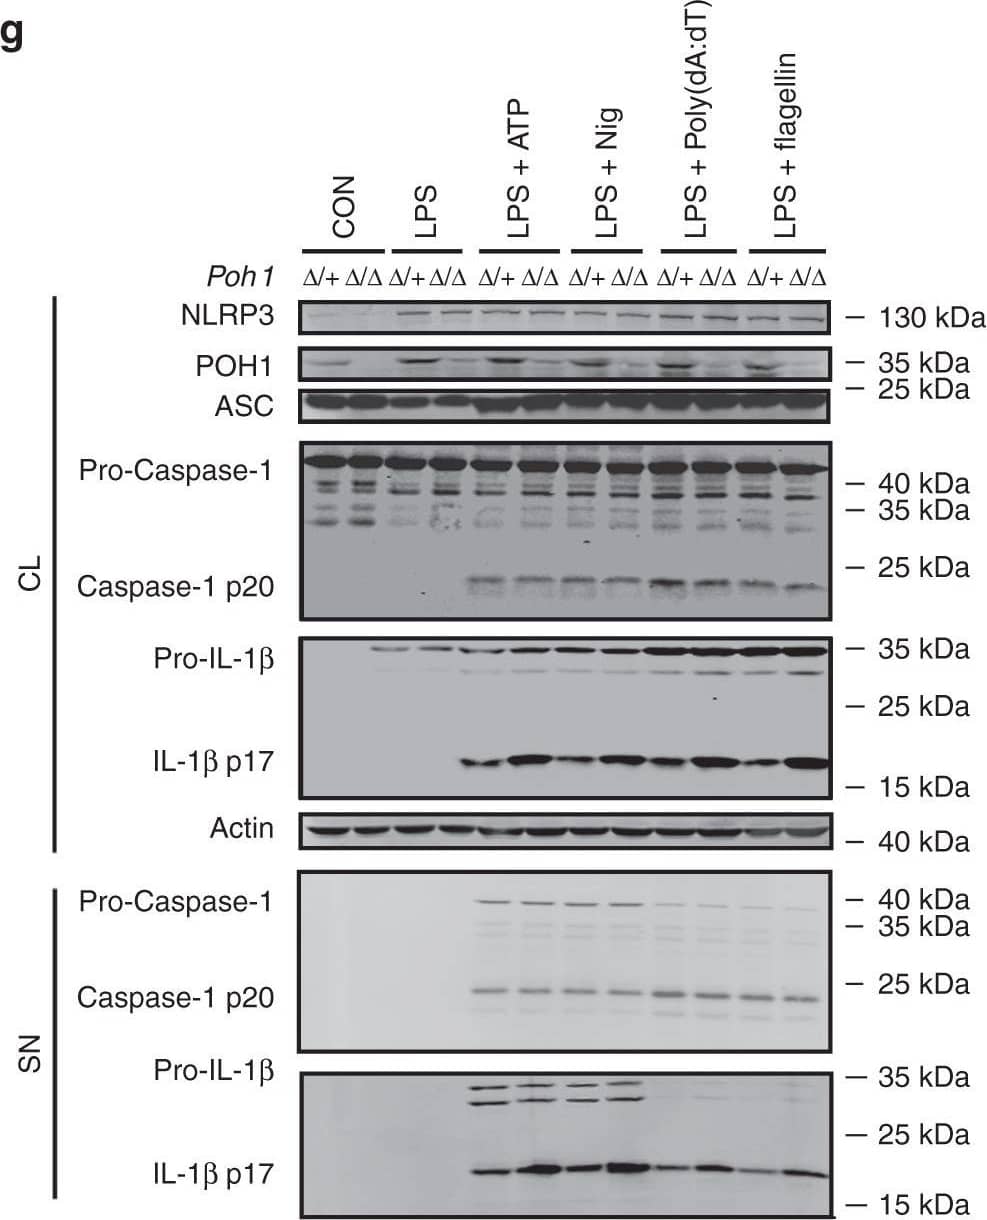
Detection of Mouse IL-1 beta/IL-1F2 by Western Blot
POH1 inhibits inflammasome-induced pro-IL-1 beta processing. a-c BMDMs from Poh1 delta/+ and Poh1 delta/ delta mice were primed with LPS for 12–14 h and then stimulated with ATP (0.5 h), nigericin (Nig, 0.5 h), poly(dA:dT) (5 h) or flagellin (5 h) as indicated, a IL-1 beta, b IL-6 and c TNF alpha levels in supernatants were analysed by ELISA. d-f BMDMs lentivirally transduced with control (Vector) or POH1 were stimulated as in a, d IL-1 beta, e IL-6 and f TNF alpha levels in supernatants were analysed by ELISA. g, h BMDMs g derived from Poh1 delta/+ and Poh1 delta/ delta mice or h infected by indicated lentiviruses were treated as in a, the cell lysates (CL) and supernatants (SN) were collected and immunoblotted with the indicated antibodies. Similar results were obtained from three independent experiments. The results represent the mean ± s.d. of three independent sets of experiments. **p < 0.01, ***p < 0.001 (two-tailed Student’s t-test) Image collected and cropped by CiteAb from the following publication (https://pubmed.ncbi.nlm.nih.gov/30315153), licensed under a CC-BY license. Not internally tested by R&D Systems.
Detection of Mouse IL-1 beta/IL-1F2 by Western Blot
Quercetin inhibits NLRP3 and AIM2 Inflammasomes.LPS (500 ng/ml)-primed BMDM were treated with the indicated flavonoids and concentrations or vehicle (DMSO 0.01%), then stimulated with (A) 5 mM ATP (B) 10 μM Nigericin (C) 130 μg/ml Alum or (D) 400 ng/ml Poly (dA:dT) 30 minutes after treatment. (A–D) IL-1 beta and (E) TNF-alpha concentration in the culture supernatant were measured by ELISA. (B,F,G) LPS-primed BMDM were stimulated with Nigericin treated with quercetin 30 minutes before secondary stimulation. Supernatants and Lysate of BMDM were analyzed by immunoblotting. Cells were stained with FLICA and Caspase-1 activation was determined by FLICA positivity. Data shown are representative of two or more independent experiments (means ± SD) *p < 0.05, **p < 0.01, ***p < 0.001. Image collected and cropped by CiteAb from the following publication (https://pubmed.ncbi.nlm.nih.gov/28148962), licensed under a CC-BY license. Not internally tested by R&D Systems.
Detection of Mouse IL-1 beta/IL-1F2 by Western Blot
GRA7-I-induced inflammasome activation was required for antimicrobial activity in MTB-infected macrophages.(A and B) BMDMs from PKC alpha+/+ and PKC alpha-/- mice (A) and BMDMs were transduced with lentivirus-shRNA-NS or lentivirus-shRNA-ASC for 2 days (B) infected with MTB (MOI = 1) for 4 h and then stimulated with rGRA7 (1, 5, 10 μg/ml) and its mutants for 18 h. IB analysis for IL-1 beta p17, IL-18 p18, or caspase-1 p10 in supernatants (SN), ASC, NLRP3, pro-IL-1 beta, pro-IL-18, or pro-caspase-1 in whole-cell lysates (WCL). Actin was used as a loading control. (C and D) Intracellular survival of MTB was assessed by CFU assay. BMDMs were infected with MTB for 4 h, followed by treatment with rGRA7, and then lysed to determine intracellular bacterial loads. The data are representative of five independent experiments with similar results (A and B). Data shown are the mean ± SD of five experiments (C and D). Significant differences (*P < 0.05; **P < 0.01; ***P < 0.001) compared with rVector. CFU, colony-forming units. ns, not significant. Image collected and cropped by CiteAb from the following publication (https://dx.plos.org/10.1371/journal.ppat.1006126), licensed under a CC-BY license. Not internally tested by R&D Systems.
Detection of Human IL-1 beta/IL-1F2 by Western Blot
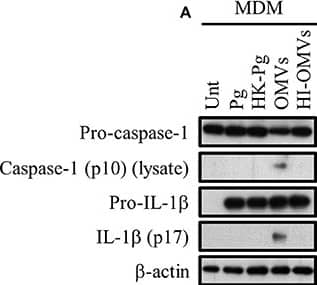
P. gingivalis and its OMVs differentially induce inflammasome signaling and pyroptosis in human macrophages. MDM were infected as before (2 h at MOI of 25:1, see Materials and Methods) with viable P. gingivalis (Pg), heat-killed-Pg (HK-Pg), OMVs, or heat-inactivated-OMVs (HI-OMVs) and (A) the activation of inflammasome components in the lysates was measured after 24 h by Western blot; beta-actin serves as a loading control throughout. Western blot data are representative of at least three independent experiments. (B) Production of IL-1 beta and IL-18 (by ELISA) from MDM was measured in the supernatant at 24 h. Data are mean ± SD from four independent experiments. Cell viability was determined by measuring extracellular LDH release and by 7-AAD exclusion (by flow-cytometry) at 24 h. 7-AAD is a membrane impermeant dye that is excluded from viable cells. The percent of 7-AAD positive (±SD) cells from three independent experiments was calculated relative to the untreated control. MDM treated with H2O2 (1 mM for 60 min) were included as positive control for 7-AAD. A representative histogram is shown. Cells were also treated where indicated with OMVs in the presence of KYT-1 and KYT-36 (10 μM of each). *p < 0.05: n.s, not significant. Image collected and cropped by CiteAb from the following publication (https://pubmed.ncbi.nlm.nih.gov/28824884), licensed under a CC-BY license. Not internally tested by R&D Systems.
Detection of Mouse IL-1 beta/IL-1F2 by Western Blot
Pro-IL-1 beta degradation is induced by the autophagy inhibitors chloroquine and bafilomycin A, and by the proteasome activator betulinic acid. (A) Chloroquine selectively attenuates IL-1 beta release from cardiac fibroblasts. The cells were incubated with LPS and/or 20 μM chloroquine phosphate as indicated for 18 h, then activated with 3 mM ATP for 60 min. IL-1 beta, TNF, MIP-2, and IL-6 were quantified in the conditioned media (n = 3). (B,C) Cardiac fibroblasts were incubated with LPS for 18 h with or without 20 μM chloroquine phosphate and pro-IL-1 beta quantified with western blot (n = 3). (D) Pro-IL-1 beta mRNA expression was quantified with qPCR (n = 3). (E,F) Cardiac fibroblasts were incubated with LPS for 20 h with or without 10% FCS or 20 μM chloroquine phosphate as indicated. The amount of total ubiquitinated protein was quantified with western blot (n = 4). (G,H) Cardiac fibroblasts were incubated with 10% FCS with or without 10 ng/mL LPS and/or 100 nM bafilomycin A1 for 20 h. Pro-IL-1 beta was quantified with western blot. (I,J) Cardiac fibroblasts were incubated with 10% FCS with or without 10 ng/mL LPS and/or 20 μM betulinic acid as indicated for 20 h. Pro-IL-1 beta was quantified with western blot. All columns are mean with SEM. *p < 0.05, **p < 0.01 (paired student t-test). Image collected and cropped by CiteAb from the following publication (https://pubmed.ncbi.nlm.nih.gov/31244838), licensed under a CC-BY license. Not internally tested by R&D Systems.
Detection of Mouse IL-1 beta/IL-1F2 by Western Blot
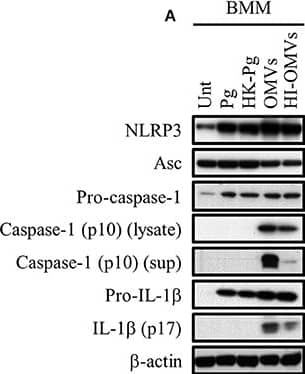
P. gingivalis and its OMVs differentially induce inflammasome signaling and pyroptosis in murine macrophages. BMM were infected as before (2 h at MOI of 25:1, see Materials and Methods) with viable P. gingivalis (Pg), heat-killed-Pg (HK-Pg), OMVs, or heat-inactivated-OMVs (HI-OMVs) and (A) the activation of inflammasome components in the lysates [or supernatants (sup) where indicated] measured after 24 h by Western blot; beta-actin serves as a loading control throughout. Western blot data are representative of at least three independent experiments. (B) Production of IL-1 beta and IL-18 (by ELISA) from BMM was measured in the supernatant at 24 h. Data are mean ± SD from four independent experiments. Cell viability was determined by measuring extracellular LDH release and by 7-AAD exclusion (by flow-cytometry) at 24 h. 7-AAD is a membrane impermeant dye that is excluded from viable cells. The percent of 7-AAD positive (±SD) cells from three independent experiments was calculated relative to the untreated control. BMM treated with H2O2 (1 mM for 60 min) were included as positive control for 7-AAD. A representative histogram is shown. Cells were also treated where indicated with OMVs in the presence of KYT-1 and KYT-36 (10 μM of each). *p < 0.05. Image collected and cropped by CiteAb from the following publication (https://pubmed.ncbi.nlm.nih.gov/28824884), licensed under a CC-BY license. Not internally tested by R&D Systems.
Detection of Mouse IL-1 beta/IL-1F2 by Western Blot
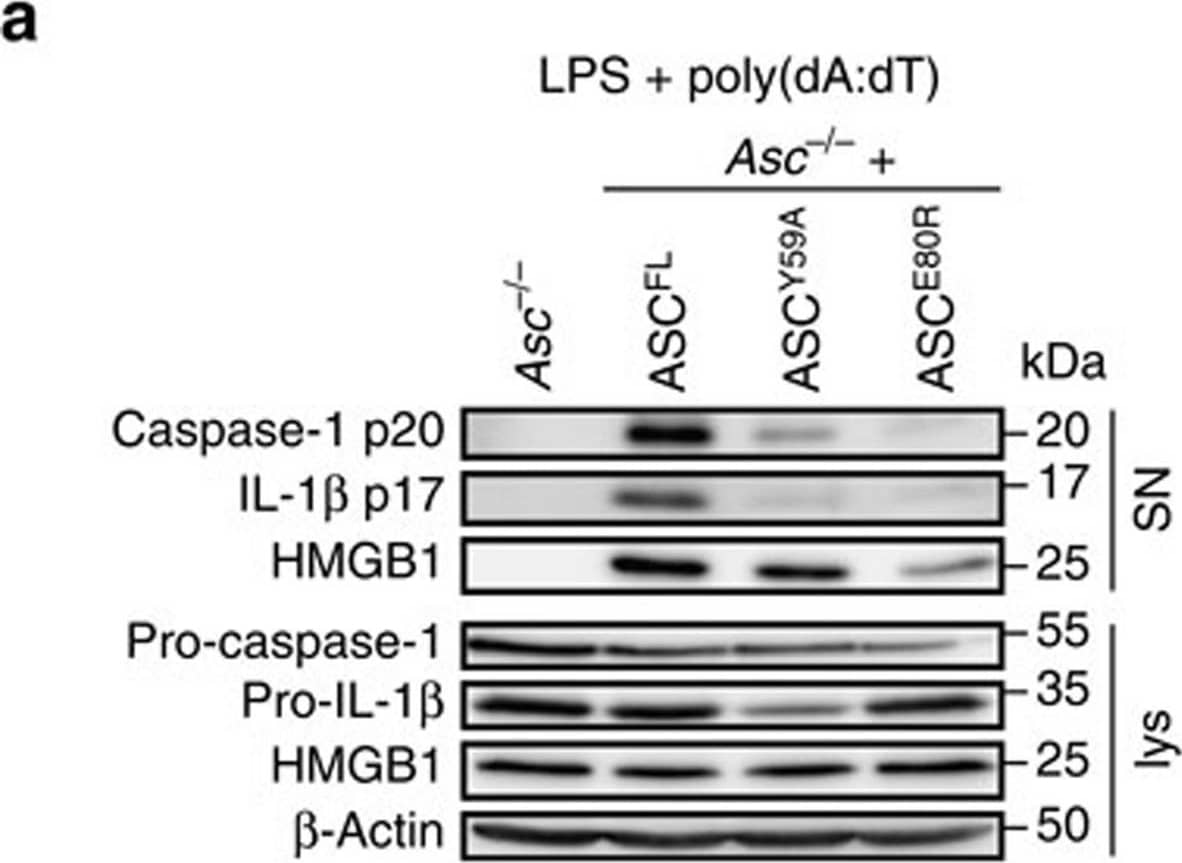
Caspase-1 but not gasdermin-D processing depends on ASC oligomerization.(a) Western blot analysis for cleaved caspase-1 p20, IL-1 beta p17, and HMGB-1 in cell supernatants (SN) and pro-caspase-1, pro-IL-1 beta and HMGB-1 in cell lysates (lys) of LPS-primed immortalized Asc−/− BMDMs or Asc−/− BMDMs expressing ASCFL, ASCY59A or ASCE80R 3 h after poly(dA:dT) transfection (1 μg ml−1). (b) Release of LDH from LPS-primed immortalized Asc−/− BMDMs or Asc−/− BMDMs expressing ASCFL, ASCY59A or ASCE80R, or derived Casp1 knockouts 3 h after poly(dA:dT) transfection (1 μg ml−1). (c) Western blot analysis for processing of full-length gasdermin-D (GSDMDFL) into the active N-terminal fragment (GSDMDN-term) in combined lysates and supernatants (lys + SN) of LPS-primed immortalized Asc−/− BMDMs expressing ASCFL, ASCY59A or ASCE80R, or derived Casp1 knockouts 3 h after poly(dA:dT) transfection (1 μg ml−1). Arrowhead, gasdermin-DNterm p30; *a cross-reacting band. (d) Release of LDH from LPS-primed primary C57BL/6 WT (WT), Casp1−/−/Casp11−/− or Asc−/− BMDMs infected with S. Typhimurium (multiplicity of infection (MOI)=10, 1 h). (e) Western blot analysis for processing of full-length gasdermin-D (GSDMDFL) into the active N-terminal fragment (GSDMDN-term) in combined lysates and supernatants (lys+SN) of LPS-primed primary C57BL/6 WT (WT), Casp1−/−/Casp11−/− or Asc−/− BMDMs infected with S. Typhimurium (MOI=10, 1 h) or left uninfected. Arrowhead, gasdermin-DNterm p30; *a cross-reacting band; ** a S. Typhimurium-specific cross-reactive band. See also Supplementary Figs 8 and 9. Image collected and cropped by CiteAb from the following publication (https://www.nature.com/articles/ncomms11929), licensed under a CC-BY license. Not internally tested by R&D Systems.
Detection of Mouse Mouse IL-1 beta/IL-1F2 Antibody by Western Blot
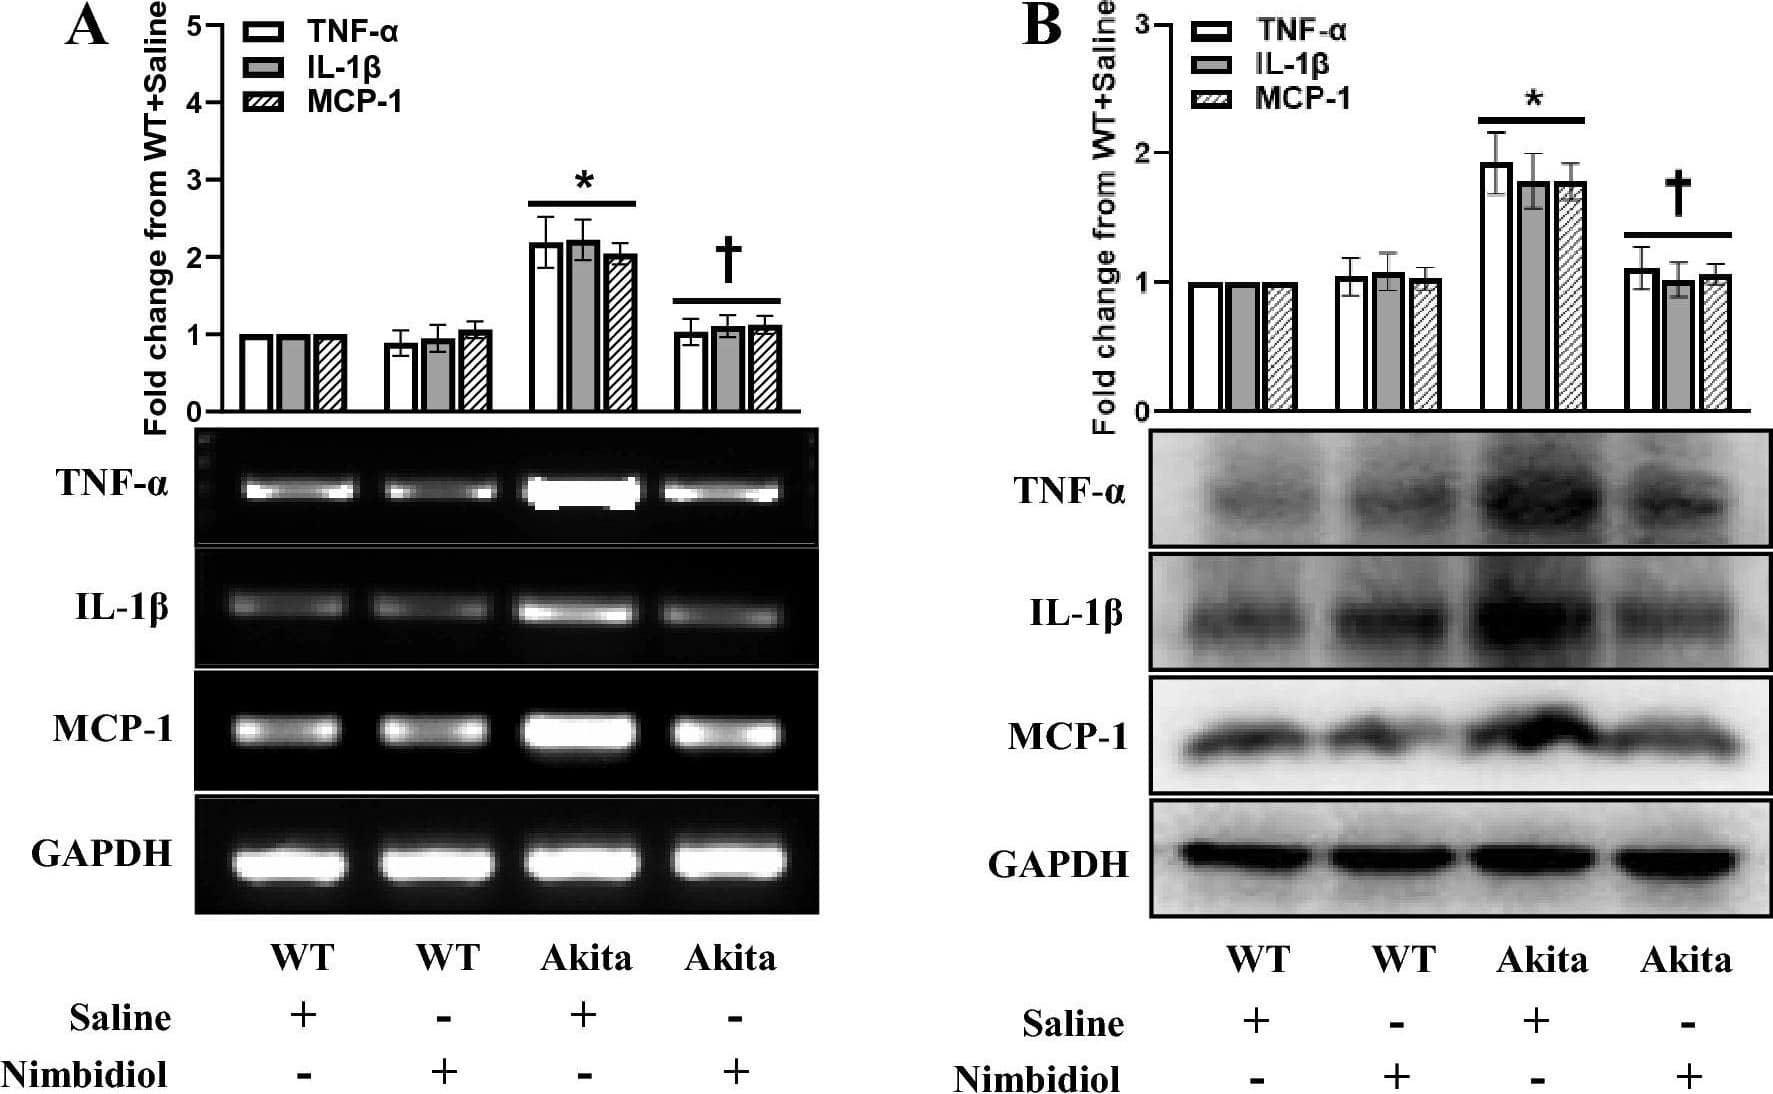
Nimbidiol treatment mitigated elevated pro-inflammatory cytokine and chemokine in the diabetic kidney. Representative images from (A) Semi-quantitative RT-PCR analyses showing gene expression and (B) western blot analyses showing protein expression of TNF-alpha, IL-1 beta and MCP-1 in the kidney. The bar diagrams represent the fold change from WT + Saline. Data are mean ± SD (n = 6/group). *p < 0.05 versus WT + Saline, WT + Nimbidiol and Akita + Nimbidiol, †p < 0.05 versus Akita + Saline. Image collected and cropped by CiteAb from the following publication (https://pubmed.ncbi.nlm.nih.gov/36522378), licensed under a CC-BY license. Not internally tested by R&D Systems.
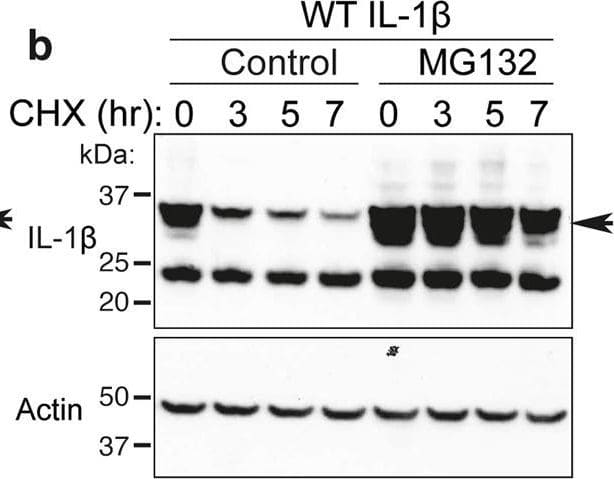
Detection of Mouse IL-1 beta/IL-1F2 by Western Blot
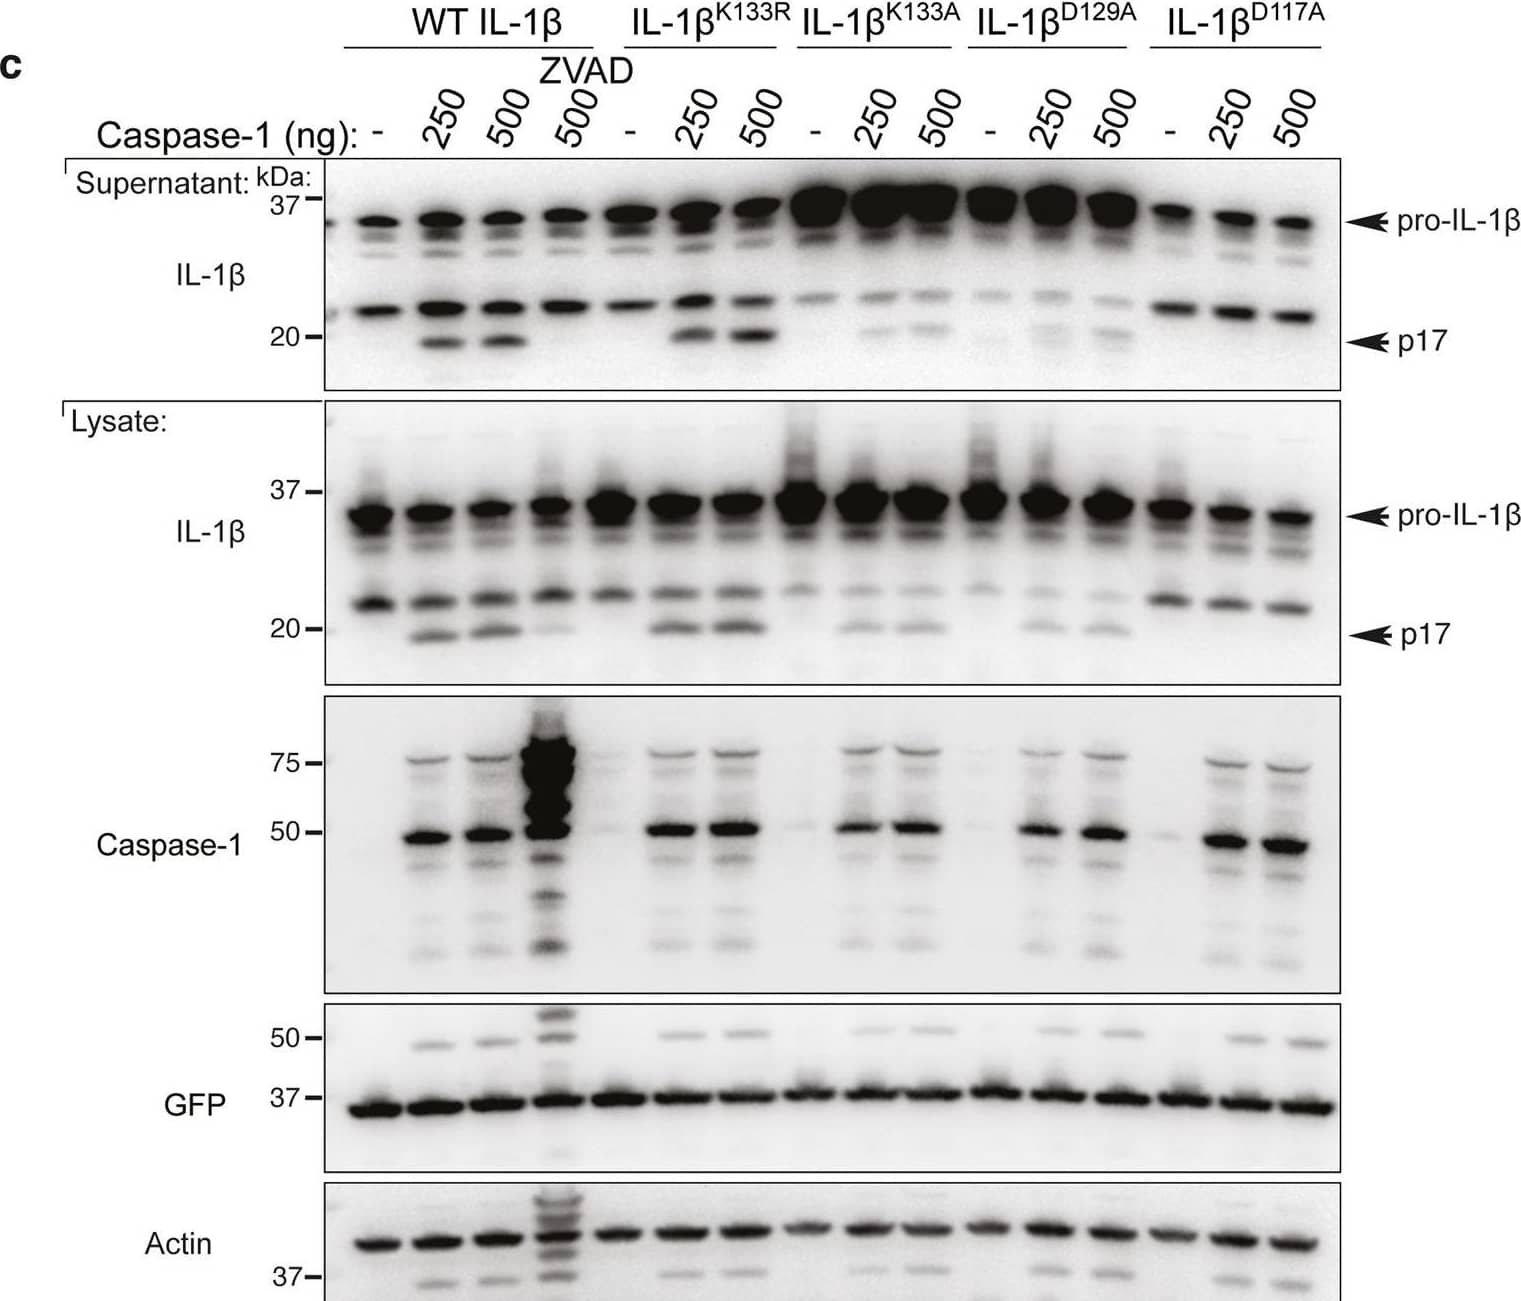
Loss IL-1 beta K133 ubiquitylation or the IL-1 beta K133:D129 salt bridge stabilizes IL-1 beta.a WT Il1b, Il1bK133A and Il1bD129A cDNAs were expressed in 293T cells and 48 h after transfection cells exposed to cycloheximide (CHX, 20 μg/ml) for up to 7 h. Cell lysates were immunoblotted for IL-1 beta levels. The arrow indicates pro-IL-1 beta. Actin is included as a loading control. One of three experiments. b WT Il1b cDNA was transfected into 293T cells and after 48 h cells were cultured with MG132 (20 μM) as indicated for 15 min prior to cycloheximide (CHX, 20 μg/ml) treatment for up to 7 h. Immunoblots were performed on total cell lysates for IL-1 beta protein levels. The arrow indicates pro-IL-1 beta. Actin is included as a loading control. One of two experiments. c 293T cells expressing WT IL-1 beta, IL-1 betaK133R, IL-1 betaK133A, IL-1 betaD129A and IL-1 betaD117A were co-transfected with Caspase-1 (250 or 500 ng) in the presence or absence of the pan-caspase inhibitor Z-VAD-fmk (50 μM) for 24 h. Immunoblots were performed on cell supernatants and total cell lysates for the indicated proteins. One of 2–3 experiments. d, e 293T cells expressing WT IL-1 beta, IL-1 betaK133R, IL-1 betaK133A, IL-1 betaS134A (phospho-ablating) and IL-1 betaS134E (phospho-mimetic) were co-transfected with 200 and 400 ng of d Caspase-1 or e Caspase-8, as indicated, for 24 h. IL-1 beta secretion was analyzed by ELISA. Data are the mean + S.D of three independent experiments. Image collected and cropped by CiteAb from the following open publication (https://pubmed.ncbi.nlm.nih.gov/33976225), licensed under a CC-BY license. Not internally tested by R&D Systems.
Detection of Mouse IL-1 beta/IL-1F2 by Western Blot
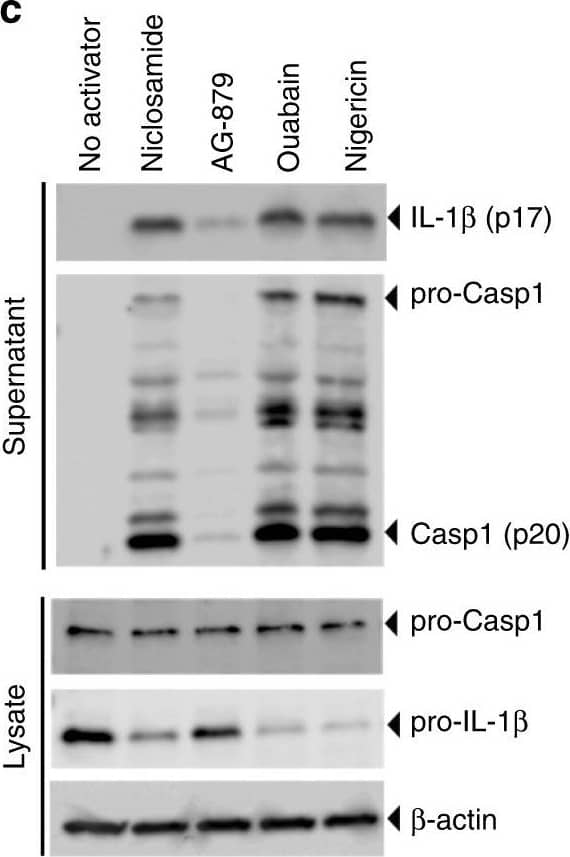
Identification of new NLRP3 inflammasome activators. a Schematic of activator-suppressor screens for IL-1 beta release. b Effect of the top 3 activators (6 h treatment, this notation is used throughout the figure legends) on IL-1 beta release (nigericin; positive control). c Immunoblot of biologically active IL-1 beta (p17) and caspase-1 (Casp1; p20) following activator treatment (3 h). Data represent two independent experiments; full gel images are in Supplementary Figure 14. d Effect of gene knockout of NLRP3 inflammasome components on IL-1 beta release (6 h). Guide RNA corresponding to non-targeting negative controls (N.Ctl) or gene-specific targets are indicated. e Effect of activators on LDH release (1 h, 3 h, 6 h). f Effect of P2RX7 antagonist on IL-1 beta release (1 h A438079 pretreatment followed by 6 h activator treatment in the presence of A438079). Data are mean ± s.d.; n = 3 (b, f), 6 (e), or 8 (d) biological replicates from one independent experiment; data are representative of two independent experiments. P values were determined by two-way ANOVA followed by Tukey’s multiple testing (d, e). *P < 0.0001 compared to N.Ctl1 (d) or no activator control of each time point (e). THP-1 macrophages (b, c, e, f) or THP-1 macrophages expressing guide RNA (d) were used for measurements. Activators were used at 1 μM (niclosamide), 2.5 μM (AG-879), 1 μM (ouabain), 20 μM (nigericin), or 5 mM (ATP) (c–f) Image collected and cropped by CiteAb from the following open publication (https://pubmed.ncbi.nlm.nih.gov/30740538), licensed under a CC-BY license. Not internally tested by R&D Systems.
Detection of Mouse IL-1 beta/IL-1F2 by Western Blot
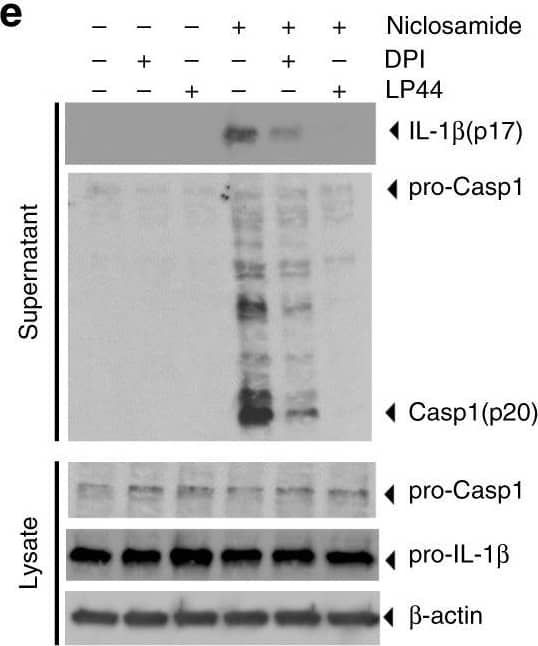
Niclosamide-biased suppressors prevent intracellular potassium loss. a Results of suppressor screens using nigericin (20 μM) or niclosamide (5 μM) as activators. Yellow circles indicate the top 60 validated activators. b, c Effect of niclosamide-biased suppressors on IL-1 beta release. d Effect of suppressors on LDH release. e Immunoblot of biologically active IL-1 beta (p17) and caspase-1 (Casp1; p20) after suppressor treatment. Data represent two independent experiments. Full gel images are shown in Supplementary Figure 14. f FACS analysis of mitochondrial ROS. Data represent three independent experiments. g Effect of suppressors on intracellular potassium level. h Rescue of IL-1 beta release by nigericin following suppressor treatment. Numbers (1–3) represent experimental scheme illustrated above the figure panel. Data are mean ± s.d.; n = 3 (b, c), 4 (g), 5 (h), or 6 (d) biological replicates from one independent experiment; data are representative of two independent experiments. P values were determined by two-way ANOVA followed by Tukey’s multiple testing. *P < 0.05, ***P < 0.001, ****P < 0.0001 as indicated. THP-1 macrophages (a–e, h) or THP-1 macrophages expressing NLRP3 guide RNA (f, g) were used for measurements. 1 h suppressor treatment (10 μM DPI, 10 μM LP44, or as indicated) was followed by 1 h (f) or 6 h (b–e, g–h) activator treatment (1 μM niclosamide, 20 μM nigericin, 1 μM ouabain, or 250 μg mL−1 silica) in the presence of suppressors (b–h). Nigericin rescue (h) (20 μM) for 1 h was performed following 6 h niclosamide treatment Image collected and cropped by CiteAb from the following open publication (https://pubmed.ncbi.nlm.nih.gov/30740538), licensed under a CC-BY license. Not internally tested by R&D Systems.
Detection of IL-1 beta/IL-1F2 by Western Blot
Cleavage of NLRP1B is sufficient to promote inflammasome activation.A) 293T cells were transfected with WT, TEV-site2 or TEV-site1 GFP-HA-NLRP1B along with empty vector, TEV expression vector, or a LF expression plasmids. In all conditions cells were also co-transfected with Casp1 and Il1b expression vectors. Cleavage of GFP-HA-NLRP1B and IL-1 beta was determined 24 h post transfection. B) Immortalized B6 macrophages were transduced with a retrovirus encoding the indicated GFP-HA-NLRP1B form followed by a sequential transduction with a TEV-expression retrovirus co-expressing THY1.1. Percent transduction was determined by measuring expression of the respective retroviral integration markers (GFP and anti-THY1.1-PE-Cy7) by flow cytometry, and are expressed in relative fluorescent units (RFU). The numbers within each quadrant represent the percentage of live cells within the respective quadrant. C) RAW264.7 macrophages were transduced with GFP-HA-NLRP1B and a Tet-On construct expressing the indicated gene. Cells were treated with 5 µg/ml doxycycline for 20 h and supernatants were assayed for LDH release. D) 293T cells were transfected with empty vector, FL-NLRP1B-HA, the truncated NLRP1B-HA, or deltaLRR HA-NLRP1B, along with Casp1 and Il1b and assayed by immunoblotting. Image collected and cropped by CiteAb from the following open publication (https://pubmed.ncbi.nlm.nih.gov/23818853), licensed under a CC-BY license. Not internally tested by R&D Systems.
Detection of Mouse IL-1 beta/IL-1F2 by Western Blot
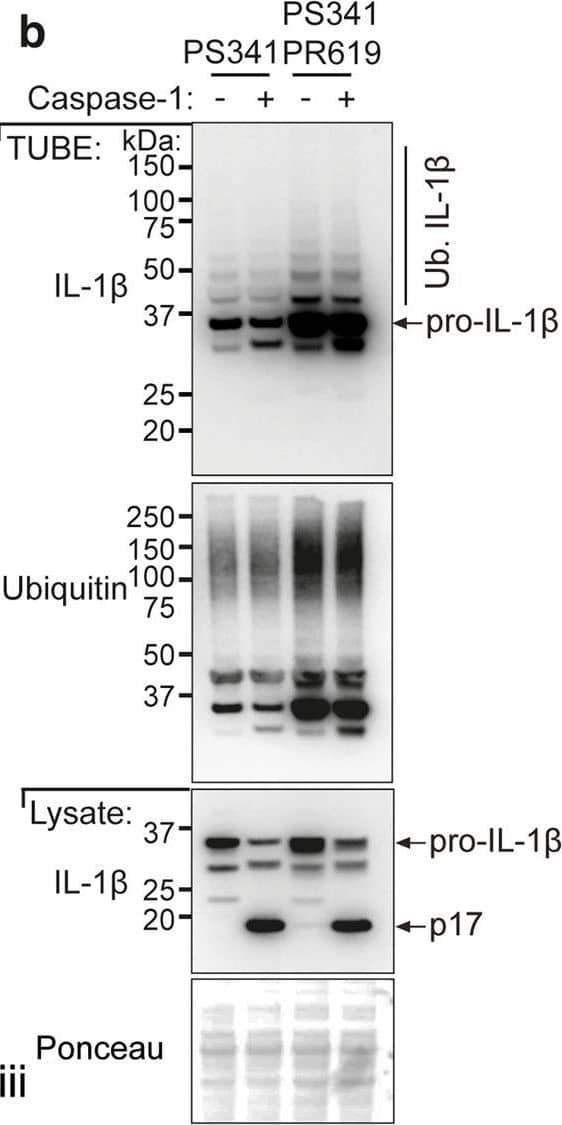
LPS-induced IL-1 beta is increased in Il1bK133R/K133R mice in vivo.a BMDMs derived from mice of the indicated genotypes were treated with LPS (100 ng/ml) for 3 h, followed by proteasome inhibition (PS341, 10 μM) for an additional 3 h. Biotin conjugated IL-1 beta antibody was used to purify IL-1 beta from cell lysates and its modification analyzed using the indicated ubiquitin (Ub) chain-specific antibodies. Cell lysates from the same experiment were run in triplicate with roman numerals on the bottom right of the blots indicating the membrane probed. One of two independent experiments. b BMDMs were primed with LPS (100 ng/ml) for 3 h followed by treatment for a further 3 h with PS341 (10 μM). Cells were subsequently lysed in buffer containing either PS341 (10 μM), or PS341 and PR619 (10 μM), as indicated. Recombinant caspase-1 (5 Units) was added and cell lysates incubated at 37 °C for 80 min. Subsequently, ubiquitylated proteins were purified by Tandem Ubiquitin Binding Entities (TUBEs) and analyzed by immunoblot. One of two independent experiments. c–f WT and Il1bK133R/K133R mice were injected intra-peritoneally with 100 μg of LPS. After 2 h serum and peritoneal fluid was harvested and analyzed by ELISA for levels of c IL-1 beta, d TNF, and e IL-6. Data are mean ± SEM, symbols represent individual mice, n ≥ 19 mice/genotype from three pooled independent experiments for c, d and n ≥ 14 for e from 2 to 3 pooled experiments. P-values were calculated using an unpaired two-tailed t-test for comparisons between genotypes. f Peritoneal fluid was analyzed by immunoblot for the indicated proteins. Each lane represents an individual mouse. n = 5–6 mice per genotype. One of two independent experiments (analysis of nine additional WT and 19 Il1bK133R/K133R mice are shown in Supplementary Fig. 7b). Image collected and cropped by CiteAb from the following open publication (https://pubmed.ncbi.nlm.nih.gov/33976225), licensed under a CC-BY license. Not internally tested by R&D Systems.
Detection of Mouse IL-1 beta/IL-1F2 by Western Blot
Loss IL-1 beta K133 ubiquitylation or the IL-1 beta K133:D129 salt bridge stabilizes IL-1 beta.a WT Il1b, Il1bK133A and Il1bD129A cDNAs were expressed in 293T cells and 48 h after transfection cells exposed to cycloheximide (CHX, 20 μg/ml) for up to 7 h. Cell lysates were immunoblotted for IL-1 beta levels. The arrow indicates pro-IL-1 beta. Actin is included as a loading control. One of three experiments. b WT Il1b cDNA was transfected into 293T cells and after 48 h cells were cultured with MG132 (20 μM) as indicated for 15 min prior to cycloheximide (CHX, 20 μg/ml) treatment for up to 7 h. Immunoblots were performed on total cell lysates for IL-1 beta protein levels. The arrow indicates pro-IL-1 beta. Actin is included as a loading control. One of two experiments. c 293T cells expressing WT IL-1 beta, IL-1 betaK133R, IL-1 betaK133A, IL-1 betaD129A and IL-1 betaD117A were co-transfected with Caspase-1 (250 or 500 ng) in the presence or absence of the pan-caspase inhibitor Z-VAD-fmk (50 μM) for 24 h. Immunoblots were performed on cell supernatants and total cell lysates for the indicated proteins. One of 2–3 experiments. d, e 293T cells expressing WT IL-1 beta, IL-1 betaK133R, IL-1 betaK133A, IL-1 betaS134A (phospho-ablating) and IL-1 betaS134E (phospho-mimetic) were co-transfected with 200 and 400 ng of d Caspase-1 or e Caspase-8, as indicated, for 24 h. IL-1 beta secretion was analyzed by ELISA. Data are the mean + S.D of three independent experiments. Image collected and cropped by CiteAb from the following open publication (https://pubmed.ncbi.nlm.nih.gov/33976225), licensed under a CC-BY license. Not internally tested by R&D Systems.
Detection of Mouse IL-1 beta/IL-1F2 by Western Blot
PEG-Arg1 treatment reduced retinal inflammation and reversed MΦ/microglia soma enlargement. (A,C) Representative Western blots of the pro-inflammatory cytokines IL-1 beta and TNF- alpha in retinal protein lysates from PEG-A1-treated db/db mice with quantification (B,D, respectively) compared with the PEG-treated db/db controls (n = 6/group, * p < 0.05, ** p < 0.01). (E) Retinal flat-mounts imaged at the level of the superficial vascular plexus labeled with isolectin B4 (vasculature) and Iba-1 (MΦ/microglia) with Iba-1 in the enlarged inset (boxed in white) showing exceptionally enlarged perivascular MΦ/microglia. (F) Quantification of MΦ/microglia soma size, demonstrating significant size reductions in the db/db mice treated with PEG-Arg1 compared with the vehicle-treated controls (n = 3 mice/group, * p < 0.05). Image collected and cropped by CiteAb from the following open publication (https://pubmed.ncbi.nlm.nih.gov/36139465), licensed under a CC-BY license. Not internally tested by R&D Systems.
Detection of Mouse IL-1 beta/IL-1F2 by Western Blot
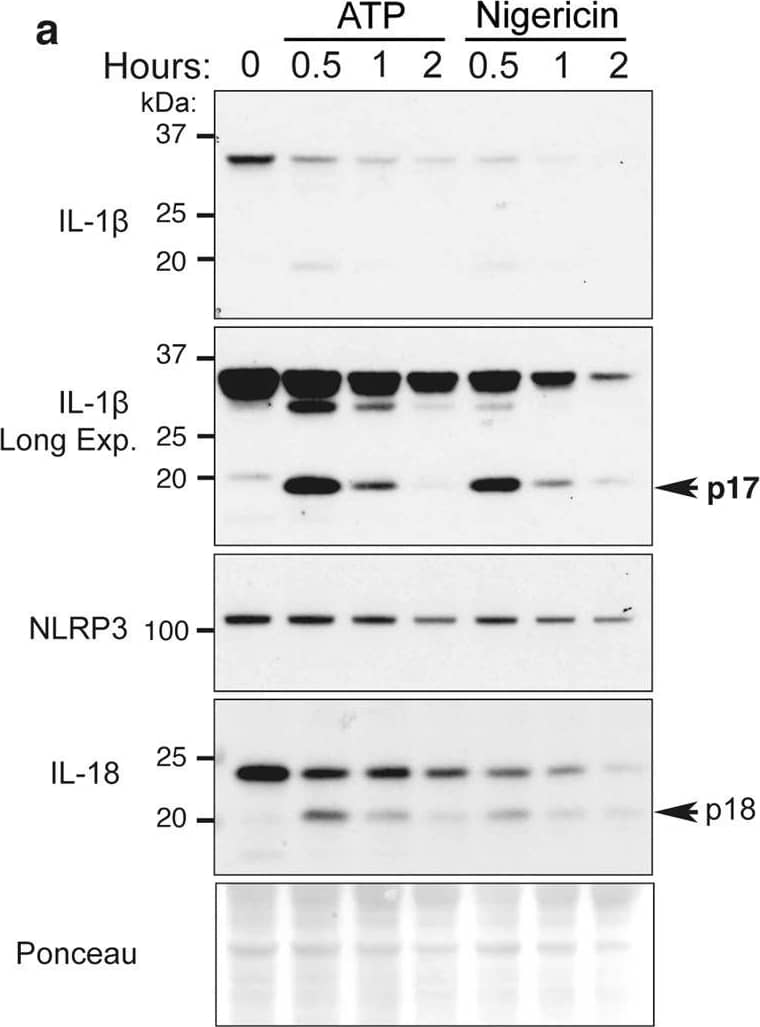
ATP and nigericin can augment proteasomal-mediated IL-1 beta degradation.a BMDMs were primed with Lipopolysaccharide (LPS, 50 ng/ml) for 3 h and stimulated with ATP (5 mM) and Nigericin (10 μM) for up to 2 h. Total cell lysates were analyzed by immunoblot. One of three experiments. b, cCaspase-1−/− BMDMs were primed with LPS (50 ng/ml) for 3 h, and in the last 30 min of priming treated with MG132 (20 μM), as indicated. Cells were treated with b ATP (5 mM) and c Nigericin (10 μM) for up to 90 min. Immunoblots were performed on total cell lysates to detect the specified proteins. One of three experiments. d WT, Nlrp3−/−, Asc−/− and Caspase-1−/− BMDMs were primed with LPS (50 ng/ml) for 3 h and stimulated with ATP for 20 min. Ubiquitylated (Ub.) proteins were purified from cell lysates by Tandem Ubiquitin Binding Entities (TUBEs). Immunoblots were performed on cell lysates and TUBE isolated ubiquitylated proteins for the indicated proteins. One of two experiments. Image collected and cropped by CiteAb from the following open publication (https://pubmed.ncbi.nlm.nih.gov/33976225), licensed under a CC-BY license. Not internally tested by R&D Systems.
Detection of Mouse IL-1 beta/IL-1F2 by Western Blot
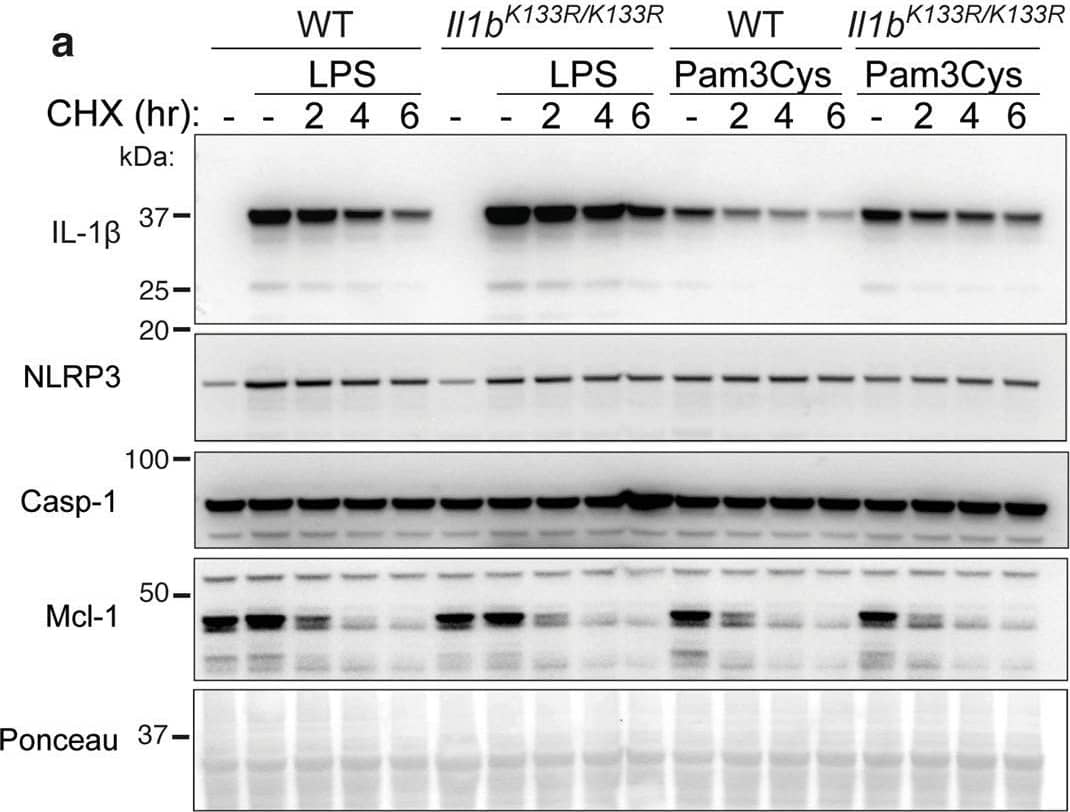
Loss of K133 ubiquitylation in mice stabilizes IL-1 beta and increases IL-1 beta activation.a. WT and Il1bK133R/K133R BMDMs were primed with Lipopolysaccharide (LPS, 50 ng/ml) or Pam3Cys-Ser-(Lys)4 (Pam3Cys, 500 ng/ml) for 3 h with Q-VD-OPh (20 μM) added in the last 30 min of priming. Cells were then treated with the protein synthesis inhibitor cycloheximide (CHX, 20 μg/ml) for up to 6 h. Total cell lysates were analyzed for the indicated proteins by immunoblot. One of four experiments. b, c WT and Il1bK133R/K133R BMDMs were primed with LPS (50 ng/ml) for 3 h and then treated with ATP (5 mM) and Nigericin (10 μM) for the times indicated in Opti-MEM media. b IL-1 beta and c TNF levels were measured in cell supernatants by ELISA. Data are the mean + SD of two independent experiments combined using three mice of each genotype. d WT and Il1bK133R/K133R BMDMs were primed with LPS (50 ng/ml) for 3 h and treated with ATP (5 mM) and Nigericin (10 μM) for up to 60 min in Opti-MEM media. Cell supernatants and lysates were analyzed by immunoblot for the indicated proteins. One of three experiments. e WT and Il1bK133R/K133R neutrophils sorted from bone marrow were primed with IFN gamma (50 ng/ml, 1 h) and then treated with LPS (100 ng/ml) for a further 3 h. Cells were then stimulated with Nigericin (10 μM) for up to 6 h, as indicated. Cell supernatants and lysates were analyzed by immunoblot for the specified proteins. One of three experiments. Image collected and cropped by CiteAb from the following open publication (https://pubmed.ncbi.nlm.nih.gov/33976225), licensed under a CC-BY license. Not internally tested by R&D Systems.
Detection of Mouse IL-1 beta/IL-1F2 by Western Blot
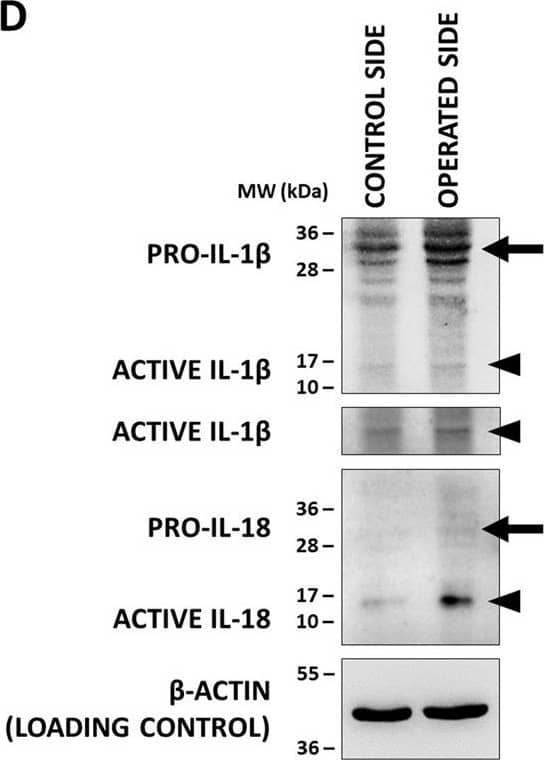
Co-localization of inflammasome components&production of active interleukin-1 beta (IL-1 beta)&IL-18 (IL-18) in the XII. nucleus. (D) Representative WB images of IL-1 beta&IL-18 proteins in of the hypoglossal nuclei after unilateral axotomy of corresponding brain nerve. Arrows indicate pro-forms, arrowheads show active cytokines. Image collected & cropped by CiteAb from the following open publication (https://pubmed.ncbi.nlm.nih.gov/33328988), licensed under a CC-BY license. Not internally tested by R&D Systems.
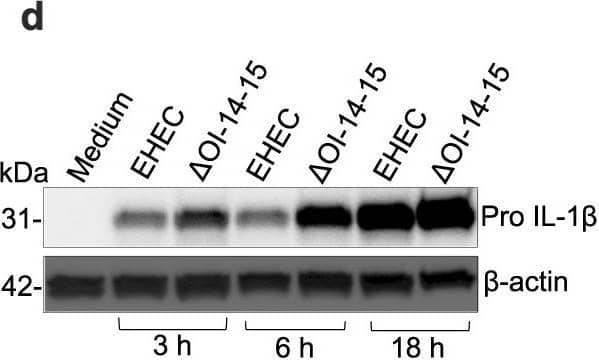
Detection of Mouse IL-1 beta/IL-1F2 by Western Blot
EhaF inhibits innate immune responses to EHEC infection.a–c, e–l Secretion of indicated cytokines by C57BL/6 or Tlr4−/− BMDMs infected with EHEC, the indicated isogenic mutant, or complement strains at an MOI of 50 (MOI of 50 for all infections hereafter unless otherwise indicated) or treated with 0.5 μg/ml LPS or 0.5 μg/ml Pam3CSK4 for 6 h (b, c, f, g, h, j, k) or 18 h (a, e, i, l). d Immunoblot for pro IL-1 beta and beta-actin in the lysates of BMDMs infected with EHEC or deltaOI-14-15 for the indicated times. m, n Fold increase in the expression of indicated genes in C57BL/6 or Tlr4−/− BMDMs infected with the indicated E. coli strains or treated with 0.5 μg/ml Pam3CSK4 relative to uninfected BMDMs (medium) as determined by real time quantitative PCR at 2 h post-stimulation. o, p Secretion of indicated cytokines by Caco2 cells infected with the indicated (on x-axis) MOI of EHEC or deltaEhaF for 24 h. a–c, e–p, Data (mean ± SEM) were from three independent experiments and each dot is a mean of each experiment’s technical replicates. d Immunoblot from one experiment representative of three independent experiments is shown. Statistical significance was assessed using one-way ANOVA (a–c, e–i) or two-way ANOVA (j–p) followed by Tukey’s post-test. p < 0.05 indicated statistical significance. Multiplicity adjusted p values are presented. Source data are provided as a Source Data file. Image collected and cropped by CiteAb from the following open publication (https://pubmed.ncbi.nlm.nih.gov/37041208), licensed under a CC-BY license. Not internally tested by R&D Systems.
Detection of Mouse IL-1 beta/IL-1F2 by Western Blot
Loss IL-1 beta K133 ubiquitylation or the IL-1 beta K133:D129 salt bridge stabilizes IL-1 beta.a WT Il1b, Il1bK133A and Il1bD129A cDNAs were expressed in 293T cells and 48 h after transfection cells exposed to cycloheximide (CHX, 20 μg/ml) for up to 7 h. Cell lysates were immunoblotted for IL-1 beta levels. The arrow indicates pro-IL-1 beta. Actin is included as a loading control. One of three experiments. b WT Il1b cDNA was transfected into 293T cells and after 48 h cells were cultured with MG132 (20 μM) as indicated for 15 min prior to cycloheximide (CHX, 20 μg/ml) treatment for up to 7 h. Immunoblots were performed on total cell lysates for IL-1 beta protein levels. The arrow indicates pro-IL-1 beta. Actin is included as a loading control. One of two experiments. c 293T cells expressing WT IL-1 beta, IL-1 betaK133R, IL-1 betaK133A, IL-1 betaD129A and IL-1 betaD117A were co-transfected with Caspase-1 (250 or 500 ng) in the presence or absence of the pan-caspase inhibitor Z-VAD-fmk (50 μM) for 24 h. Immunoblots were performed on cell supernatants and total cell lysates for the indicated proteins. One of 2–3 experiments. d, e 293T cells expressing WT IL-1 beta, IL-1 betaK133R, IL-1 betaK133A, IL-1 betaS134A (phospho-ablating) and IL-1 betaS134E (phospho-mimetic) were co-transfected with 200 and 400 ng of d Caspase-1 or e Caspase-8, as indicated, for 24 h. IL-1 beta secretion was analyzed by ELISA. Data are the mean + S.D of three independent experiments. Image collected and cropped by CiteAb from the following open publication (https://pubmed.ncbi.nlm.nih.gov/33976225), licensed under a CC-BY license. Not internally tested by R&D Systems.
Detection of Mouse IL-1 beta/IL-1F2 by Western Blot
Elevated retinal inflammation and MΦ/microglia soma enlargement in db/db mice. (A) Representative Western blots of IL-1 beta in retinal protein lysates with quantification in (B), demonstrating significant increases in IL-1 beta (n = 10) expression in db/db mice compared with the lean DB/+ controls. (C) Retinal flat-mounts imaged at the level of the superficial vascular plexus and labeled with isolectin B4 (vasculature) and Iba-1 (MΦ/microglia). White arrows point to the perivascular macrophages with Iba-1 in the enlarged inset (boxed in white) showing exceptionally enlarged perivascular MΦ/microglia. (D) Quantification of MΦ/microglia soma size, demonstrating a significant size increase in db/db mouse retinas compared with the lean controls (n = 3 mice/genotype, * p < 0.05). Data are presented as the mean ± SEM. Image collected and cropped by CiteAb from the following open publication (https://pubmed.ncbi.nlm.nih.gov/36139465), licensed under a CC-BY license. Not internally tested by R&D Systems.


