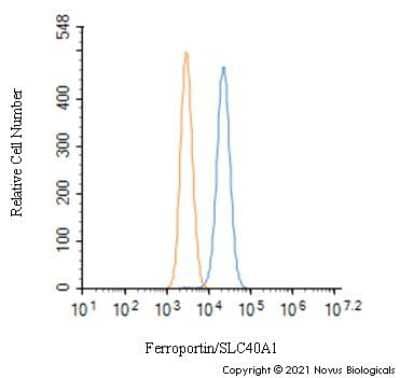
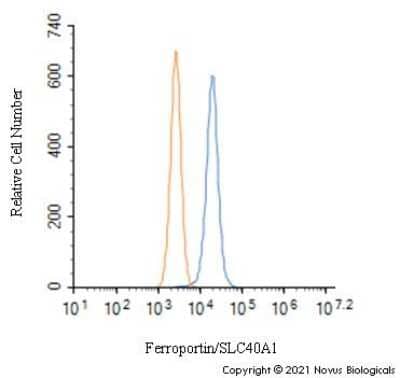
Flow Cytometry of HepG2 Cells Stained with Ferroportin/SLC40A1 Antibody
An intracellular stain was performed on HepG2 cells with Ferroportin/SLC40A1 Antibody NBP1-21502 (blue) and a matched isotype control NBP2-24891 (orange). Cells were fixed with 4% PFA and then permeabilized with 0.1% saponin. Cells were incubated in an antibody dilution of 1.0 ug/mL for 30 minutes at room temperature, followed by Rabbit IgG (H+L) Cross-Adsorbed Secondary Antibody, Dylight 550 (SA5-10033, Thermo Fisher).
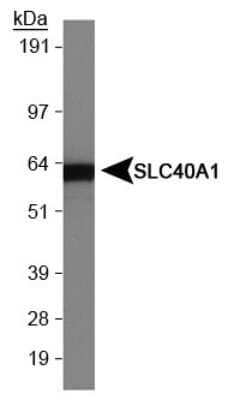
Western Blot Detection of Ferroportin/SLC40A1 in Human Intestine Lysate
Western blot of human intestine lysate (Molecular weight: 62.5 KDa) using Ferroportin/SLC40A1 Antibody.
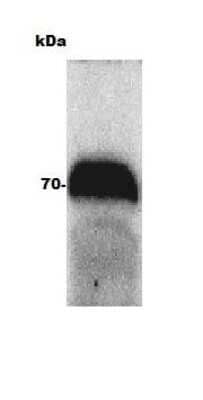
Western Blot Detection of Ferroportin/SLC40A1 in Bovine Adult Eye
Western blot of bovine adult eye using Ferroportin/SLC40A1 Antibody. Image from verified customer review.
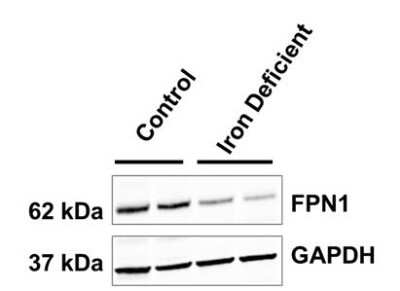
Western Blot Detection of Ferroportin/SLC40A1 in Porcine Duodenal Mucosa
Duodenal mucosa samples from weanling pigs with iron replete or iron deficient status were probed using (NBP1-21502; 1:1000 dilution) and GAPDH (loading control). Image from verified customer review.
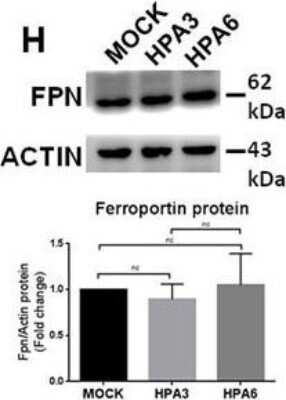
Western Blotting of Ferroportin/SLC40A1 in Control and Transfected HepG2 Cell Lines
HepG2 clones overexpressing heparanase showed a reduction of hepcidin expression and indices of iron loading. Two stable clones of HepG2 cells transfected with pcDNA3.1-HPA (HPA3 and HPA6) were analyzed for hepcidin expression, BMP/SMAD signaling and indices of iron status. Western blot of Ferroportin/SLC40A1 and its densitometry. The values are expressed as-dCt (for HPA mRNA) or as fold change over the control (MOCK) (for hepcidin and Id1 mRNA). The images are representative from three different analyses. Image collected and cropped by CiteAb from the following publication (https://dx.plos.org/10.1371:journal.pone.0164183), licensed under a CC-BY license.
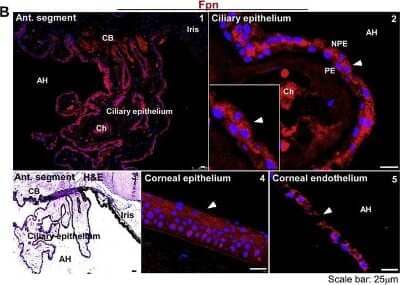
Immunohistochemical Staining of Ferroportin/SLC40A1 in Human Eye Segment
Immunostaining for Ferroportin/SLC40A1 shows uniform reactivity on the ciliary epithelium (panel 1). Fpn is expressed mainly in NPE cells (panel 2). H&E stained section shows orientation of the ciliary epithelium with respect to the iris and AH (panel 3). Fpn is expressed on corneal epithelium (panel 4) and endothelium (panel 5). Scale bar: 25 um. Image collected and cropped by CiteAb from the following publication (//pubmed.ncbi.nlm.nih.gov/29859760/) licensed under a CC-BY license.
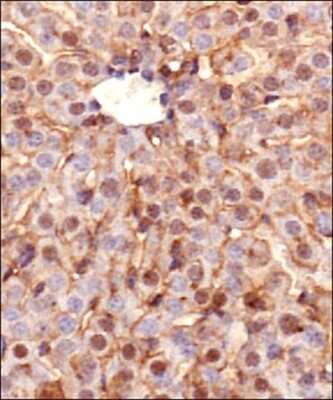
Immunohistochemical Detection of Ferroportin/SLC40A1 in Murine Liver
Detection of Ferroportin/SLC40A1 protein in murine liver section using Ferroportin/SLC40A1 Antibody at a dilution of 1:200. The representative image shows intense staining in the cellular membranes, whereas, a relatively milder postivity was observed in the cytoplasm of hepatocytes.
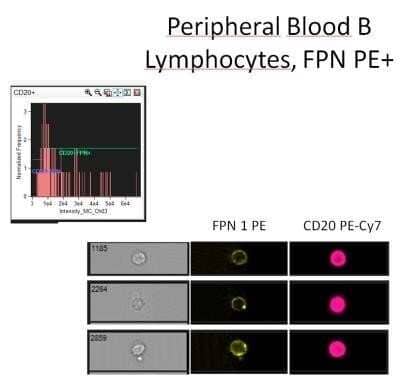
Flow Cytometry Analysis of B Lymphocytes Stained with Phycoerythrin Conjugated Ferroportin/SLC40A1 Antibody
Analysis using the PE conjugate of Ferroportin/SLC40A1 Antibody. Staining of Ferroportin in human B lymphocytes in peripheral blood using PE conjugated anti-Ferroportin/SLC40A1 antibody. Image from verified customer review.
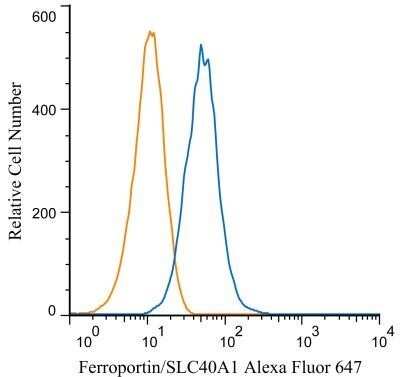
Flow Cytometry of HepG2 Cells Stained with Alexa Fluor 647 Conjugated Ferroportin/SLC40A1 Antibody
An intracellular stain was performed on HepG2 cells with NBP1-21502AF647 (blue) and a matched isotype control (orange, NBP2-24893AF647). Cells were fixed with 4% PFA and then permeablized with 0.1% saponin. Cells were incubated in an antibody dilution of 5 ug/mL for 30 minutes at room temperature. Both antibodies were conjugated to Alexa Fluor 647.
Flow Cytometry of Hek293 Cells Stained with Ferroportin/SLC40A1 Antibody
An intracellular stain was performed on Hek293 cells with NBP1-21502 (blue) and a matched isotype control NBP2-24891 (orange). Cells were fixed with 4% PFA and then permeabilized with 0.1% saponin. Cells were incubated in an antibody dilution of 1.0 ug/mL for 30 minutes at room temperature, followed by Rabbit IgG (H+L) Cross-Adsorbed Secondary Antibody, Dylight 550 (SA5-10033, Thermo Fisher).
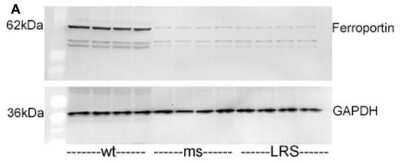
Western Blot: Ferroportin/SLC40A1 Antibody - BSA Free [NBP1-21502] -
Mouse ferroportin, 5-aminolevulinic acid synthase (ALAS), and ferritin light chain (FLC) proteins are increased in sickle mice overexpressing human wt-FHC. Proteins of subcellular fractions isolated from livers of wt-, ms-, and LRS-treated mice (n = 4) were run on a western blot (30 ug protein/lane) and immunostained for (A) microsomal ferroportin.
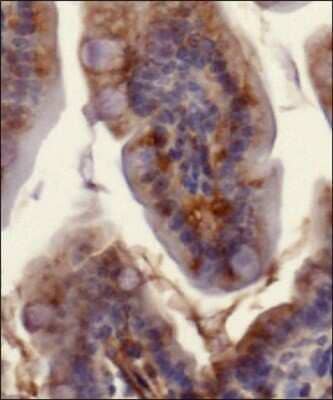
Immunohistochemistry-Paraffin: Rabbit Polyclonal Ferroportin/SLC40A1 Antibody [NBP1-21502] -
Immunohistochemistry-Paraffin: Rabbit Polyclonal Ferroportin/SLC40A1 Antibody [NBP1-21502] - Staining of mouse small intestines using Ferroportin/SLC40A1 Antibody. Tissue was fixed in formalin overnight and embedded in paraffin. ~5 micro sections on slides were dehydrated. Antigen retrieval was done using citrate buffer in rice steamer for 20mins. 1 hour blocking without permeabilization. Overnight primary ab incubation was done 1:200 (NBP1-21502) at 4C. 2-hr secondary antibody incubation was at room temp; mounting media with DAPI. Image from a verified customer review.
Western Blot: Ferroportin/SLC40A1 Antibody - BSA Free [NBP1-21502] -
Western Blot: Ferroportin/SLC40A1 Antibody - BSA Free [NBP1-21502] - Analysis of Cu & Fe content & metal-binding protein expression in wild-type & PrPC-null mouse total brain at different ages. (A) The graph shows the ratio of Cu & Fe levels in Prnp0/0 & Prnp+/+ brain samples (P1, P365 N = 4; P7, P30, P180 N = 6; P90 N = 5). (B) Representative Western blot images showing metal-binding protein levels in Prnp0/0 & Prnp+/+ brain samples (N = 4). The constant level of the housekeeping proteins ( beta-III Tubulin & beta-Actin) are also reported. (C) The graph shows the up- or down-regulation of protein expression in Prnp0/0 samples compared to Prnp+/+, i.e., (Prnp0/0 protein OD/housekeeping OD)/(Prnp+/+ protein OD/housekeeping OD). All error bars indicate SD; N = 4 minimum; *p < 0.05; **p < 0.01; ***p < 0.001. Image collected & cropped by CiteAb from the following publication (https://pubmed.ncbi.nlm.nih.gov/27729845), licensed under a CC-BY license. Not internally tested by Novus Biologicals.
Western Blot: Ferroportin/SLC40A1 Antibody - BSA Free [NBP1-21502] -
Western Blot: Ferroportin/SLC40A1 Antibody - BSA Free [NBP1-21502] - Fisetin alleviates DOX-induced ferroptosis via the SIRT1/Nrf2-regulated signaling pathway. (A & B). Western blot results of SIRT1 protein levels after SIRT1 siRNA transfection. (C). Western blot of nuclear & cytosol Nrf2 levels in vitro after treatment with DOX and/or fisetin, SIRT1 siRNA. (D–E) nucleus or cytosol Nrf2 protein from Western blot results. (F). Protein expression levels of SIRT1, GPX4, Keap1, HO-1, FTH1, FTL, FPN, TfR1, & nuclear Nrf2 in H9c2 cells administrated with DOX and/or fisetin, SIRT1 siRNA. (G). Quantification of SIRT1, GPX4, Keap1, HO-1, FTH1, FTL, FPN, & TfR1 protein from Western blot results (n = 4). The values are presented as mean ± SD. *p < 0.05; **p < 0.01; ***p < 0.001; NS, no significance. Image collected & cropped by CiteAb from the following publication (https://pubmed.ncbi.nlm.nih.gov/35273493), licensed under a CC-BY license. Not internally tested by Novus Biologicals.
Western Blot: Ferroportin/SLC40A1 Antibody - BSA Free [NBP1-21502] -
Western Blot: Ferroportin/SLC40A1 Antibody - BSA Free [NBP1-21502] - Transgenic mice overexpressing heparanase have increased ferritin-iron & ferritin protein content in the liver.(A & B) Western blot of liver extracts from WT & TG-HPA mice (A) for ferritin L-chain (FTL) subunits in SDS-PAGE with GAPDH as calibrator & (B) for assembled ferritin in non-denaturing PAGE. (C) Prussian blue stain of non-denaturing PAGE loaded with 50 ug protein, before (upper) & after enhancing with DAB & H2O2 (lower). rFTL is control purified recombinant mouse FTL. (D) Western blot of Ferroportin (FPN) & (E) of Transferrin Receptor1 (TfR1) & their respective GAPDH as calibrator. Densitometry data were obtained from 3 independent experiments. Image collected & cropped by CiteAb from the following publication (https://pubmed.ncbi.nlm.nih.gov/27711215), licensed under a CC-BY license. Not internally tested by Novus Biologicals.
Western Blot: Ferroportin/SLC40A1 Antibody - BSA Free [NBP1-21502] -
Western Blot: Ferroportin/SLC40A1 Antibody - BSA Free [NBP1-21502] - Sodium ascorbate (150 μM) was added to the apical and/or basal medium of Caco-2 cells cultured on permeable Transwell® inserts. Ferroportin protein expression was measured with ELISA. Data are means ± SD, n = 12. Significant differences from the baseline (0 μM) are labeled with an asterisk (*). A western blot of ferroportin at the corresponding treatments is shown above the graph. Image collected & cropped by CiteAb from the following publication (http://www.mdpi.com/2072-6643/6/1/249), licensed under a CC-BY license. Not internally tested by Novus Biologicals.
Western Blot: Ferroportin/SLC40A1 Antibody - BSA Free [NBP1-21502] -
Western Blot: Ferroportin/SLC40A1 Antibody - BSA Free [NBP1-21502] - PPAR delta knockdown abrogated the effects of GW501516 on 6-OHDA-triggered protein levels of DMT1, FPN1, & Ferritin, & mRNA expression of DMT1. Cells stably expressing shRNA targeting scrambled sequences or PPAR delta were pretreated with DMSO or GW501516 for 8 h, & subsequently incubated with or without 6-OHDA for 16 h. Total RNA & protein were extracted, & levels of mRNA & protein were analyzed by real-time PCR (A–E) & Western blot (F). RPS18 & alpha-tubulin were used as internal controls for real-time PCR & Western blot, respectively. Results are expressed as means of triplicate ± SE (A–D). * p < 0.05, ** p < 0.01 relative to untreated group; #p < 0.05 relative to 6-OHDA-treated group. Image collected & cropped by CiteAb from the following publication (https://pubmed.ncbi.nlm.nih.gov/35624674), licensed under a CC-BY license. Not internally tested by Novus Biologicals.
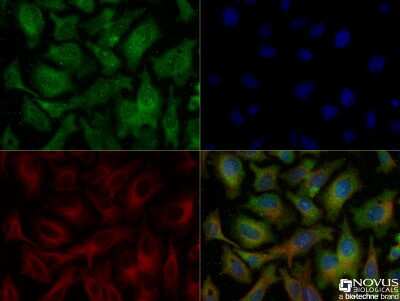
Immunocytochemistry/ Immunofluorescence: Ferroportin/SLC40A1 Antibody - BSA Free [NBP1-21502] -
Immunocytochemistry/ Immunofluorescence: Ferroportin/SLC40A1 Antibody - BSA Free [NBP1-21502] - The cellular localization of SIRT2 & FPN1 in the spinal cord. (A) SIRT2 levels decreased in the microglia of SNI rats. (B,C) FPN1 levels decreased in the microglia & neurons of SNI rats. The image in the first column on the left shows the overall outline of the spinal cord. Representative confocal images show the results of double immunofluorescence staining of SIRT2 or FPN1 (red) in the spinal dorsal horn; CD11b, a microglia marker (green) or NeuN, a neuronal marker (green) in the sham group & SNI group. Scale bars, 100 μm. SNI, spared nerve injury; SIRT2, sirtuin 2; FPN1, ferroportin 1. Image collected & cropped by CiteAb from the following publication (https://pubmed.ncbi.nlm.nih.gov/35401208), licensed under a CC-BY license. Not internally tested by Novus Biologicals.
Western Blot: Ferroportin/SLC40A1 Antibody - BSA Free [NBP1-21502] -
Western Blot: Ferroportin/SLC40A1 Antibody - BSA Free [NBP1-21502] - Inhibition of GLRX5 upregulates an iron-starvation response. (A-D) Protein & mRNA expression of (TfR1, TFRC), iron regulatory protein (IRP2, IREB2), ferritin (FTH1) & ferroportin (Fpn, SLC40A1) genes in HN4R cells stably transduced with a vector or shGLRX5 & GLRX5res, which were subjected to 1 mM SAS treatment for 24 h. (E-H) Aconitase & alpha-ketoglutarate dehydrogenase ( alphaKGDH) activities, immunoblots, & cell death of HN4R cells stably transduced with a vector control or shGLRX5 & resistant GLRX5 cDNA (GLRX5res) wild type (WT) or catalytically inactive mutant cDNA (K101Q). The error bars represent standard errors from three replicates. ** P < 0.01 between the different groups treated with SAS. Image collected & cropped by CiteAb from the following publication (https://pubmed.ncbi.nlm.nih.gov/32685019), licensed under a CC-BY license. Not internally tested by Novus Biologicals.
Immunocytochemistry/ Immunofluorescence: Ferroportin/SLC40A1 Antibody - BSA Free [NBP1-21502] -
Immunocytochemistry/ Immunofluorescence: Ferroportin/SLC40A1 Antibody - BSA Free [NBP1-21502] - The cellular localization of SIRT2 & FPN1 in the spinal cord. (A) SIRT2 levels decreased in the microglia of SNI rats. (B,C) FPN1 levels decreased in the microglia & neurons of SNI rats. The image in the first column on the left shows the overall outline of the spinal cord. Representative confocal images show the results of double immunofluorescence staining of SIRT2 or FPN1 (red) in the spinal dorsal horn; CD11b, a microglia marker (green) or NeuN, a neuronal marker (green) in the sham group & SNI group. Scale bars, 100 μm. SNI, spared nerve injury; SIRT2, sirtuin 2; FPN1, ferroportin 1. Image collected & cropped by CiteAb from the following publication (https://pubmed.ncbi.nlm.nih.gov/35401208), licensed under a CC-BY license. Not internally tested by Novus Biologicals.
Western Blot: Ferroportin/SLC40A1 Antibody - BSA Free [NBP1-21502] -
Western Blot: Ferroportin/SLC40A1 Antibody - BSA Free [NBP1-21502] - Effects of HDAC3 inhibition in vivo on hepcidin expression in iron-deficient mice. Four-week-old C57Bl/6 mice were fed a low-iron diet (2 ppm) for 3 weeks, followed by two doses of RGFP966 2 h apart, & killed 2 h following the second dose. Effect on hepatic aCdkn1a, bHamp1, cId1, dAtoh8, eSmad7, & fBmp6 mRNA expression, g liver iron. h Western blot for hepatic ferroportin expression. i Effect of RGFP966 on spleen iron. N = 6 per group. Data are means ± s.e.m. *P ≤ 0.05; **P ≤ 0.01; ***P ≤ 0.001; ****P ≤ 0.0001; NS, P > 0.05 Image collected & cropped by CiteAb from the following publication (https://pubmed.ncbi.nlm.nih.gov/28864822), licensed under a CC-BY license. Not internally tested by Novus Biologicals.
Western Blot: Ferroportin/SLC40A1 Antibody - BSA Free [NBP1-21502] -
Western Blot: Ferroportin/SLC40A1 Antibody - BSA Free [NBP1-21502] - SHP abrogates the BMP6 effect on iron metabolism through inhibition of hepcidin gene expression in mice.(a–d) C57/BL6 mice were injected with Ad-GFP (n = 4 per group, 5.9 × 10⁹ pfu) or Ad-Flag-SHP (n = 5 per group, 5.9 × 10⁹ pfu) via the tail-vein, & treated with Vehicle or BMP6 (500 μg/kg, i.p.) for 6 h at day 5 after the infection. (a) Serum iron level. (b) Q-PCR analysis showing hepcidin & SHP mRNA levels in liver. (c) Serum hepcidin levels. (d) Western blot analysis showing SMAD1/5/8 phosphorylation & SHP expression in liver. (e) Western blot analysis showing FPN expression in spleen (top). Graphical representation showing FPN expression (bottom). Data are presented as means ± SD. Arrows show locations of molecular weight markers. The western blot images were cropped with a grey cropping line. All gels for western blot analysis were run under the same experimental conditions. **P < 0.01, ***P < 0.001 by two-tailed Student t-test. Image collected & cropped by CiteAb from the following publication (https://www.nature.com/articles/srep34630), licensed under a CC-BY license. Not internally tested by Novus Biologicals.
Western Blot: Ferroportin/SLC40A1 Antibody - BSA Free [NBP1-21502] -
Western Blot: Ferroportin/SLC40A1 Antibody - BSA Free [NBP1-21502] - Upregulation of H3K4me3 increases iron exporter Fpn1 & exhibits neuroprotection.a, b CPI-455 treatment (24 h) increased the protein level of H3K4me3 & Fpn1 in SH-SY5Y cells. c MTT assay showed CPI-455 showed neuroprotection against the toxicity of 6-OHDA in SH-SY5Y cells. d–g SH-SY5Y cells were infected by AAV-KDM5C-silencing virus, & KDM5C was significantly decreased at the mRNA level as reflected by RT-PCR d & at the protein level by Western blot e, f. In addition, Fpn1 & H3K4me3 were increased in AAV-KDM5C-silencing virus infected cells e, f. Moreover, g silencing KDM5C showed a slight neuroprotection against 6-OHDA-induced PD model in SH-SY5Y cells. *P < 0.05; **P < 0.01; ***P < 0.001. Data are presented as mean ± SEM. n = 3–4 for each group in Western blot & n = 5 for each group in MTT assay. Image collected & cropped by CiteAb from the following publication (https://pubmed.ncbi.nlm.nih.gov/33116116), licensed under a CC-BY license. Not internally tested by Novus Biologicals.
Western Blot: Ferroportin/SLC40A1 Antibody - BSA Free [NBP1-21502] -
Western Blot: Ferroportin/SLC40A1 Antibody - BSA Free [NBP1-21502] - SHP deficiency alters hepcidin gene expression in liver of HID mice.(a–i) WT & SHP KO mice (n = 5 per group) were fed with high-iron diet (HID, 8 g/kg) for 3 weeks. (a) Serum iron level. (b) Hepcidin mRNA level in liver. (c) Hepcidin expression in mouse liver. IHC was performed using an antibody against hepcidin. Scale bar shows 50 μm. (d) Serum hepcidin level. (e) Western blot analysis (left panel) showing hepatic SHP & splenic FPN expression & graphical representation (right panel) showing splenic FPN expression. (f) Splenic iron level. (g) Perls’ prussian blue staining in spleen. Scale bar shows 200 μm. (h) BMP6 & BMP9 mRNA levels in liver. (i) Western blot analysis (top) & graphical representation (bottom) showing SMAD1/5/8 phosphorylation in liver. The grouping of the images is from different parts of the same gel. Data are presented as means ± SD. Arrows show locations of molecular weight markers. The experiment was repeated on a minimum of three separate occasions. The western blot images were cropped with a grey cropping line. All gels for western blot analysis were run under the same experimental conditions. *P < 0.05, **P < 0.01, ***P < 0.001 by two-tailed Student t-test. Image collected & cropped by CiteAb from the following publication (https://www.nature.com/articles/srep34630), licensed under a CC-BY license. Not internally tested by Novus Biologicals.
Western Blot: Ferroportin/SLC40A1 Antibody - BSA Free [NBP1-21502] -
Western Blot: Ferroportin/SLC40A1 Antibody - BSA Free [NBP1-21502] - Differential expression of proteins of iron metabolism in CCA cells. The CCA4, CCLP1 & HUCCT1 human CCA-derived cell lines were cultured as adherent monolayers (MON) or in 3D sphere conditions (SPH). Panel a. Top left, representative immunoblot analysis. Cell extracts were reacted with antibodies against transferrin receptor (TfR1), ferroportin (FPN), ferritin H subunit (FtH) & vinculin. Cropped blots are displayed. The original full blot images can be found in Supplementary Information. The graphs show densitometric quantification of immunoblot analyses. The values were normalized to vinculin & expressed as a fraction of respective MON cells normalized to 1. Mean values ± SEM (n = 6), *p ≤ 0.05, **p ≤ 0.01 vs control MON for each cell line. Panel b. RNA bandshift analysis of IRP activity. Cytoplasmic extracts were incubated with a 32P-labeled iron-responsive element (IRE) probe & RNA-protein complexes separated on non-denaturing polyacrylamide gels. On the left a representative autoradiogram is shown. A cropped gel is displayed. The original full gel image can be found in Supplementary Information. The graph on the right shows the densitometric quantification of IRPs bands by direct nuclear counting, as described in Materials & Methods; mean percentages ± SEM of control values (n = 6),, **p ≤ 0.01, ***p< 0.001 vs control MON for each cell line. Panel c. TfR1 & FPN mRNA levels were measured by quantitative RT-PCR. Samples were analyzed in triplicate, normalized to the housekeeping gene 18 S & expressed as percentage of respective MON cells normalized to 1. Mean values ± SEM (n = 6), **p ≤ 0.01 vs control MON for each cell line. Image collected & cropped by CiteAb from the following publication (https://pubmed.ncbi.nlm.nih.gov/29247214), licensed under a CC-BY license. Not internally tested by Novus Biologicals.
Western Blot: Ferroportin/SLC40A1 Antibody - BSA Free [NBP1-21502] -
Western Blot: Ferroportin/SLC40A1 Antibody - BSA Free [NBP1-21502] - Iron (55Fe) transport across the apical & basal borders. (a) Apical transport (uptake) of 55Fe in response to intracellular/basal ascorbate (150 μM) was increased compared to no ascorbate. The cells were incubated with ascorbate in the basal chamber for 24 h. Values are means of 10 samples ±SD. The difference between treatments was significant (p = 0.04). (b) Basolateral transport of iron (as 55Fe) in response to intracellular/basal ascorbate (150 μM) was increased compared to no ascorbate. The cells were incubated with ascorbate in the basal chamber for 24 h. Values are means of 10 samples ±SD. The difference between treatments was significant (p = 0.03). (c) Western Blot of cells treated with ascorbate (150 μM). Lane 1: Control cells (no treatment). Lane 2: Basal ascorbate at 150 μM; these were the ferroportin levels before iron addition in (a). Lane 3: Ferroportin levels 22 h after the iron addition (20 μM for 2 h) in (a). Image collected & cropped by CiteAb from the following publication (http://www.mdpi.com/2072-6643/6/1/249), licensed under a CC-BY license. Not internally tested by Novus Biologicals.
Western Blot: Ferroportin/SLC40A1 Antibody - BSA Free [NBP1-21502] -
Western Blot: Ferroportin/SLC40A1 Antibody - BSA Free [NBP1-21502] - Metformin rescues BMP6-mediated alteration of iron metabolism in mice.(a–e) C57/BL6 mice (n = 4 per group) were treated with BMP6 (500 μg/kg, i.p.) & metformin (200 mg/kg, p.o.). (a) Serum iron level. (b) Q-PCR analysis showing hepcidin & SHP mRNA levels in liver. (c) Serum hepcidin levels. (d) Western blot analysis showing SMAD1/5/8 phosphorylation & FPN in liver. (e) Western blot analysis (top) & graphical representation (bottom) showing FPN expression in spleen. (f) Schematic diagram of SHP-mediated inhibition of BMP6-SMADs pathway. Data are presented as means ± SD. Arrows show locations of molecular weight markers. The western blot images were cropped with a grey cropping line. All gels for western blot analysis were run under the same experimental conditions. *P < 0.05, **P < 0.01, ***P < 0.001 by two-tailed Student t-test. Image collected & cropped by CiteAb from the following publication (https://www.nature.com/articles/srep34630), licensed under a CC-BY license. Not internally tested by Novus Biologicals.
Western Blot: Ferroportin/SLC40A1 Antibody - BSA Free [NBP1-21502] -
Western Blot: Ferroportin/SLC40A1 Antibody - BSA Free [NBP1-21502] - Comparison of Cu, Fe, & metal-binding protein expression levels in wild-type & PrPC-null mouse spleen at different ages. (A) The graph shows the ratio of Cu & Fe levels in Prnp0/0 & Prnp+/+ spleen samples (P15 N = 3; P30 N = 4; P90, P180 N = 6; P365 N = 5). (B) The graph shows the weight of spleen extracted from Prnp0/0 & Prnp+/+ mice; N = 4. (C) Representative Western blot images showing metal-binding protein levels in Prnp0/0 & Prnp+/+ spleen samples. The constant level of the housekeeping protein ( beta-Actin) are also reported. (D) The graph shows the up- or down-regulation of protein expression in Prnp0/0 samples compared to Prnp+/+, i.e., (Prnp0/0 protein OD/housekeeping OD)/ (Prnp+/+ protein OD/housekeeping OD); N = 4. All error bars indicate SD; *p < 0.05; **p < 0.01; ***p < 0.001. Image collected & cropped by CiteAb from the following publication (https://pubmed.ncbi.nlm.nih.gov/27729845), licensed under a CC-BY license. Not internally tested by Novus Biologicals.
Western Blot: Ferroportin/SLC40A1 Antibody - BSA Free [NBP1-21502] -
Western Blot: Ferroportin/SLC40A1 Antibody - BSA Free [NBP1-21502] - Htt elimination disrupts brain iron homeostasis.(A) Representative photographs of immunohistochemical staining for ferritin light chain (Ft). Left panels: cerebella of 21mo CTL noTM & 18mo cKO TM@3mo; middle panels: thalami of 12mo CTL TM@9mo & 12mo cKO TM@9mo; right panels: striata of 21mo CTL noTM & 18mo cKO TM@3mo. Note that Ft levels are already extremely reduced in the thalamus 3 months after Htt elimination (middle panels), & that Ft expression is practically abolished in the cerebellum in the absence of Htt (left panels). (B) Representative western blots of Tfr & Fpn protein expression in 10 month-old brains from CTL & cKO mice TM-treated at 6 months of age. Antibody against actin was used as internal control for loading. Note that Tfr & Fpn levels are increased in TM-treated cKO compared to controls. (C) Quantification of Tfr & Fpn expression levels. Western blots of total protein extracts from 10 month-old brains CTL (n = 5) & cKO (n = 5) TM-treated at 6 months of age were probed with anti-Tfr or anti-Fpn, stripped & re-probed with anti-actin antibody. Bands intensities were quantitated using Image J. Tfr & Fpn levels were normalized over actin levels. Values represent mean relative to controls ± SD (***P<0.001, Student’s t-test). Image collected & cropped by CiteAb from the following publication (https://dx.plos.org/10.1371/journal.pgen.1006846), licensed under a CC-BY license. Not internally tested by Novus Biologicals.
Western Blot: Ferroportin/SLC40A1 Antibody - BSA Free [NBP1-21502] -
Western Blot: Ferroportin/SLC40A1 Antibody - BSA Free [NBP1-21502] - GW501516 activation of PPAR delta regulates 6-OHDA-triggered expression of level of DMT1 & FPN1 protein, & DMT1 mRNA, but not FPN1 mRNA. (A) Cells were treated with 6-OHDA for the indicated durations. (B,C) Cells pretreated with DMSO or GW501516 for 8 h were incubated with or without 6-ODHA for 16 h. (D) Cells were treated with GW501516 for the indicated durations. (E,F) Cells pretreated with DMSO or GW501516 for 8 h were incubated with or without 6-ODHA for 16 h. Total RNA & protein were extracted, & mRNA & protein levels were analyzed by real-time PCR (A,B,D,E) & Western blot (C,F), respectively. RPS18 & alpha-tubulin were used as internal controls for real-time PCR & Western blot, respectively. Results are expressed as means ± SE (n = 3). An image analyzer was used to quantify band intensity of Western blot, & the ratio of protein to alpha-tubulin is indicated above each lane. * p < 0.05, ** p < 0.01 relative to the untreated group; #p < 0.05, ##p < 0.01 relative to the 6-OHDA-treated group. Image collected & cropped by CiteAb from the following publication (https://pubmed.ncbi.nlm.nih.gov/35624674), licensed under a CC-BY license. Not internally tested by Novus Biologicals.
Western Blot: Ferroportin/SLC40A1 Antibody - BSA Free [NBP1-21502] -
Western Blot: Ferroportin/SLC40A1 Antibody - BSA Free [NBP1-21502] - Fisetin protects against DOX-induced ferroptosis via regulating Nrf2 in rats. (A). Western blot results of Nrf2 & Keap1, HO-1, FTH1, FTL, FPN, & TfR1 protein in control & different drug-treated rat heart tissues. (B). Quantification of (A). (C). Expression of Nrf2 was detected by immunohistochemistry (IHC) (Representative images, 200X & 400X, Scale bar = 100 & 50 μm, n = 6 rats per groups) in cardiac tissue of each group. The values are presented as mean ± SD. *p < 0.05; **p < 0.01; ***p < 0.001; NS, no significance; DOX, doxorubicin. Nrf2, nuclear factor erythroid 2-related factor 2; Keap1, Kelch-like ECH-associated protein 1; HO-1, heme oxygenase-1; FTH1, ferritin heavy chain 1; FTL, ferritin light chain; FPN, ferroportin; TfR1, transferrin receptor 1. Image collected & cropped by CiteAb from the following publication (https://pubmed.ncbi.nlm.nih.gov/35273493), licensed under a CC-BY license. Not internally tested by Novus Biologicals.
Immunocytochemistry/ Immunofluorescence: Ferroportin/SLC40A1 Antibody - BSA Free [NBP1-21502] -
Immunocytochemistry/ Immunofluorescence: Ferroportin/SLC40A1 Antibody - BSA Free [NBP1-21502] - Distribution of TfR & Fpn in the anterior segment of bovine eye:(A) The reaction for TfR is evident on the ciliary epithelium facing the AH (panel 1). TfR is localized on the apical membrane & intracellular vesicles of NPE cells as in the human sample (panel 2). The corneal epithelium does not react for TfR (panel 3), while the corneal endothelium shows a distinct reaction on the plasma membrane (panel 4). H&E staining shows multiple layers of corneal epithelium, the stroma, & a single layer of corneal endothelium (panel 5). Scale bar: 25 μm. (B) Fpn is expressed on the ciliary epithelium & the iris (panel 1). The expression of Fpn is limited to NPE cells as in the human sample (panel 2). H&E staining shows the orientation of ciliary epithelium with respect to the iris & AH (panel 3). Unlike human samples, the bovine corneal epithelium did not react for Fpn (panel 4). However, corneal endothelium showed strong reactivity for Fpn (panel 5). Scale bar: 25 μm. Image collected & cropped by CiteAb from the following publication (https://pubmed.ncbi.nlm.nih.gov/29859760), licensed under a CC-BY license. Not internally tested by Novus Biologicals.
Western Blot: Ferroportin/SLC40A1 Antibody - BSA Free [NBP1-21502] -
Western Blot: Ferroportin/SLC40A1 Antibody - BSA Free [NBP1-21502] - GW501516 PPAR delta activation suppresses 6-OHDA-induced expression of IRP1 in SH-SY5Y cells. (A,B) Cells were treated with 6-OHDA (A) or GW501516 (B) for the indicated durations. (C) Cells stably expressing shRNA targeting scrambled sequences or PPAR delta were pretreated with DMSO or GW501516 for 8 h & subsequently incubated in the presence or absence of 6-ODHA for 16 h. (D,E) Cells pretreated with DMSO or GW501516 for 8 h were incubated with or without 6-ODHA for 16 h. Total RNA & protein were extracted, & levels of mRNA & protein were analyzed by real-time PCR (A–D) & Western blot (E). The immunoblots are separate from those shown in Figure 4C,F. RPS18 & alpha-tubulin were used as internal controls for real-time PCR & Western blot, respectively. Results are expressed as means of triplicate ± SE (A–D). * p < 0.05, ** p < 0.01 relative to untreated group; #p < 0.05 relative to 6-OHDA-treated group. Image collected & cropped by CiteAb from the following publication (https://pubmed.ncbi.nlm.nih.gov/35624674), licensed under a CC-BY license. Not internally tested by Novus Biologicals.
Immunocytochemistry/ Immunofluorescence: Ferroportin/SLC40A1 Antibody - BSA Free [NBP1-21502] -
Immunocytochemistry/ Immunofluorescence: Ferroportin/SLC40A1 Antibody - BSA Free [NBP1-21502] - Expression of iron modulating proteins in the cornea & ciliary body.(A) Probing of lysates from bovine cornea (Cor) & CB for Cp, TfR, Tf, & ferritin shows the expression of all of these proteins in both samples (lanes 1–4). Deglycosylation results in faster migration of Cp, TfR, & Tf on SDS-PAGE, indicating the presence of glycans (lanes 2 & 4). AH & the vitreous show abundant presence of Cp & Tf, both of which migrate faster upon deglycosylation (lanes 7 & 9). No reactivity for TfR or ferritin is detected in these samples (lanes 6–9). Human brain lysate was processed in parallel as a positive control (lane 5). Gapdh served as a loading control. (Cor: cornea; Ft: ferritin). (B) Relative distribution of iron modulating proteins within each tissue shows higher expression of TfR relative to Cp & ferritin in the cornea, & higher levels of Cp relative to the TfR & ferritin in the CB. (C) Quantitative comparison of protein expression by densitometry shows significantly higher levels of ferritin & Cp, & lower levels of TfR in the CB relative to the cornea. All values were normalized to Gapdh that provided the loading control. Values represent fold change ± SEM of the indicated n. (D) Probing of Western blots of bovine cornea & CB for Fpn revealed increased expression of Fpn (3.2 fold) in CB relative to the cornea (lanes 1–4). Lysates from human brain & bovine retina were analyzed in parallel as controls (lanes 5 & 6). Gapdh served as a loading control. (E) Quantification by densitometry shows 3.2 fold higher levels of Fpn in the CB relative to the cornea. Values are mean + SEM of the indicated n. **p < 0.01. The full images of the cropped blots have been provided in the Supplementary Data. Image collected & cropped by CiteAb from the following publication (https://pubmed.ncbi.nlm.nih.gov/29859760), licensed under a CC-BY license. Not internally tested by Novus Biologicals.

![Western Blot: Ferroportin/SLC40A1 Antibody - BSA Free [NBP1-21502] - Ferroportin/SLC40A1 Antibody - BSA Free](https://resources.bio-techne.com/images/products/nbp1-21502_rabbit-polyclonal-ferroportin-slc40a1-antibody-271220231285619.jpg)
![Immunohistochemistry-Paraffin: Rabbit Polyclonal Ferroportin/SLC40A1 Antibody [NBP1-21502] - Ferroportin/SLC40A1 Antibody - BSA Free](https://resources.bio-techne.com/images/products/antibody/nbp1-21502_rabbit-polyclonal-ferroportin-slc40a1-antibody-immunohistochemistry-paraffin-165202493537..jpg)
![Western Blot: Ferroportin/SLC40A1 Antibody - BSA Free [NBP1-21502] - Ferroportin/SLC40A1 Antibody - BSA Free](https://resources.bio-techne.com/images/products/nbp1-21502_rabbit-polyclonal-ferroportin-slc40a1-antibody-310202415394535.jpg)
![Western Blot: Ferroportin/SLC40A1 Antibody - BSA Free [NBP1-21502] - Ferroportin/SLC40A1 Antibody - BSA Free](https://resources.bio-techne.com/images/products/nbp1-21502_rabbit-polyclonal-ferroportin-slc40a1-antibody-310202415382437.jpg)
![Western Blot: Ferroportin/SLC40A1 Antibody - BSA Free [NBP1-21502] - Ferroportin/SLC40A1 Antibody - BSA Free](https://resources.bio-techne.com/images/products/nbp1-21502_rabbit-polyclonal-ferroportin-slc40a1-antibody-310202415363729.jpg)
![Western Blot: Ferroportin/SLC40A1 Antibody - BSA Free [NBP1-21502] - Ferroportin/SLC40A1 Antibody - BSA Free](https://resources.bio-techne.com/images/products/nbp1-21502_rabbit-polyclonal-ferroportin-slc40a1-antibody-310202415371986.jpg)
![Western Blot: Ferroportin/SLC40A1 Antibody - BSA Free [NBP1-21502] - Ferroportin/SLC40A1 Antibody - BSA Free](https://resources.bio-techne.com/images/products/nbp1-21502_rabbit-polyclonal-ferroportin-slc40a1-antibody-31020241534539.jpg)
![Immunocytochemistry/ Immunofluorescence: Ferroportin/SLC40A1 Antibody - BSA Free [NBP1-21502] - Ferroportin/SLC40A1 Antibody - BSA Free](https://resources.bio-techne.com/images/products/nbp1-21502_rabbit-polyclonal-ferroportin-slc40a1-antibody-310202415392561.jpg)
![Western Blot: Ferroportin/SLC40A1 Antibody - BSA Free [NBP1-21502] - Ferroportin/SLC40A1 Antibody - BSA Free](https://resources.bio-techne.com/images/products/nbp1-21502_rabbit-polyclonal-ferroportin-slc40a1-antibody-31020241535654.jpg)
![Immunocytochemistry/ Immunofluorescence: Ferroportin/SLC40A1 Antibody - BSA Free [NBP1-21502] - Ferroportin/SLC40A1 Antibody - BSA Free](https://resources.bio-techne.com/images/products/nbp1-21502_rabbit-polyclonal-ferroportin-slc40a1-antibody-310202415371999.jpg)
![Western Blot: Ferroportin/SLC40A1 Antibody - BSA Free [NBP1-21502] - Ferroportin/SLC40A1 Antibody - BSA Free](https://resources.bio-techne.com/images/products/nbp1-21502_rabbit-polyclonal-ferroportin-slc40a1-antibody-310202415382421.jpg)
![Western Blot: Ferroportin/SLC40A1 Antibody - BSA Free [NBP1-21502] - Ferroportin/SLC40A1 Antibody - BSA Free](https://resources.bio-techne.com/images/products/nbp1-21502_rabbit-polyclonal-ferroportin-slc40a1-antibody-310202416165613.jpg)
![Western Blot: Ferroportin/SLC40A1 Antibody - BSA Free [NBP1-21502] - Ferroportin/SLC40A1 Antibody - BSA Free](https://resources.bio-techne.com/images/products/nbp1-21502_rabbit-polyclonal-ferroportin-slc40a1-antibody-31020241616071.jpg)
![Western Blot: Ferroportin/SLC40A1 Antibody - BSA Free [NBP1-21502] - Ferroportin/SLC40A1 Antibody - BSA Free](https://resources.bio-techne.com/images/products/nbp1-21502_rabbit-polyclonal-ferroportin-slc40a1-antibody-31020241616370.jpg)
![Western Blot: Ferroportin/SLC40A1 Antibody - BSA Free [NBP1-21502] - Ferroportin/SLC40A1 Antibody - BSA Free](https://resources.bio-techne.com/images/products/nbp1-21502_rabbit-polyclonal-ferroportin-slc40a1-antibody-310202416173542.jpg)
![Western Blot: Ferroportin/SLC40A1 Antibody - BSA Free [NBP1-21502] - Ferroportin/SLC40A1 Antibody - BSA Free](https://resources.bio-techne.com/images/products/nbp1-21502_rabbit-polyclonal-ferroportin-slc40a1-antibody-31020241616561.jpg)
![Western Blot: Ferroportin/SLC40A1 Antibody - BSA Free [NBP1-21502] - Ferroportin/SLC40A1 Antibody - BSA Free](https://resources.bio-techne.com/images/products/nbp1-21502_rabbit-polyclonal-ferroportin-slc40a1-antibody-310202416171416.jpg)
![Western Blot: Ferroportin/SLC40A1 Antibody - BSA Free [NBP1-21502] - Ferroportin/SLC40A1 Antibody - BSA Free](https://resources.bio-techne.com/images/products/nbp1-21502_rabbit-polyclonal-ferroportin-slc40a1-antibody-31020241616098.jpg)
![Western Blot: Ferroportin/SLC40A1 Antibody - BSA Free [NBP1-21502] - Ferroportin/SLC40A1 Antibody - BSA Free](https://resources.bio-techne.com/images/products/nbp1-21502_rabbit-polyclonal-ferroportin-slc40a1-antibody-310202416173510.jpg)
![Western Blot: Ferroportin/SLC40A1 Antibody - BSA Free [NBP1-21502] - Ferroportin/SLC40A1 Antibody - BSA Free](https://resources.bio-techne.com/images/products/nbp1-21502_rabbit-polyclonal-ferroportin-slc40a1-antibody-310202416171422.jpg)
![Western Blot: Ferroportin/SLC40A1 Antibody - BSA Free [NBP1-21502] - Ferroportin/SLC40A1 Antibody - BSA Free](https://resources.bio-techne.com/images/products/nbp1-21502_rabbit-polyclonal-ferroportin-slc40a1-antibody-310202416171453.jpg)
![Western Blot: Ferroportin/SLC40A1 Antibody - BSA Free [NBP1-21502] - Ferroportin/SLC40A1 Antibody - BSA Free](https://resources.bio-techne.com/images/products/nbp1-21502_rabbit-polyclonal-ferroportin-slc40a1-antibody-31020241616065.jpg)
![Immunocytochemistry/ Immunofluorescence: Ferroportin/SLC40A1 Antibody - BSA Free [NBP1-21502] - Ferroportin/SLC40A1 Antibody - BSA Free](https://resources.bio-techne.com/images/products/nbp1-21502_rabbit-polyclonal-ferroportin-slc40a1-antibody-31020241618269.jpg)
![Western Blot: Ferroportin/SLC40A1 Antibody - BSA Free [NBP1-21502] - Ferroportin/SLC40A1 Antibody - BSA Free](https://resources.bio-techne.com/images/products/nbp1-21502_rabbit-polyclonal-ferroportin-slc40a1-antibody-3102024161602.jpg)
![Immunocytochemistry/ Immunofluorescence: Ferroportin/SLC40A1 Antibody - BSA Free [NBP1-21502] - Ferroportin/SLC40A1 Antibody - BSA Free](https://resources.bio-techne.com/images/products/nbp1-21502_rabbit-polyclonal-ferroportin-slc40a1-antibody-310202416171438.jpg)