Detection of Human Hemoglobin by Immunohistochemistry
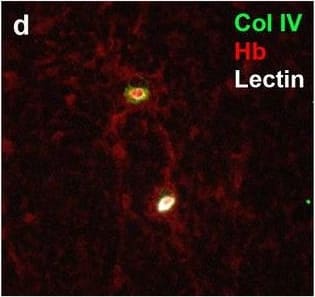
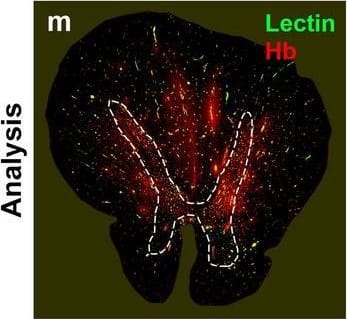
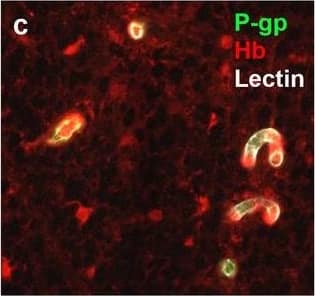
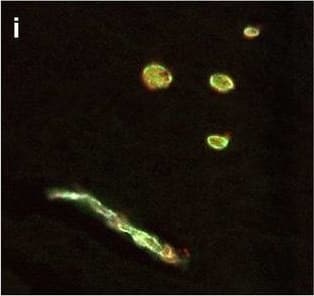
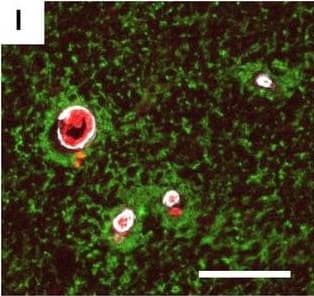
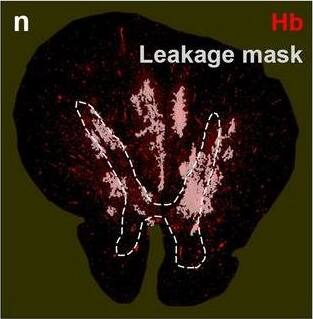
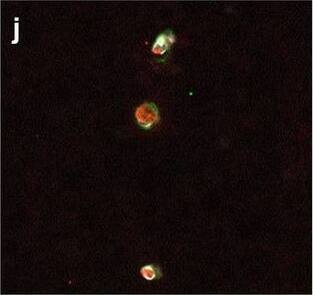
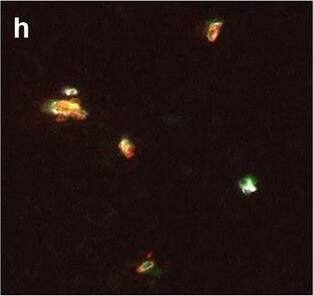
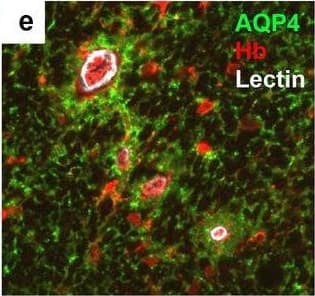
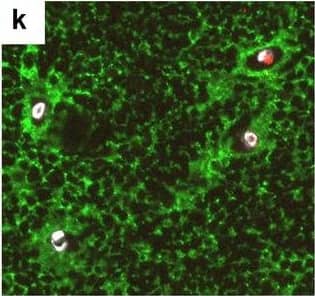
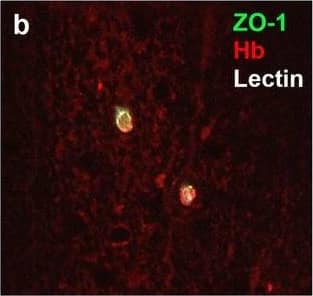
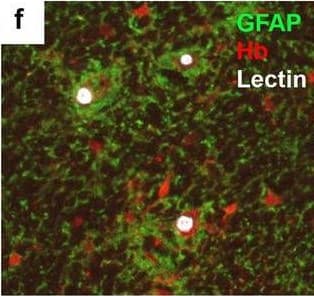
Neurovascular unit component expression in leaked versus non-leaked vessels along the spinal cord axis. Immunohistochemical labelling of neurovascular unit markers in ALS spinal cord (a–l); tight junctions claudin-5 (a, g) and ZO-1 (b, h), efflux pump P-glycoprotein (c, i), basement membrane marker collagen IV (d, j), and astrocyte markers aquaporin 4 (e, k) and GFAP (f, l), in spinal cord vessels with or without hemoglobin leakage. Scale bar = 50 µm. Automated quantification of average intensity staining of neurovascular unit markers was carried out in all ALS cases (n = 13) or in a subset of ALS cases with high hemoglobin leakage (n = 5) in leaked and non-leaked areas of the white and gray matter of the spinal cord (m–r). Composite of original images showing anti-hemoglobin immunoreactivity (red) and lectin-positive vessels (green) (m) and overlays of hemoglobin leakage analysis output (white, partly transparent) over anti-hemoglobin (red) (n). Segmentation of vessels inside (magenta) or outside (white) areas of hemoglobin leakage in the white matter (o) or gray matter (p). Dashed lines show boundaries. Scale bar = 1 mm. Perivascular astrocyte endfeet staining (green) around lectin-positive vessels (white) in (q) was isolated using an automated mask of the glia limitans (r). Scale bar = 50 µm. The average intensities of marker staining were measured in leaked and non-leaked vessels of the gray and white matter (s–x). Data shown as mean ± SD (n = 5 or 13) with statistical significance determined with a two-way repeated-measures ANOVA with Sidak’s post-test. ns = not significant Image collected and cropped by CiteAb from the following open publication (https://pubmed.ncbi.nlm.nih.gov/34446086), licensed under a CC-BY license. Not internally tested by R&D Systems.
Detection of Human Hemoglobin by Immunohistochemistry
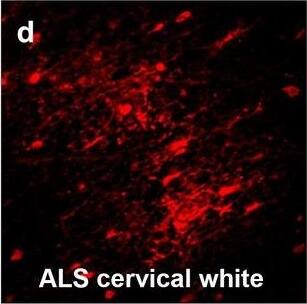
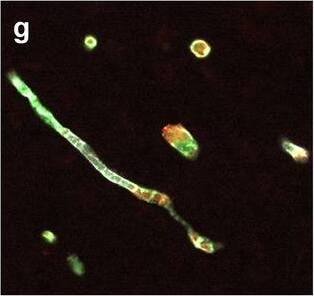
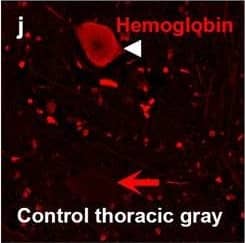
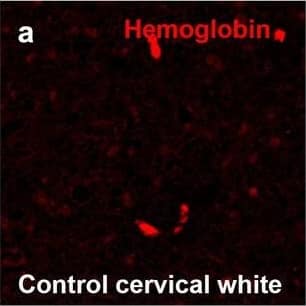
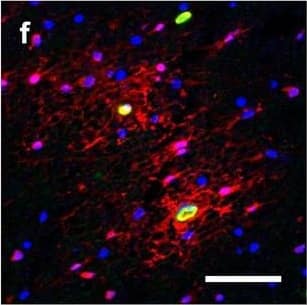
Hemoglobin localization in control and ALS spinal cord. Immunohistochemical staining of hemoglobin extravasation in cervical white matter from control (a–c) or ALS (d–f) spinal cord. Hemoglobin immunoreactivity (red) and lectin-positive vessels (green) are shown with a Hoechst nuclear counterstain (blue). Scale bars = 50 µm. Representative images of full spinal cord sections from the cervical level of a control case with no hemoglobin leakage (g), the thoracic level of an ALS case with white matter hemoglobin leakage (h), and the lumbar level of an ALS case with gray matter hemoglobin leakage (i) are shown. Dashed lines show gray matter boundary; scale bar = 1 mm. Occasional hemoglobin staining of SMI-32-positive anterior horn motor neurons was also observed (j–m). White arrowhead indicates a SMI-32-positive hemoglobin-positive motor neuron, where the red arrow indicates an SMI-32-positive hemoglobin-negative motor neuron. Scale bars = 50 µm Image collected and cropped by CiteAb from the following open publication (https://pubmed.ncbi.nlm.nih.gov/34446086), licensed under a CC-BY license. Not internally tested by R&D Systems.
Detection of Human Hemoglobin by Immunohistochemistry
Neurovascular unit component expression in leaked versus non-leaked vessels along the spinal cord axis. Immunohistochemical labelling of neurovascular unit markers in ALS spinal cord (a–l); tight junctions claudin-5 (a, g) and ZO-1 (b, h), efflux pump P-glycoprotein (c, i), basement membrane marker collagen IV (d, j), and astrocyte markers aquaporin 4 (e, k) and GFAP (f, l), in spinal cord vessels with or without hemoglobin leakage. Scale bar = 50 µm. Automated quantification of average intensity staining of neurovascular unit markers was carried out in all ALS cases (n = 13) or in a subset of ALS cases with high hemoglobin leakage (n = 5) in leaked and non-leaked areas of the white and gray matter of the spinal cord (m–r). Composite of original images showing anti-hemoglobin immunoreactivity (red) and lectin-positive vessels (green) (m) and overlays of hemoglobin leakage analysis output (white, partly transparent) over anti-hemoglobin (red) (n). Segmentation of vessels inside (magenta) or outside (white) areas of hemoglobin leakage in the white matter (o) or gray matter (p). Dashed lines show boundaries. Scale bar = 1 mm. Perivascular astrocyte endfeet staining (green) around lectin-positive vessels (white) in (q) was isolated using an automated mask of the glia limitans (r). Scale bar = 50 µm. The average intensities of marker staining were measured in leaked and non-leaked vessels of the gray and white matter (s–x). Data shown as mean ± SD (n = 5 or 13) with statistical significance determined with a two-way repeated-measures ANOVA with Sidak’s post-test. ns = not significant Image collected and cropped by CiteAb from the following open publication (https://pubmed.ncbi.nlm.nih.gov/34446086), licensed under a CC-BY license. Not internally tested by R&D Systems.
Detection of Human Hemoglobin by Immunohistochemistry
Hemoglobin localization in control and ALS spinal cord. Immunohistochemical staining of hemoglobin extravasation in cervical white matter from control (a–c) or ALS (d–f) spinal cord. Hemoglobin immunoreactivity (red) and lectin-positive vessels (green) are shown with a Hoechst nuclear counterstain (blue). Scale bars = 50 µm. Representative images of full spinal cord sections from the cervical level of a control case with no hemoglobin leakage (g), the thoracic level of an ALS case with white matter hemoglobin leakage (h), and the lumbar level of an ALS case with gray matter hemoglobin leakage (i) are shown. Dashed lines show gray matter boundary; scale bar = 1 mm. Occasional hemoglobin staining of SMI-32-positive anterior horn motor neurons was also observed (j–m). White arrowhead indicates a SMI-32-positive hemoglobin-positive motor neuron, where the red arrow indicates an SMI-32-positive hemoglobin-negative motor neuron. Scale bars = 50 µm Image collected and cropped by CiteAb from the following open publication (https://pubmed.ncbi.nlm.nih.gov/34446086), licensed under a CC-BY license. Not internally tested by R&D Systems.
Detection of Human Hemoglobin by Immunohistochemistry
Neurovascular unit component expression in leaked versus non-leaked vessels along the spinal cord axis. Immunohistochemical labelling of neurovascular unit markers in ALS spinal cord (a–l); tight junctions claudin-5 (a, g) and ZO-1 (b, h), efflux pump P-glycoprotein (c, i), basement membrane marker collagen IV (d, j), and astrocyte markers aquaporin 4 (e, k) and GFAP (f, l), in spinal cord vessels with or without hemoglobin leakage. Scale bar = 50 µm. Automated quantification of average intensity staining of neurovascular unit markers was carried out in all ALS cases (n = 13) or in a subset of ALS cases with high hemoglobin leakage (n = 5) in leaked and non-leaked areas of the white and gray matter of the spinal cord (m–r). Composite of original images showing anti-hemoglobin immunoreactivity (red) and lectin-positive vessels (green) (m) and overlays of hemoglobin leakage analysis output (white, partly transparent) over anti-hemoglobin (red) (n). Segmentation of vessels inside (magenta) or outside (white) areas of hemoglobin leakage in the white matter (o) or gray matter (p). Dashed lines show boundaries. Scale bar = 1 mm. Perivascular astrocyte endfeet staining (green) around lectin-positive vessels (white) in (q) was isolated using an automated mask of the glia limitans (r). Scale bar = 50 µm. The average intensities of marker staining were measured in leaked and non-leaked vessels of the gray and white matter (s–x). Data shown as mean ± SD (n = 5 or 13) with statistical significance determined with a two-way repeated-measures ANOVA with Sidak’s post-test. ns = not significant Image collected and cropped by CiteAb from the following open publication (https://pubmed.ncbi.nlm.nih.gov/34446086), licensed under a CC-BY license. Not internally tested by R&D Systems.
Detection of Human Hemoglobin by Immunohistochemistry
Neurovascular unit component expression in leaked versus non-leaked vessels along the spinal cord axis. Immunohistochemical labelling of neurovascular unit markers in ALS spinal cord (a–l); tight junctions claudin-5 (a, g) and ZO-1 (b, h), efflux pump P-glycoprotein (c, i), basement membrane marker collagen IV (d, j), and astrocyte markers aquaporin 4 (e, k) and GFAP (f, l), in spinal cord vessels with or without hemoglobin leakage. Scale bar = 50 µm. Automated quantification of average intensity staining of neurovascular unit markers was carried out in all ALS cases (n = 13) or in a subset of ALS cases with high hemoglobin leakage (n = 5) in leaked and non-leaked areas of the white and gray matter of the spinal cord (m–r). Composite of original images showing anti-hemoglobin immunoreactivity (red) and lectin-positive vessels (green) (m) and overlays of hemoglobin leakage analysis output (white, partly transparent) over anti-hemoglobin (red) (n). Segmentation of vessels inside (magenta) or outside (white) areas of hemoglobin leakage in the white matter (o) or gray matter (p). Dashed lines show boundaries. Scale bar = 1 mm. Perivascular astrocyte endfeet staining (green) around lectin-positive vessels (white) in (q) was isolated using an automated mask of the glia limitans (r). Scale bar = 50 µm. The average intensities of marker staining were measured in leaked and non-leaked vessels of the gray and white matter (s–x). Data shown as mean ± SD (n = 5 or 13) with statistical significance determined with a two-way repeated-measures ANOVA with Sidak’s post-test. ns = not significant Image collected and cropped by CiteAb from the following open publication (https://pubmed.ncbi.nlm.nih.gov/34446086), licensed under a CC-BY license. Not internally tested by R&D Systems.
Detection of Human Hemoglobin by Immunohistochemistry
Neurovascular unit component expression in leaked versus non-leaked vessels along the spinal cord axis. Immunohistochemical labelling of neurovascular unit markers in ALS spinal cord (a–l); tight junctions claudin-5 (a, g) and ZO-1 (b, h), efflux pump P-glycoprotein (c, i), basement membrane marker collagen IV (d, j), and astrocyte markers aquaporin 4 (e, k) and GFAP (f, l), in spinal cord vessels with or without hemoglobin leakage. Scale bar = 50 µm. Automated quantification of average intensity staining of neurovascular unit markers was carried out in all ALS cases (n = 13) or in a subset of ALS cases with high hemoglobin leakage (n = 5) in leaked and non-leaked areas of the white and gray matter of the spinal cord (m–r). Composite of original images showing anti-hemoglobin immunoreactivity (red) and lectin-positive vessels (green) (m) and overlays of hemoglobin leakage analysis output (white, partly transparent) over anti-hemoglobin (red) (n). Segmentation of vessels inside (magenta) or outside (white) areas of hemoglobin leakage in the white matter (o) or gray matter (p). Dashed lines show boundaries. Scale bar = 1 mm. Perivascular astrocyte endfeet staining (green) around lectin-positive vessels (white) in (q) was isolated using an automated mask of the glia limitans (r). Scale bar = 50 µm. The average intensities of marker staining were measured in leaked and non-leaked vessels of the gray and white matter (s–x). Data shown as mean ± SD (n = 5 or 13) with statistical significance determined with a two-way repeated-measures ANOVA with Sidak’s post-test. ns = not significant Image collected and cropped by CiteAb from the following open publication (https://pubmed.ncbi.nlm.nih.gov/34446086), licensed under a CC-BY license. Not internally tested by R&D Systems.
Detection of Human Hemoglobin by Immunohistochemistry
Hemoglobin localization in control and ALS spinal cord. Immunohistochemical staining of hemoglobin extravasation in cervical white matter from control (a–c) or ALS (d–f) spinal cord. Hemoglobin immunoreactivity (red) and lectin-positive vessels (green) are shown with a Hoechst nuclear counterstain (blue). Scale bars = 50 µm. Representative images of full spinal cord sections from the cervical level of a control case with no hemoglobin leakage (g), the thoracic level of an ALS case with white matter hemoglobin leakage (h), and the lumbar level of an ALS case with gray matter hemoglobin leakage (i) are shown. Dashed lines show gray matter boundary; scale bar = 1 mm. Occasional hemoglobin staining of SMI-32-positive anterior horn motor neurons was also observed (j–m). White arrowhead indicates a SMI-32-positive hemoglobin-positive motor neuron, where the red arrow indicates an SMI-32-positive hemoglobin-negative motor neuron. Scale bars = 50 µm Image collected and cropped by CiteAb from the following open publication (https://pubmed.ncbi.nlm.nih.gov/34446086), licensed under a CC-BY license. Not internally tested by R&D Systems.

