Detection of Human CFTR by Immunocytochemistry/Immunofluorescence
Effect of S. aureus supernatant on CFTR localisation and expression. (A, B) Immunolocalisation of CFTR (green staining) and Dapi nuclei staining (blue) in lateral view of successive z level images. In control cells, we noticed an apical staining of CFTR (arrow heads in A). In 2%S. aureus supernatant-treated cells (B), the CFTR staining was more diffuse in the cytoplasm. (C) Western blotting analysis of airway glandular cell membrane proteins showed the presence of CFTR in control cells and in fewer amount in cells incubated with 2%S. aureus supernatant. (D) Quantitative measurement showed a significant (*, p < 0.05) decrease in CFTR expression in cell membranes when cells were incubated with 2% S. aureus supernatant. Data represent the mean ± SEM of 5 different experiments. Image collected and cropped by CiteAb from the following publication (https://pubmed.ncbi.nlm.nih.gov/20089165), licensed under a CC-BY license. Not internally tested by R&D Systems.
Detection of Human CFTR by Western Blot
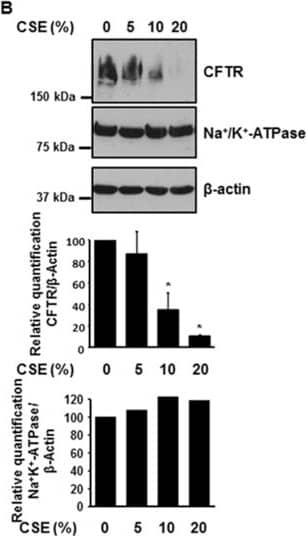
Cigarette smoke extract (CSE) decreases the expression of CFTR but not Na+/K+-ATPase in human bronchial epithelial cells. 16HBE14o- cells were treated with 10% CSE for up to 48 hours (A) or increasing concentrations of CSE prepared from commercial grade cigarettes (Camel) for 48 hours (B). CFTR and Na+/K+-ATPase were detected by immunoblotting. The same amount of protein was loaded in each lane as indicated by detection of beta-actin. The blots are representative of at least three independent experiments. (C) Detection of CFTR mRNA transcript levels using quantitative RT-PCR analysis after treatment of 16HBE14o- cells with 10% CSE for 24 hours. Results are expressed as fold change and are representative of three independent experiments. *p < 0.05. Image collected and cropped by CiteAb from the following publication (https://pubmed.ncbi.nlm.nih.gov/24957904), licensed under a CC-BY license. Not internally tested by R&D Systems.
Detection of Fish CFTR by Immunocytochemistry/Immunofluorescence
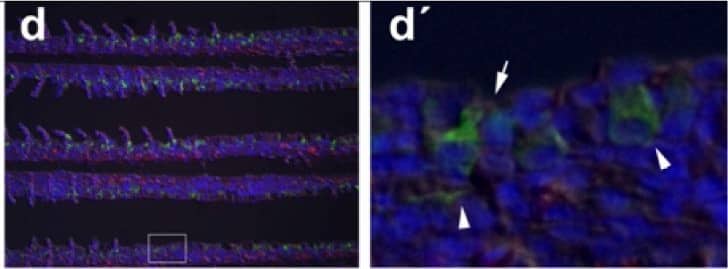
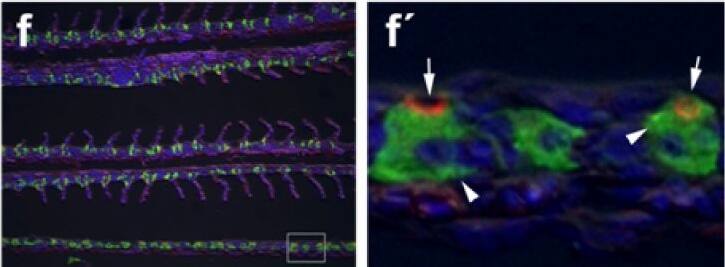
Immunohistochemical localization of transporters in gills of tilapia acclimated to different salinities.Representative micrographs of immunohistolocalization of Nka (green) with either Nkcc/Ncc (a–c; red) or Cftr (d–f; red) in the gills of tilapia acclimated to FW (a,d), SW (b,e) or HSW (c,f). Co-localization of red and green fluorochromes results in yellow-orange staining. Higher magnification (10×) of boxed areas in (a–f) correspond to panels (a′–f′). Sections are counter stained with the nuclear stain DAPI and overlaid with the DIC image for tissue orientation. Arrows indicate apical staining and arrowheads tubular system (basolateral) staining. Scale bar 100 µm (a–f), 10 µm (a′–c′). Image collected and cropped by CiteAb from the following publication (https://dx.plos.org/10.1371/journal.pone.0087591), licensed under a CC-BY license. Not internally tested by R&D Systems.
Detection of Human CFTR by Western Blot
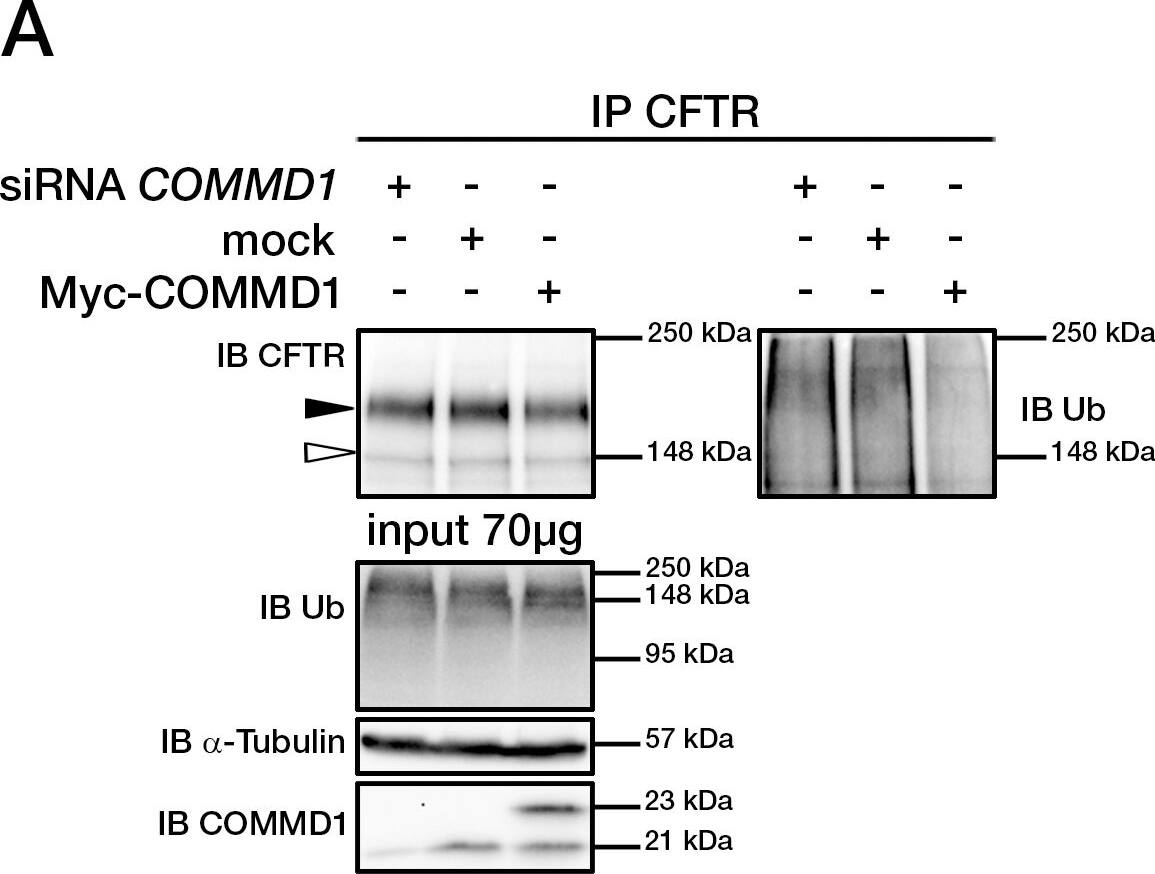
COMMD1 regulates CFTR ubiquitination.(A) Representative gels for the same CFTR IP experiment with MAB25031 from HeLa cells stably expressing wt-CFTR and separated on 8% SDS-PAGE transferred to PVDF membrane. Half of the membrane was probed with anti-CFTR mAb and the other half with anti-ubiquitin mAb. Lysates were loaded onto an 11% SDS-PAGE and sequential probing of the membrane was performed (COMMD1, alpha-tubulin and lastly ubiquitin). Filled and empty arrowheads indicate the fully- (170 kDa) and core-glycosylated (140 kDa) CFTR, respectively. (B) Quantification of ubiquitinated CFTR. Ratio of ubiquitinated CFTR to total CFTR in each condition is shown, endogenous COMMD1 expression is referred as 100%. The means ± S.D. were obtained from five independent experiments.* P<0.05 was determined by t-test. (C) Stability of the mature wt-CFTR was determined upon inhibition of protein biosynthesis with cycloheximide (CHX). Cells were incubated in the presence of cycloheximide for the indicated time intervals. (D) Quantification of mature CFTR was normalized to alpha-tubulin level. Image collected and cropped by CiteAb from the following publication (https://dx.plos.org/10.1371/journal.pone.0018334), licensed under a CC-BY license. Not internally tested by R&D Systems.
Detection of Human CFTR by Immunocytochemistry/Immunofluorescence
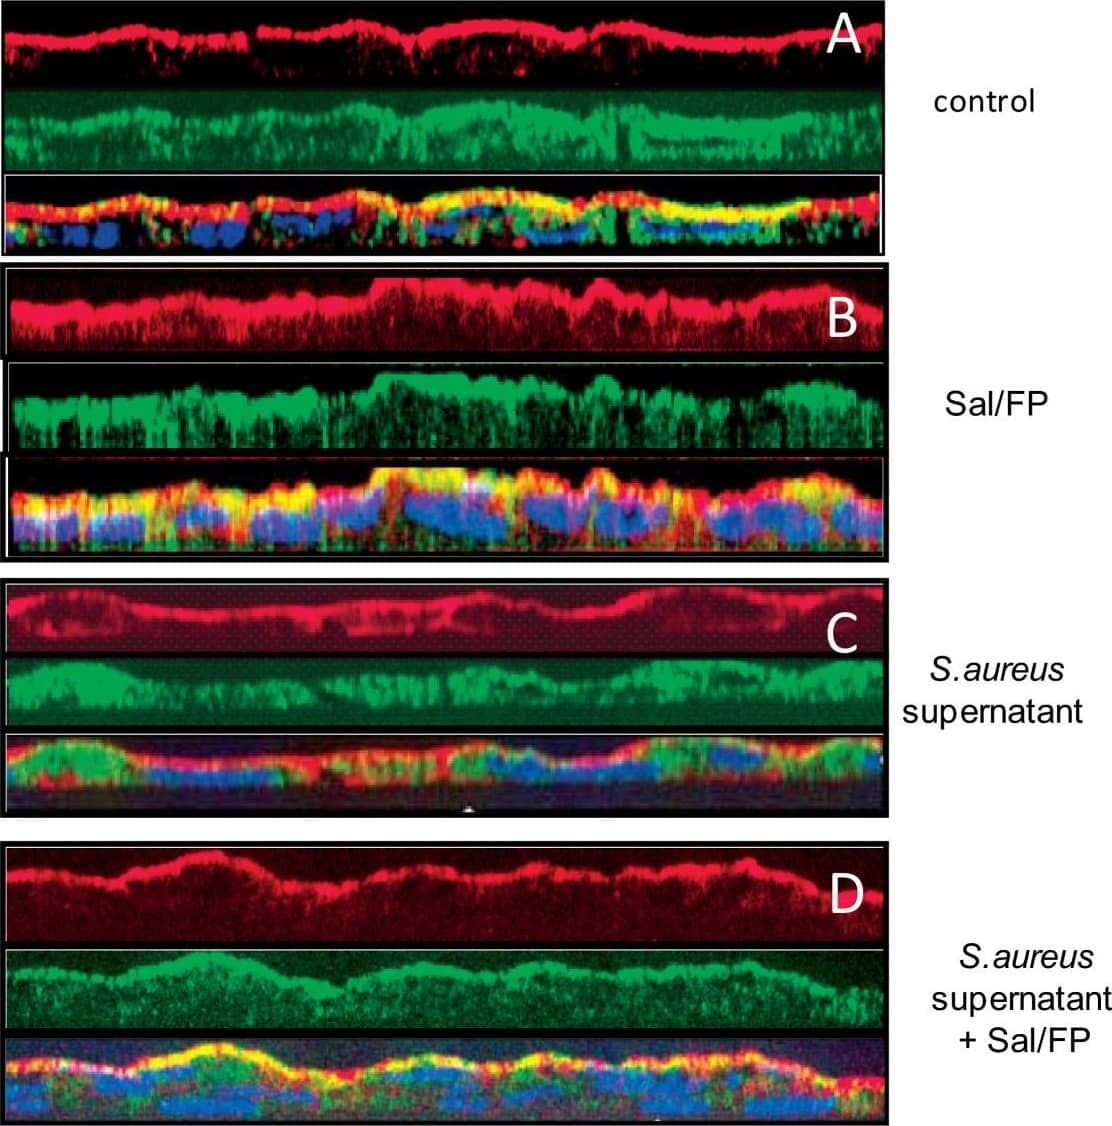
Co-localisation by immunofluorescence of CFTR and actin. (A) The pattern of CFTR (green staining) and actin (red staining) stainings was essentially apical in control cells as well as in cells treated with Sal/FP (B). (C) The incubation of cells with S. aureus supernatant induced alteration of the localisation of CFTR that appeared to be cytoplasmic, in parallel with a disorganization of the actin network. (D) Treatment of S. aureus supernatant pre-incubated cells with Sal/FP restored CFTR and actin apical stainings. (E) Quantification of the co-localisation of CFTR and actin showed that 2% S. aureus supernatant decreased the co-localisation index compared to the index in control cells, but the difference was not significant; the treatment with Sal/FP alone or after S. aureus supernatant incubation significantly enhanced the co-localisation of the 2 proteins compared with control or with S. aureus supernatant-treated cells (*, p < 0.05). Data represent the mean ± SEM of 3 different experiments. Image collected and cropped by CiteAb from the following publication (https://pubmed.ncbi.nlm.nih.gov/20089165), licensed under a CC-BY license. Not internally tested by R&D Systems.
Detection of Human CFTR by Immunoprecipitation
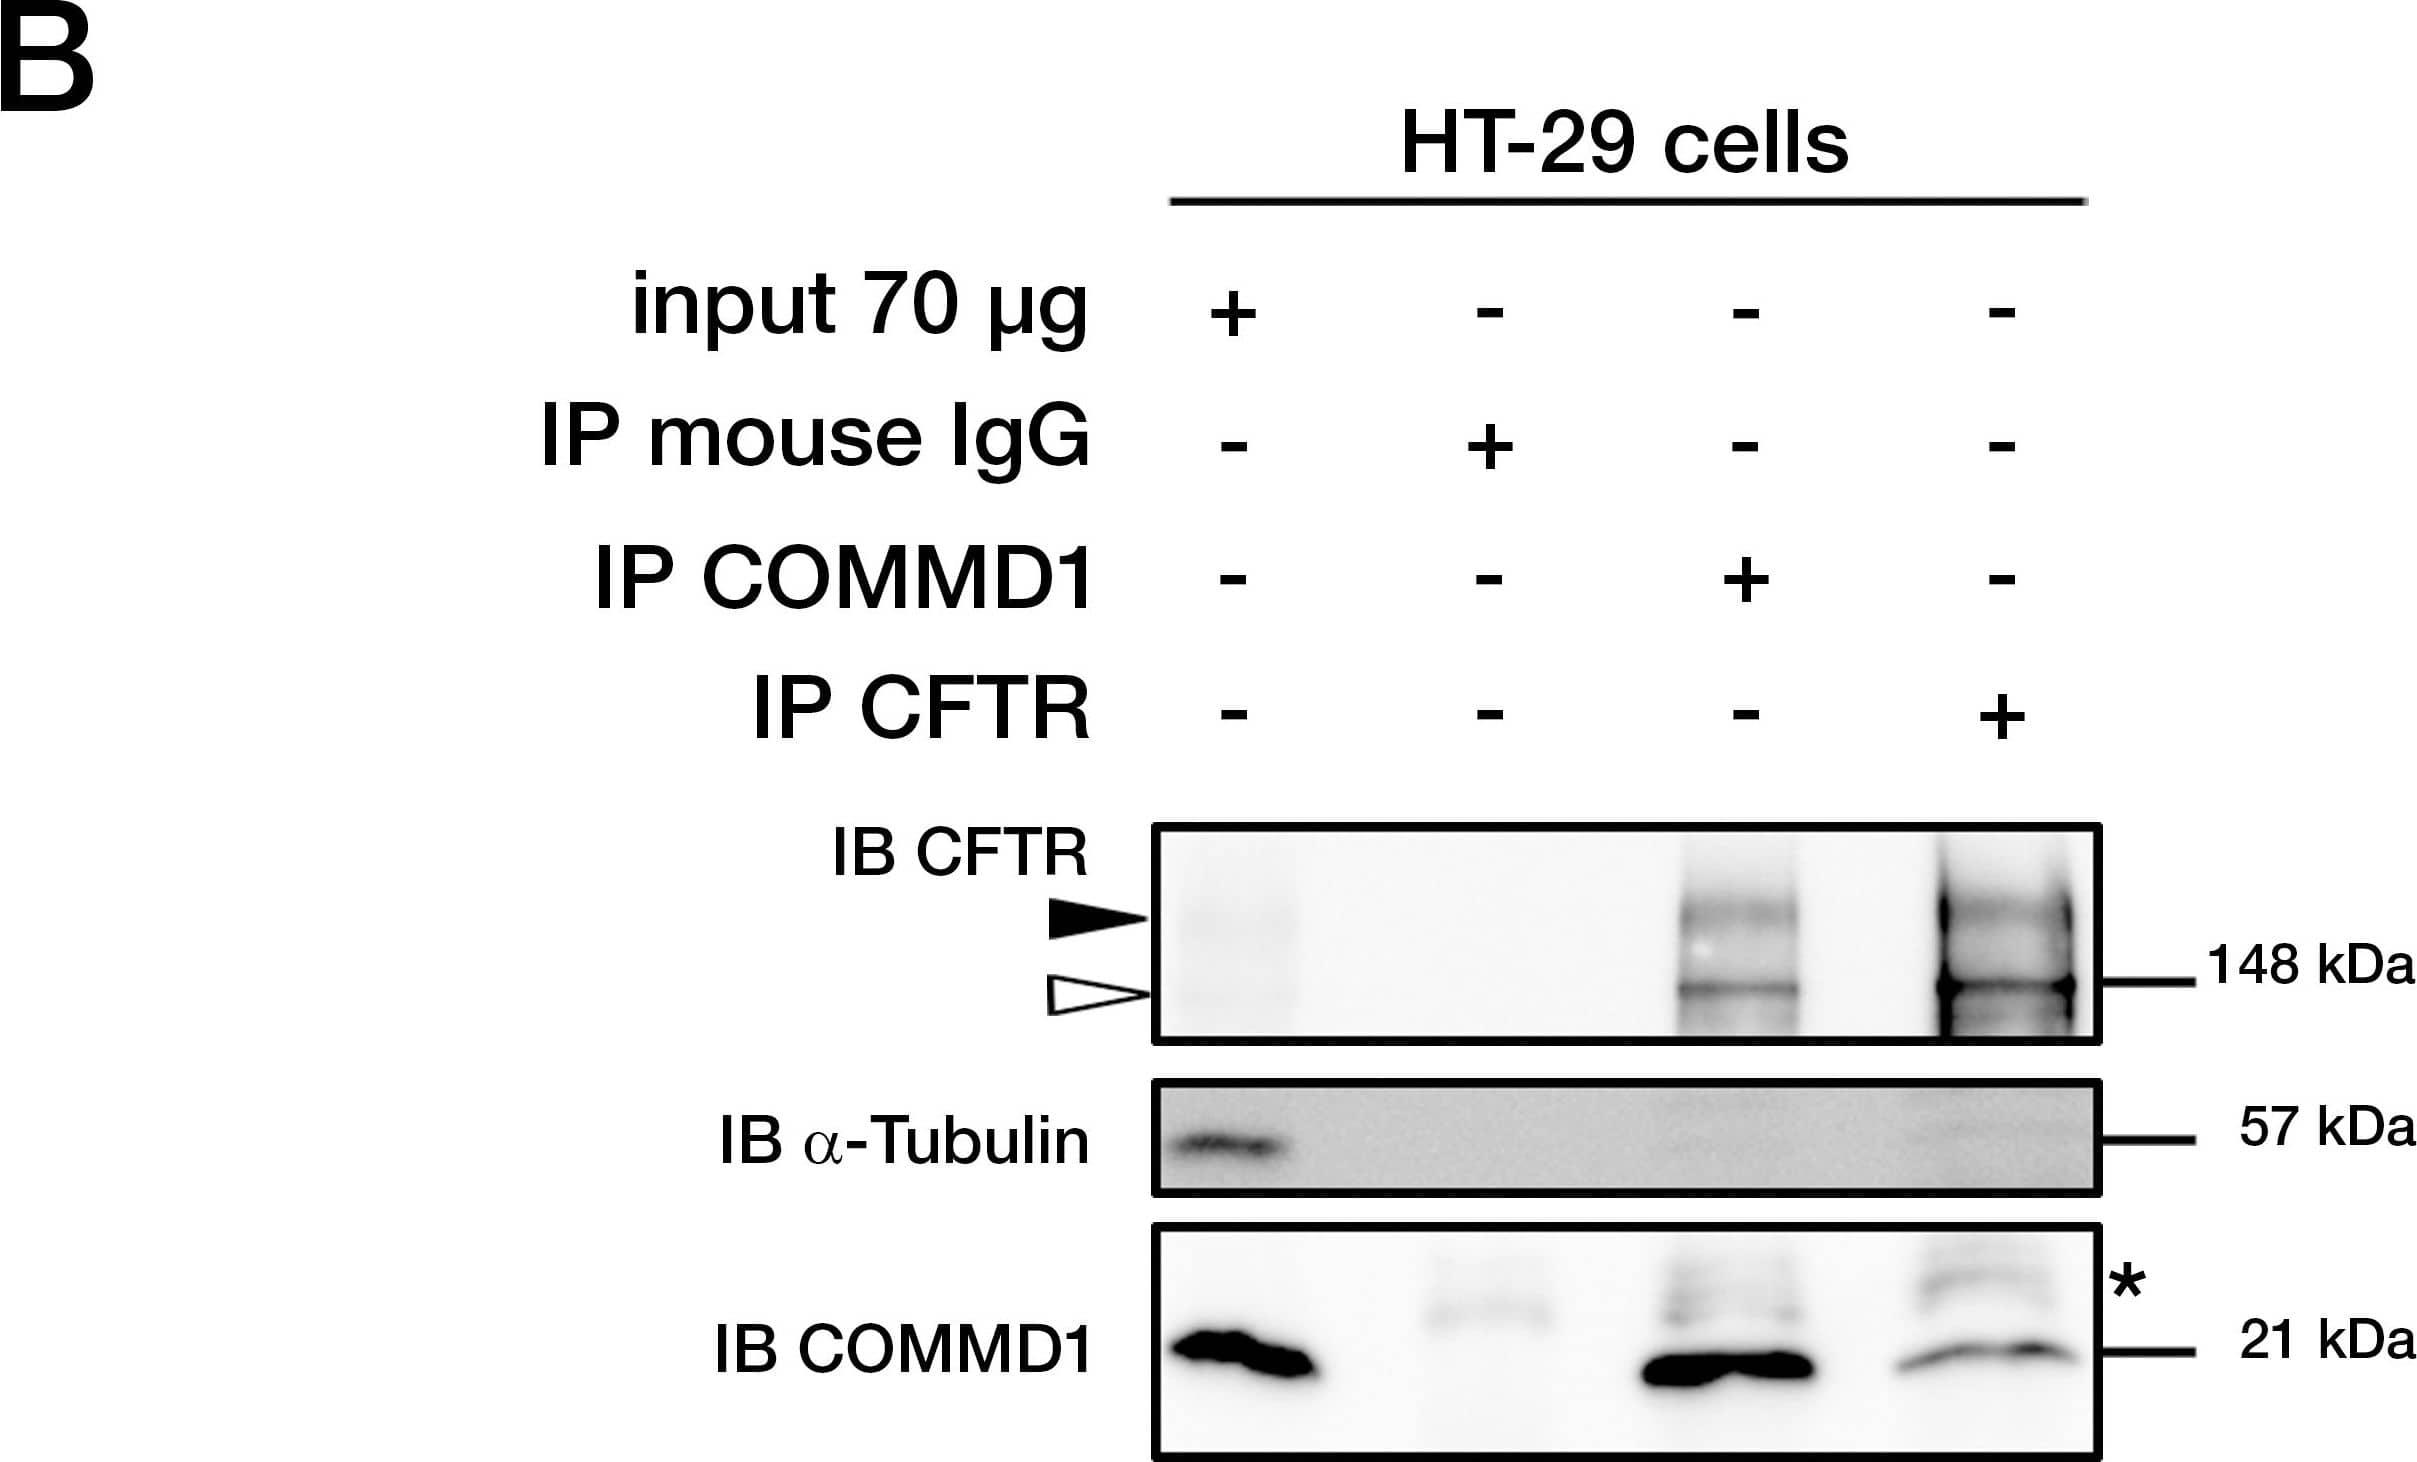
COMMD1 and CFTR interact in mammalian cells.(A) Sequences of ICL3 in other species from fish to primates. Asterisks indicate the position of two class II mutations: S945L and D979A. Identity of amino acids between the different proteins are boxed in black, conserved residues are boxed in dark gray and semi-conserved substitutions in light gray. (B) Representative gels for the same co-immunoprecipitation experiments in HT-29 cells expressing endogenous CFTR and COMMD1. Lysates from HT-29 cells were immunoprecipitated (IP) with either 0.8 µg of anti-COMMD1 mAb (Abnova), 0.8 µg of anti-CFTR mAb (MAB25031, R&D Systems) or with 0.8 µg anti-mouse IgG as a control. Each immunoprecipitation sample was then split in half and loaded onto an 8% SDS-PAGE for CFTR detection and 11% SDS-PAGE for COMMD1 detection. Both gels were transferred to PVDF membrane and subjected to immunoblotting (IB). The 8% SDS-PAGE membrane was probed with anti-CFTR mAb (MM13-4) and the 11% SDS-PAGE membrane with a rabbit anti-COMMD1 pAb (Proteintech Group). Both membranes were probed with anti-alpha -tubulin as control (11% gel is shown). Filled and empty arrowheads indicate the fully- (170 kDa) and core-glycosylated (140 kDa) CFTR, respectively. * indicates mouse IgG light chain from the antibody used for immunoprecipitation. (C) COMMD1 constructions in pcDNA3.1/Topo plasmid. Two COMMD1 constructs were generated by adding a Myc-tag at the N-terminus of COMMD1: Myc-COMMD1 and a construct with a deletion of the COMM domain named Myc-COMMD1 deltaCOMM. (D) Representative gels for the same co-immunoprecipitation experiment between COMMD1 and wt- in heterologous system. HeLa cells stably expressing wt- (spTCF-wt) or empty CFTR vector (spTracer) as control were transfected with Myc-COMMD1. spTCF-wt were transfected with Myc-COMMD1 deltaCOMM. Lysates from all these experiments were subjected to SDS-PAGE, as in (B) after CFTR IP. The 8% SDS-PAGE membrane was probed with anti-CFTR mAb and the 11% SDS-PAGE membrane with anti-c-Myc mAb. Both membranes were probed with anti-alpha -tubulin as control (11% gel is shown). Image collected and cropped by CiteAb from the following publication (https://dx.plos.org/10.1371/journal.pone.0018334), licensed under a CC-BY license. Not internally tested by R&D Systems.
Detection of Human CFTR by Western Blot
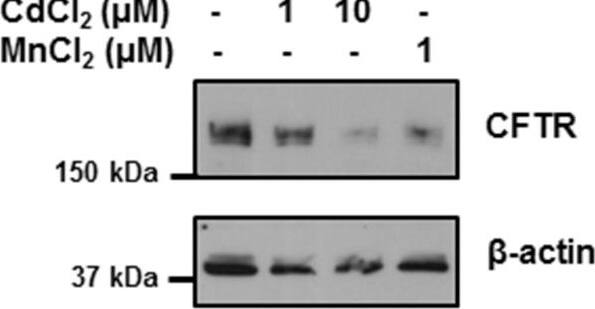
Manganese and cadmium decrease the expression of CFTR in bronchial epithelial cells. 16HBE14o- cells were incubated with cadmium chloride (CdCl2) or manganese chloride (MnCl2) at the doses indicated for 24 hours. CFTR protein was detected by immunobloting using a monoclonal antibody as described in Materials and Methods. Image collected and cropped by CiteAb from the following publication (https://pubmed.ncbi.nlm.nih.gov/24957904), licensed under a CC-BY license. Not internally tested by R&D Systems.
Detection of Human CFTR by Immunocytochemistry/Immunofluorescence
Effect of S. aureus supernatant on CFTR localisation and expression. (A, B) Immunolocalisation of CFTR (green staining) and Dapi nuclei staining (blue) in lateral view of successive z level images. In control cells, we noticed an apical staining of CFTR (arrow heads in A). In 2%S. aureus supernatant-treated cells (B), the CFTR staining was more diffuse in the cytoplasm. (C) Western blotting analysis of airway glandular cell membrane proteins showed the presence of CFTR in control cells and in fewer amount in cells incubated with 2%S. aureus supernatant. (D) Quantitative measurement showed a significant (*, p < 0.05) decrease in CFTR expression in cell membranes when cells were incubated with 2% S. aureus supernatant. Data represent the mean ± SEM of 5 different experiments. Image collected and cropped by CiteAb from the following publication (https://pubmed.ncbi.nlm.nih.gov/20089165), licensed under a CC-BY license. Not internally tested by R&D Systems.
Detection of Human CFTR by Western Blot
Cigarette smoke extract (CSE) decreases the expression of CFTR but not Na+/K+-ATPase in human bronchial epithelial cells. 16HBE14o- cells were treated with 10% CSE for up to 48 hours (A) or increasing concentrations of CSE prepared from commercial grade cigarettes (Camel) for 48 hours (B). CFTR and Na+/K+-ATPase were detected by immunoblotting. The same amount of protein was loaded in each lane as indicated by detection of beta-actin. The blots are representative of at least three independent experiments. (C) Detection of CFTR mRNA transcript levels using quantitative RT-PCR analysis after treatment of 16HBE14o- cells with 10% CSE for 24 hours. Results are expressed as fold change and are representative of three independent experiments. *p < 0.05. Image collected and cropped by CiteAb from the following publication (https://pubmed.ncbi.nlm.nih.gov/24957904), licensed under a CC-BY license. Not internally tested by R&D Systems.
Detection of Fish CFTR by Immunocytochemistry/Immunofluorescence
Immunohistochemical localization of transporters in gills of tilapia acclimated to different salinities.Representative micrographs of immunohistolocalization of Nka (green) with either Nkcc/Ncc (a–c; red) or Cftr (d–f; red) in the gills of tilapia acclimated to FW (a,d), SW (b,e) or HSW (c,f). Co-localization of red and green fluorochromes results in yellow-orange staining. Higher magnification (10×) of boxed areas in (a–f) correspond to panels (a′–f′). Sections are counter stained with the nuclear stain DAPI and overlaid with the DIC image for tissue orientation. Arrows indicate apical staining and arrowheads tubular system (basolateral) staining. Scale bar 100 µm (a–f), 10 µm (a′–c′). Image collected and cropped by CiteAb from the following publication (https://dx.plos.org/10.1371/journal.pone.0087591), licensed under a CC-BY license. Not internally tested by R&D Systems.
Detection of Human CFTR by Western Blot
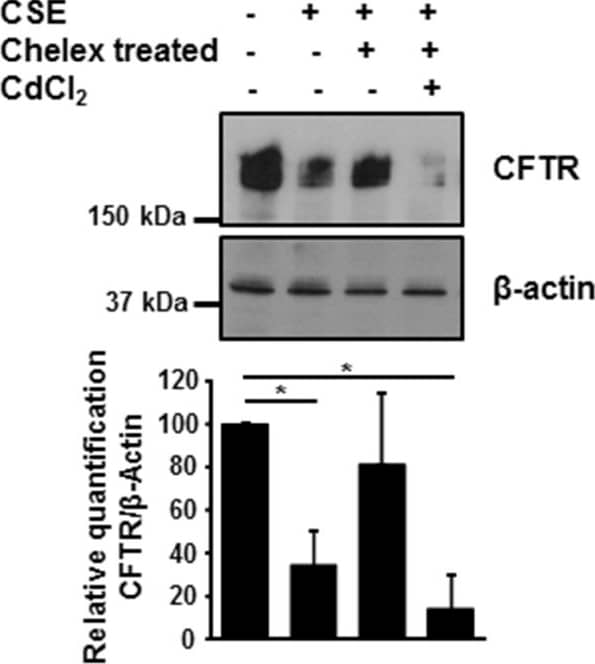
Metals present in CSE regulate CFTR expression. 16HBE14o- cells were incubated with 10% CSE before and after incubation with Chelex-100 beads, in absence or presence of 10 μM cadmium chloride. CFTR protein was detected by immunoblotting 48 hours after treatment. Blots are representative of at least three independent experiments. *p < 0.05. Image collected and cropped by CiteAb from the following publication (https://pubmed.ncbi.nlm.nih.gov/24957904), licensed under a CC-BY license. Not internally tested by R&D Systems.
Detection of Fish CFTR by Immunocytochemistry/Immunofluorescence
Immunohistochemical localization of transporters in gills of tilapia acclimated to different salinities.Representative micrographs of immunohistolocalization of Nka (green) with either Nkcc/Ncc (a–c; red) or Cftr (d–f; red) in the gills of tilapia acclimated to FW (a,d), SW (b,e) or HSW (c,f). Co-localization of red and green fluorochromes results in yellow-orange staining. Higher magnification (10×) of boxed areas in (a–f) correspond to panels (a′–f′). Sections are counter stained with the nuclear stain DAPI and overlaid with the DIC image for tissue orientation. Arrows indicate apical staining and arrowheads tubular system (basolateral) staining. Scale bar 100 µm (a–f), 10 µm (a′–c′). Image collected and cropped by CiteAb from the following publication (https://dx.plos.org/10.1371/journal.pone.0087591), licensed under a CC-BY license. Not internally tested by R&D Systems.
Detection of Fish CFTR by Immunocytochemistry/Immunofluorescence
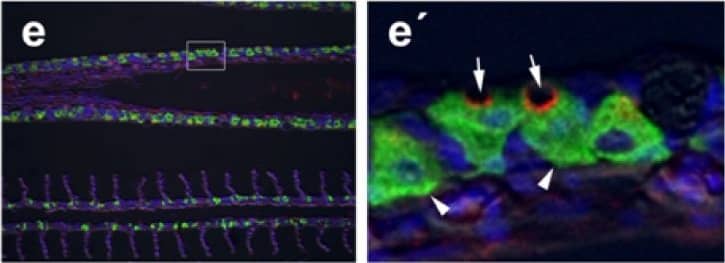
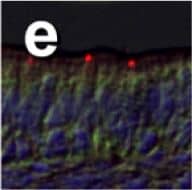
Immunohistochemical localization of transporters in anterior and posterior intestine of tilapia acclimated to different salinities.Representative micrographs of immunolocalization of Nka (green) with Nkcc/Ncc (red) (a–d, f–h) from FW (a, f), SW (b, g) and HSW (c, h) acclimated tilapia. (d) A representative higher magnification micrograph of Nkcc/Ncc staining of the brush border of enterocytes with basolateral Nka staining from the anterior intestine of SW-acclimated fish. (e) Apical Cftr (red) double labeling with Nka (green) in the anterior intestine of a FW-acclimated fish. Panels (a–e) are sections of anterior intestine (AI) while panels (f–h) are sections of posterior intestine (PI). Sections are counter stained with the nuclear stain DAPI and overlaid with the DIC image for tissue orientation. Scale bar 100 µm (a–c, f–h); 25 µm (d,e). Image collected and cropped by CiteAb from the following publication (https://dx.plos.org/10.1371/journal.pone.0087591), licensed under a CC-BY license. Not internally tested by R&D Systems.
Detection of CFTR by Western Blot
COMMD1 regulates CFTR ubiquitination.(A) Representative gels for the same CFTR IP experiment with MAB25031 from HeLa cells stably expressing wt-CFTR and separated on 8% SDS-PAGE transferred to PVDF membrane. Half of the membrane was probed with anti-CFTR mAb and the other half with anti-ubiquitin mAb. Lysates were loaded onto an 11% SDS-PAGE and sequential probing of the membrane was performed (COMMD1, alpha-tubulin and lastly ubiquitin). Filled and empty arrowheads indicate the fully- (170 kDa) and core-glycosylated (140 kDa) CFTR, respectively. (B) Quantification of ubiquitinated CFTR. Ratio of ubiquitinated CFTR to total CFTR in each condition is shown, endogenous COMMD1 expression is referred as 100%. The means ± S.D. were obtained from five independent experiments.* P<0.05 was determined by t-test. (C) Stability of the mature wt-CFTR was determined upon inhibition of protein biosynthesis with cycloheximide (CHX). Cells were incubated in the presence of cycloheximide for the indicated time intervals. (D) Quantification of mature CFTR was normalized to alpha-tubulin level. Image collected and cropped by CiteAb from the following open publication (https://pubmed.ncbi.nlm.nih.gov/21483833), licensed under a CC-BY license. Not internally tested by R&D Systems.
Detection of CFTR by Western Blot
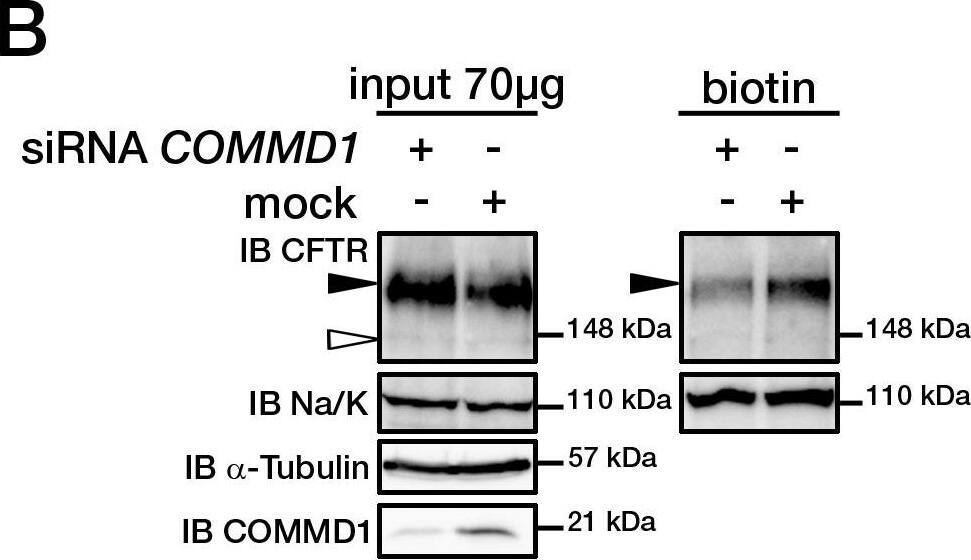
COMMD1 regulates CFTR cell surface expression.(A) HeLa cells stably expressing wt-CFTR were transiently transfected with an empty COMMD1 vector (mock, pcDNA3.1/Topo) or Myc-COMMD1, and were biotinylated with Sulfo-NHS-LC-biotin. Lysates from all these experiments were subjected to SDS-PAGE directly (input) or pulled-down with streptavidin-agarose (biotin). Representative gels for the same samples were separated by 8% SDS-PAGE for CFTR, Na/K-ATPase detection and 11% SDS-PAGE for COMMD1, alpha-tubulin detection. (B) HeLa cells stably expressing wt-CFTR were transiently transfected with a siCONTROL Non-Targeting siRNA (mock) or COMMD1 siRNA and further processed as in (A). Filled and empty arrowheads indicate the fully- (170 kDa) and core-glycosylated (140 kDa) CFTR, respectively. (C) Quantification of CFTR cell surface expression. The biotinylated CFTR level is normalized to the biotinylated Na/K-ATPase level. Endogenous COMMD1 expression is referred as 100%, with mock being pcDNA3.1/Topo for overexpression experiments (A), whereas mock was siCONTROL for silencing experiments (B). The means ± S.D. were obtained from three independent experiments.* P<0.05 was determined by t-test. (D) Immunofluorescence microscopy of COMMD1 and CFTR in HeLa cells stably expressing wt-CFTR. Cells were transfected with Myc-COMMD1 or COMMD1 siRNA for overexpression and silencing studies, respectively, and not transfected for endogenous expression studies. Two types of light exposure microscopy (short and normal) are shown to visualize all expression conditions. Scale bars: 10 µm. Image collected and cropped by CiteAb from the following open publication (https://pubmed.ncbi.nlm.nih.gov/21483833), licensed under a CC-BY license. Not internally tested by R&D Systems.

