Human MICA APC-conjugated Antibody
R&D Systems, part of Bio-Techne | Catalog # FAB1300A


Key Product Details
Validated by
Species Reactivity
Validated:
Cited:
Applications
Validated:
Cited:
Label
Antibody Source
Product Specifications
Immunogen
Specificity
Clonality
Host
Isotype
Scientific Data Images for Human MICA APC-conjugated Antibody
Detection of MICA in K562 Human Cell Line by Flow Cytometry.
K562 human chronic myelogenous leukemia cell line was stained with Mouse Anti-Human MICA APC-conjugated Monoclonal Antibody (Catalog # FAB1300A, filled histogram) or isotype control antibody (Catalog # IC0041A, open histogram). View our protocol for Staining Membrane-associated Proteins.Detection of Mouse MICA by Flow Cytometry
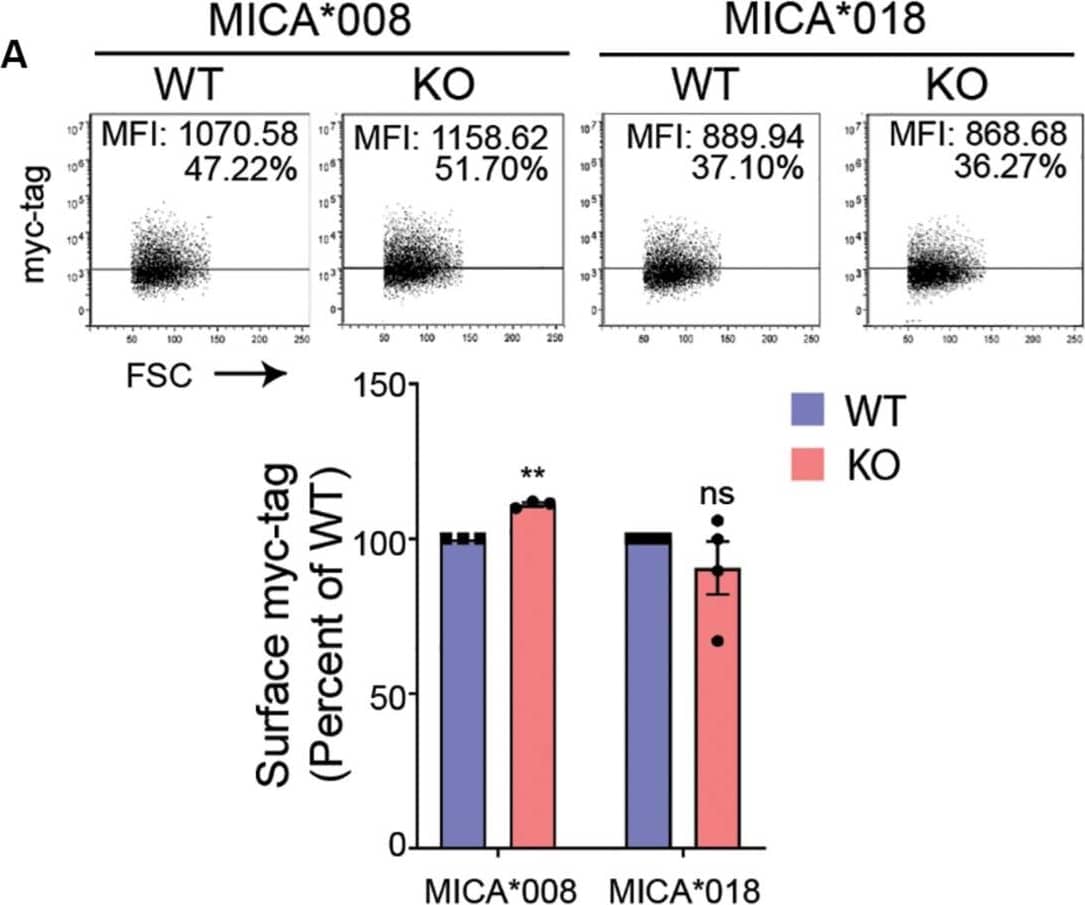
UDP-GlcNAc upregulates MICA expression. (A) HEK293 wildtype (WT) and HEK293 MGAT5 knockout (KO) cells were transfected with GFP-myc-tagged MICA*008 or MICA*018 under CMV promoter and detected on the surface the following day as surface myc-tag expression on GFP-positive cells. Data are displayed as isotype-corrected mean fluorescence intensity ( deltaMFI) relative to WT from three-four independent experiments. Dot plots are representative of all experiments. Grid is set to 5% of corresponding isotype controls. (B) MICA mRNAs were analyzed by quantitative RT-PCR in total RNA purified from WT and KO cells. MICA expression was normalized to housekeeping gene RPLP0 and shown as ratio relative to WT cells from six independent experiments. (C) UDP-GlcNAc/UDP-GalNAc measurements from LC-HRMS analysis of intracellular metabolites in WT and KO cells are presented as relative peak areas (a.u.) corresponding to UDP-GlcNAc or UDP-GalNAc. Log10-transformed values from three experiments are shown as individual dots. (D) MICA mRNA analyzed by quantitative RT-PCR in total RNA purified from WT and KO cells after 8 days cultivation with indicated concentrations of GlcNAc. MICA expression is normalized to housekeeping gene RPLP0 and displayed as ratio relative to untreated WT cells from two independent experiments. All data are displayed as mean ± SEM. Statistical analysis was performed using one-sample t-test in (A,B), and unpaired t-test with Welch’s correction in (C). **p < 0.01 and ***p < 0.001, p-value is presented in (C). Image collected and cropped by CiteAb from the following publication (https://pubmed.ncbi.nlm.nih.gov/32849657), licensed under a CC-BY license. Not internally tested by R&D Systems.Detection of Mouse MICA by Flow Cytometry
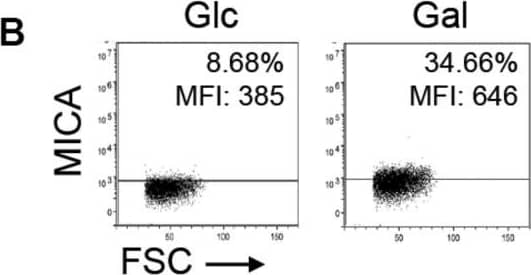
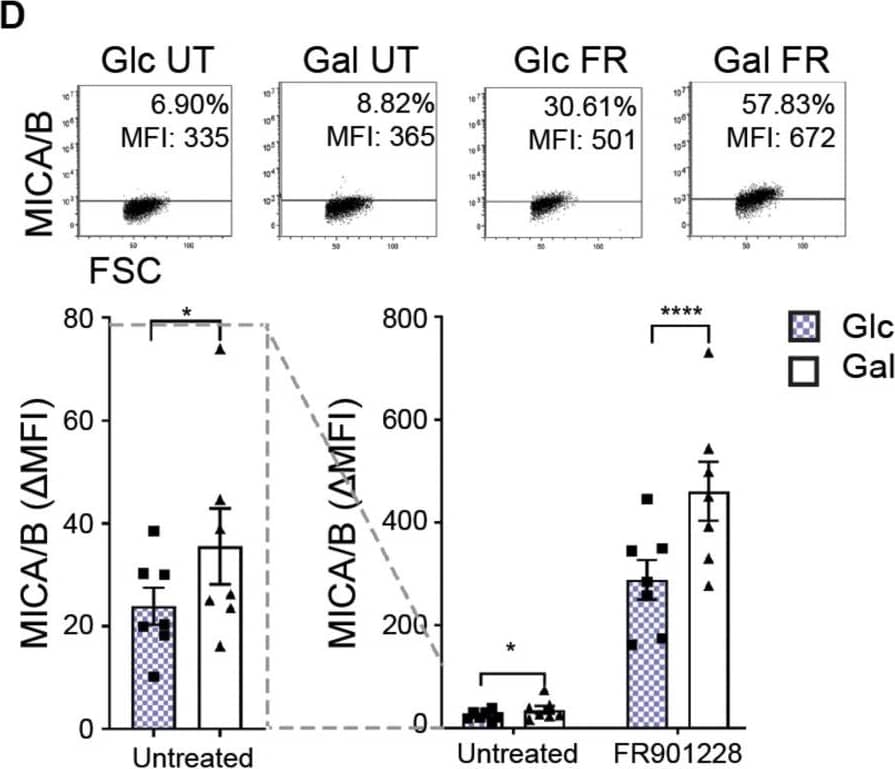
Hydroxycitrate reduces MICA expression in activated T cells and multiple cancer cells. (A) MICA mRNA analyzed by quantitative RT-PCR in total RNA purified from HEK293 cells after more than 30 passages in glucose (Glc) and galactose (Gal). MICA expression is normalized to housekeeping gene RPLP0 and displayed as mean ± SEM from six independent experiments. (B) MICA surface expression analyzed by flow cytometry of Glc and Gal cells at basal levels. Dot plots are representative of at least three independent experiments. Grid is set to ∼5% of corresponding isotype control stainings. (C) Mitochondrial stress test on HEK293 cultivated in Glc or Gal under same conditions as in Figure 4A. The graph is baselined to measuring point three and displays mean ± SEM from two independent experiments. (D) MICA/B surface expression of peripheral blood lymphocytes (PBLs) activated for 3 days in Glc or Gal growth medium prior to 18 h treatment with FR901228 (20 ng/mL). Grids in dot plots are set to ∼5% of corresponding isotype control staining and dot plots are representative of seven different donors. The bar graph displays mean ± SEM of isotype-corrected MICA/B MFI ( deltaMFI) from seven donors. Left panel is zoomed in on the difference between untreated Glc and Gal PBLs. (E,F) HEK293 MGAT5 knockout (KO) cells were treated with (E) 2DG (20 mM) or (F) hydroxycitrate (HC) (15 mM) in addition to PBS (UT), citrate (10 mM), or GlcNAc (25 mM) for 22–24 h. Bar graphs display MICA surface expression as mean ± SEM of deltaMFI values from three independent experiments. Data of UT samples share values with UT samples in Figure 3H. (G) MICA surface expression in several cancer cell lines after 18 or 42 h treatment with HC (10 mM). deltaMFI values are normalized to UT control and shown as mean ± SEM from at least three independent experiments. (H,I) MICA surface expression (H) and NKG2D-fc binding (I) in cancer cell lines after 2.5 h treatment with HC (10 mM) prior to 18 h stimulation with FR901228 (FR, 20 ng/mL) or sodium butyrate (But, 5 mM). Bar graphs display MICA surface expression as mean ± SEM of deltaMFI values (H), or NKG2D-fc surface binding as ± SEM of deltaMFI normalized to untreated (UT) control (I), from three independent experiments. Statistical analysis was performed by unpaired t-test with Welch’s correction in (A,E,F), ratio paired t-test in (D), one-sample t-test in (G), and two-way ANOVA with Bonferroni’s multiple comparison test (H,I). *p < 0.05, **p < 0.01, ***p < 0.001, and ****p < 0.0001. Image collected and cropped by CiteAb from the following publication (https://pubmed.ncbi.nlm.nih.gov/32849657), licensed under a CC-BY license. Not internally tested by R&D Systems.Applications for Human MICA APC-conjugated Antibody
Flow Cytometry
Sample: K562 human chronic myelogenous leukemia cell line
Formulation, Preparation, and Storage
Purification
Formulation
Shipping
Stability & Storage
- 12 months from date of receipt, 2 to 8 °C as supplied.
Background: MICA
MICA (MHC class I chain-related gene A) is a transmembrane glycoprotein that functions as a ligand for human NKG2D. A closely related protein, MICB, shares 85% amino acid identity with MICA. These proteins are distantly related to the MHC class I proteins. They possess three extracellular Ig-like domains, but they have no capacity to bind peptide or interact with beta2-microglobulin. The genes encoding these proteins are found within the Major Histocompatibility Complex on human chromosome 6. The MICA locus is highly polymorphic with more than 50 recognized human alleles. MICA is absent from most cells but is frequently expressed in epithelial tumors and can be induced by bacterial and viral infections. MICA is a ligand for human NKG2D, an activating receptor expressed on NK cells, NKT cells, gamma delta T cells, and CD8+ alpha beta T cells. Recognition of MICA by NKG2D results in the activation of cytolytic activity and/or cytokine production by these effector cells. MICA recognition is involved in tumor surveillance, viral infections, and autoimmune diseases.
Long Name
Alternate Names
Entrez Gene IDs
Gene Symbol
Additional MICA Products
Product Documents for Human MICA APC-conjugated Antibody
Product Specific Notices for Human MICA APC-conjugated Antibody
For research use only


