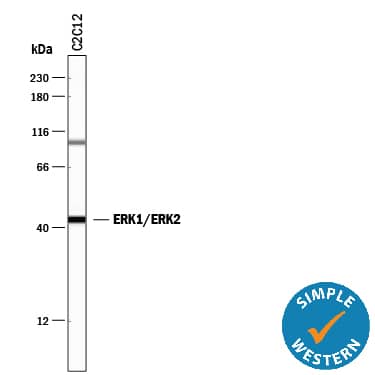
Detection of Human ERK1/ERK2 by Western Blot
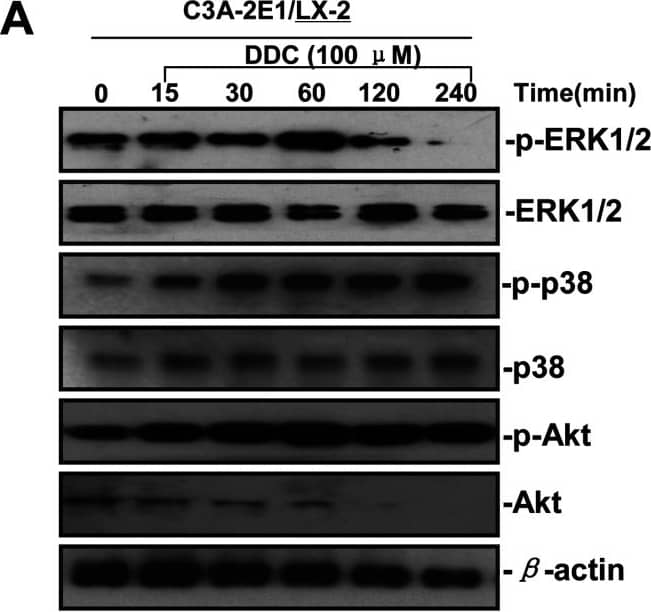
DDC up-regulates MMP-1 through ERK1/2 and Akt activation(A) Co-cultures were treated with 100 μM DDC for the indicated time. Phosphorylation of ERK1/2, p38 and Akt were determined by Western blotting analysis. The corresponding non-phosphorylated ERK1/2, p38, Akt and beta-actin were used for protein loading control. (B) Co-cultures were treated with or without 100 μM DDC for 24 h in the presence or absence of ERK1/2 inhibitor (U0126, 10 μM). MMP-1 protein levels were analysed by Western blotting. (C) Co-cultures were treated with or without 100 μM DDC for 24 h in the presence or absence of p38 inhibitor (SB203580, 10 μM). MMP-1 protein levels were analysed by Western blotting. (D) Co-cultures were treated with or without 100 μM DDC for 24 h in the presence or absence of Akt inhibitor (T3830, 50 μM). MMP-1 protein levels were analysed by Western blotting. Image collected and cropped by CiteAb from the following publication (https://pubmed.ncbi.nlm.nih.gov/23577625), licensed under a CC-BY license. Not internally tested by R&D Systems.
Detection of Human ERK1/ERK2 by Western Blot
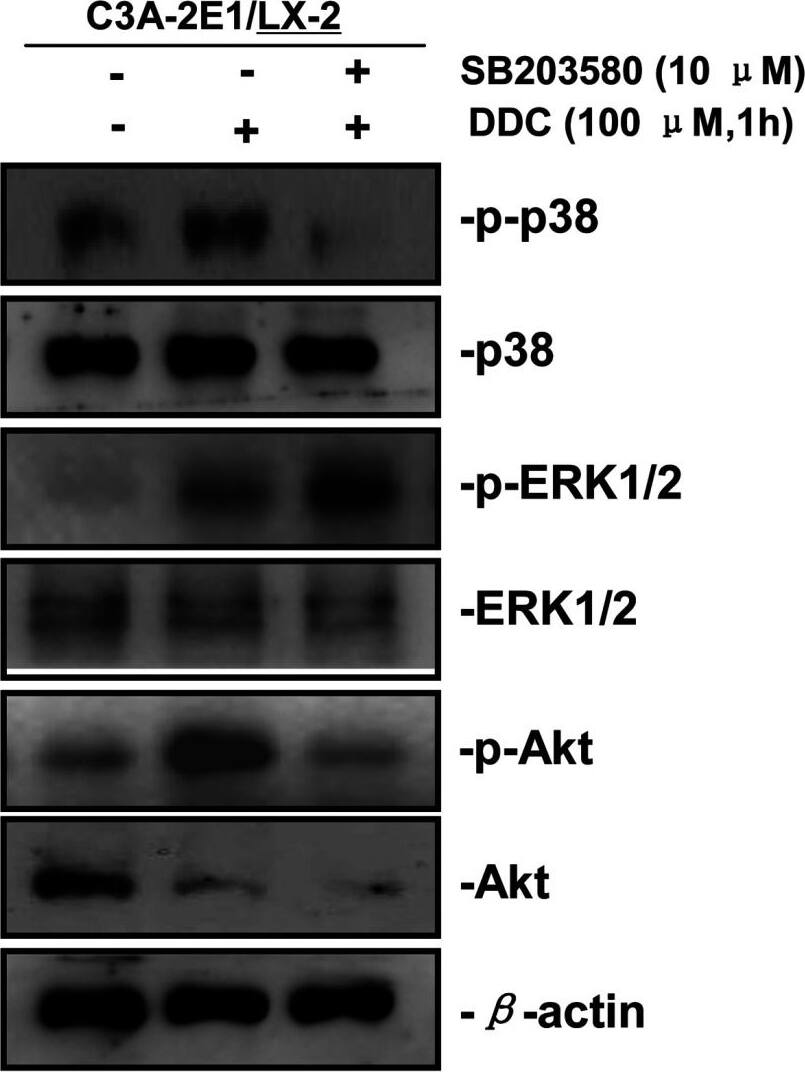
p38 inhibitor SB203580 improves the up-regulation of MMP-1 by DDC through stimulating ERK1/2Co-cultures were treated with or without 100 μM DDC for 1 h in the presence or absence of p38 inhibitor (SB203580, 10 μM). Phosphorylation of ERK1/2, p38 and Akt in LX-2 cells of co-cultures were determined by Western blotting analysis. Image collected and cropped by CiteAb from the following publication (https://pubmed.ncbi.nlm.nih.gov/23577625), licensed under a CC-BY license. Not internally tested by R&D Systems.
Detection of Human ERK1/ERK2 by Western Blot
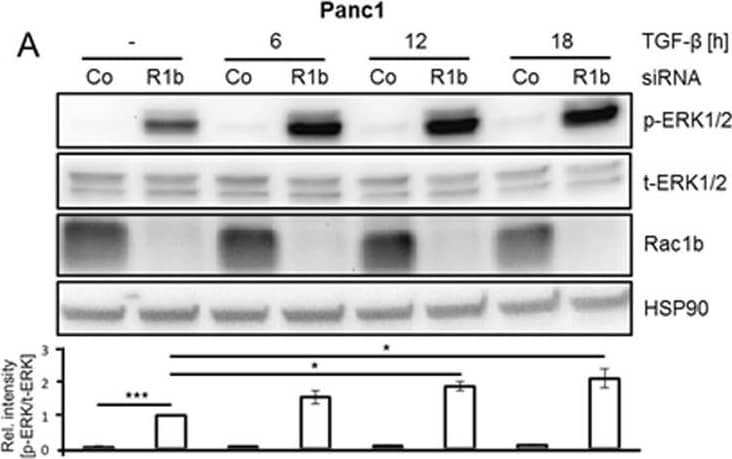
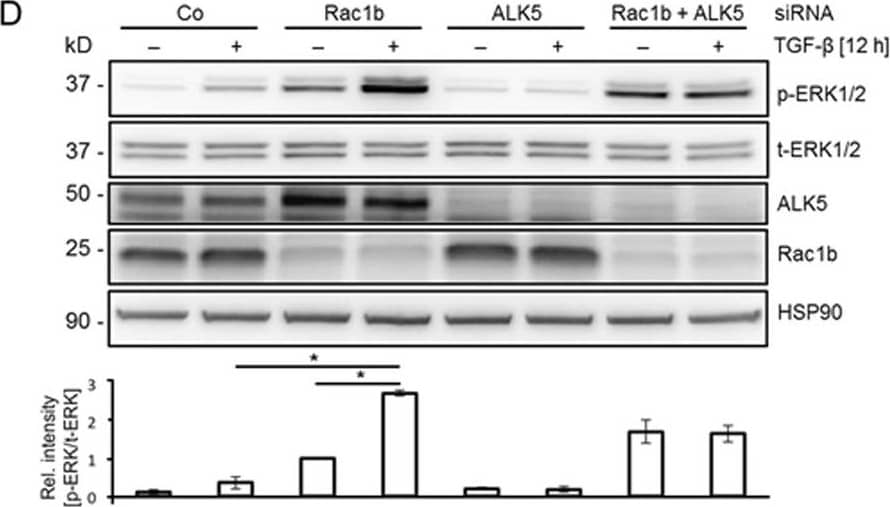
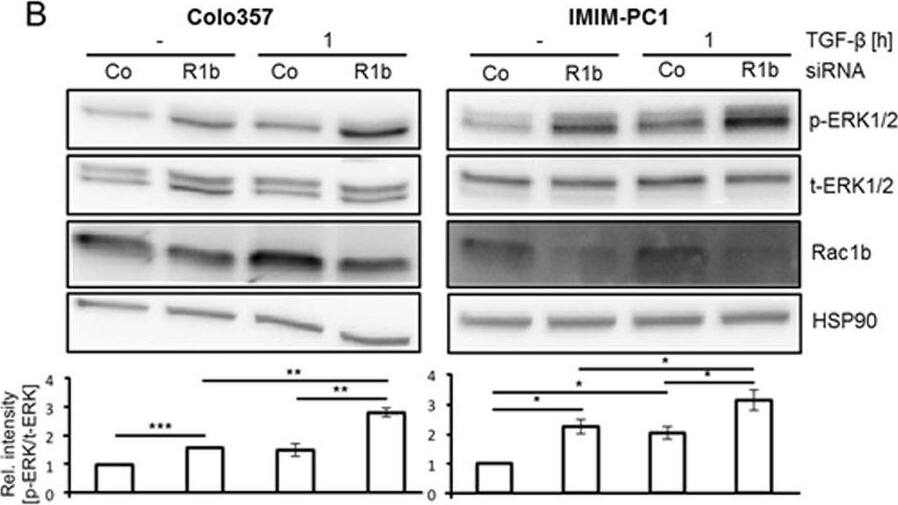
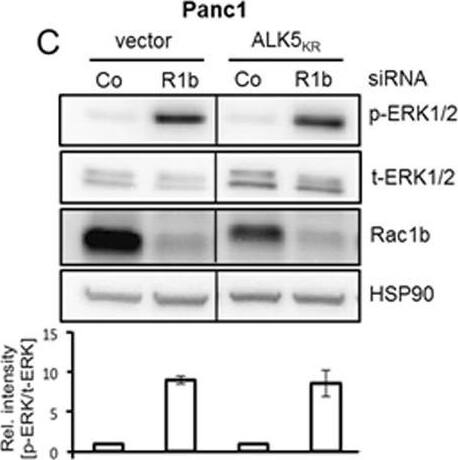
Depletion of Rac1b increases constitutive and growth factor-induced ERK1/2 phosphorylation. (A) Panc1 cells were transiently transfected with siRNA specific to Rac1b (R1b) or irrelevant control siRNA (Co), serum-starved for 24 h and treated with TGF-beta 1 as indicated. Cells were subjected to immunoblotting for p-ERK1/2, t-ERK1/2 and HSP90 as well as Rac1b as a control for transfection efficiency. The chart below shows the relative intensities of the p-ERK1/2 bands normalized to those for t-ERK1/2 from three independent experiments (mean ± SD, n = 3). Data are displayed relative to non-stimulated Rac1b siRNA-transfected cells set arbitrarily at 1. Asterisks indicate a significant difference. (B) Colo357 and IMIM-PC1 cells were transiently transfected twice on two consecutive days with 50 nM each of a siRNA specific for Rac1b (R1b), or an irrelevant control siRNA (Co), serum-starved for 24 h and subjected to immunoblotting for phospho-ERK1/2 (p-ERK1/2) and total ERK1/2 (t-ERK1/2) as well al HSP90 as a loading control. The charts below the blots show the relative intensity of the p-ERK1/2 bands normalized to the t-ERK1/2 bands of three independent experiments (mean ± SD, n = 3). Asterisks indicate a significant difference. (C) Panc1 cells stably expressing a dominant negative ALK5 mutant (ALK5KR) or empty vector were transfected twice with 50 nM each of Co siRNA or Rac1b siRNA and subjected to immunoblot analysis of p-ERK1/2. The blot was stripped and reprobed with antibodies against and t-ERK1/2 and Rac1b. The graph below the blots show the relative intensities of p-ERK1/2 normalized to those for t-ERK1/2 from three independent experiments (mean ± SD, n = 3). (D) Panc1 cells were transfected with 50 nM of irrelevant Co siRNA, Rac1b siRNA or ALK5 siRNA, or 25 nM each of Rac1b + ALK5 siRNA. Cells were serum-starved, treated with TGF-beta 1 for 12 h and subjected to immunoblotting for p-ERK1/2, t-ERK1/2 and HSP90 as well as for Rac1b and ALK5 to verify successful depletion. The graph below the blots shows the relative intensities of p-ERK1/2 bands normalized to those for t-ERK1/2 from three independent experiments (mean ± SD, n = 3). Data are displayed relative to non-stimulated Rac1b siRNA-transfected cells set arbitrarily at 1. The asterisks indicate significance. Data displayed in each panel are from the same blot/gel treated subsequently with antibodies to p-ERK1/2, Rac1b, HSP90, and ALK5, then stripped and reincubated with an antibody to t-ERK1/2. Image collected and cropped by CiteAb from the following publication (https://www.nature.com/articles/s41598-017-15170-6), licensed under a CC-BY license. Not internally tested by R&D Systems.
Detection of Human ERK1/ERK2 by Western Blot
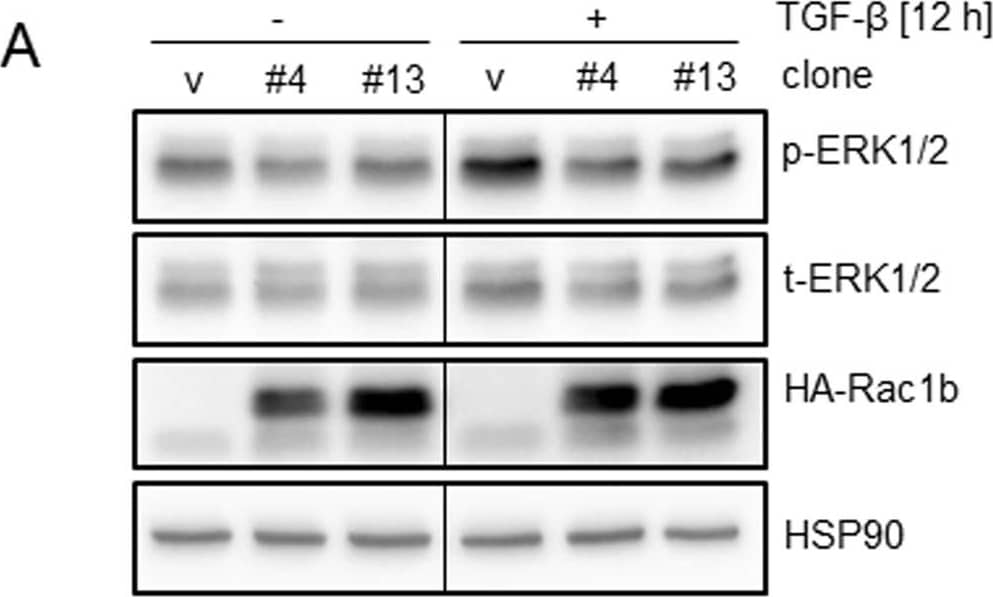
Effects of ectopic overexpression of Rac1b on TGF-beta 1-induced ERK1/2 activation and gene expression. (A) Panc1 cells stably overexpressing Rac1b from the pCGN vector (two independent clones, #4 and #13) as well as empty-vector control cells (v) were serum-starved, treated with TGF-beta 1 for 12 h and subjected to immunoblotting for p-ERK1/2, t-ERK1/2, and HA-Rac1b. The graph underneath the blot shows results from densitometric analysis of the respective bands for p-ERK1/2 normalized to those for t-ERK1/2 and derived from four independent experiments (mean ± SD, n = 4). Data are displayed relative to TGF-beta 1 stimulated vector control cells set arbitrarily at 1. Asterisks indicate a significant difference of p-ERK1/2 band intensity between the vector control and the two HA-Rac1b expressing clones. Due to the short exposure time, endogenous Rac1b protein is not visible. (B) The same cells as in (A) were stimulated with TGF-beta 1 for 24 h and subjected to qPCR for E-cadherin and PAR2. Data are displayed as TGF-beta 1-treated over control cells and are the mean ± SD of 3 experiments. Asterisks indicate significant differences. Data are from the same blot/gel treated subsequently with antibodies to p-ERK1/2, Rac1b, and HSP90, then stripped and reincubated with an antibody to t-ERK1/2. The vertical lines between lanes 3 and 4 indicate removal of irrelevant lanes from the blot. Image collected and cropped by CiteAb from the following publication (https://www.nature.com/articles/s41598-017-15170-6), licensed under a CC-BY license. Not internally tested by R&D Systems.
Detection of Human ERK1/ERK2 by Western Blot
Depletion of Rac1b increases constitutive and growth factor-induced ERK1/2 phosphorylation. (A) Panc1 cells were transiently transfected with siRNA specific to Rac1b (R1b) or irrelevant control siRNA (Co), serum-starved for 24 h and treated with TGF-beta 1 as indicated. Cells were subjected to immunoblotting for p-ERK1/2, t-ERK1/2 and HSP90 as well as Rac1b as a control for transfection efficiency. The chart below shows the relative intensities of the p-ERK1/2 bands normalized to those for t-ERK1/2 from three independent experiments (mean ± SD, n = 3). Data are displayed relative to non-stimulated Rac1b siRNA-transfected cells set arbitrarily at 1. Asterisks indicate a significant difference. (B) Colo357 and IMIM-PC1 cells were transiently transfected twice on two consecutive days with 50 nM each of a siRNA specific for Rac1b (R1b), or an irrelevant control siRNA (Co), serum-starved for 24 h and subjected to immunoblotting for phospho-ERK1/2 (p-ERK1/2) and total ERK1/2 (t-ERK1/2) as well al HSP90 as a loading control. The charts below the blots show the relative intensity of the p-ERK1/2 bands normalized to the t-ERK1/2 bands of three independent experiments (mean ± SD, n = 3). Asterisks indicate a significant difference. (C) Panc1 cells stably expressing a dominant negative ALK5 mutant (ALK5KR) or empty vector were transfected twice with 50 nM each of Co siRNA or Rac1b siRNA and subjected to immunoblot analysis of p-ERK1/2. The blot was stripped and reprobed with antibodies against and t-ERK1/2 and Rac1b. The graph below the blots show the relative intensities of p-ERK1/2 normalized to those for t-ERK1/2 from three independent experiments (mean ± SD, n = 3). (D) Panc1 cells were transfected with 50 nM of irrelevant Co siRNA, Rac1b siRNA or ALK5 siRNA, or 25 nM each of Rac1b + ALK5 siRNA. Cells were serum-starved, treated with TGF-beta 1 for 12 h and subjected to immunoblotting for p-ERK1/2, t-ERK1/2 and HSP90 as well as for Rac1b and ALK5 to verify successful depletion. The graph below the blots shows the relative intensities of p-ERK1/2 bands normalized to those for t-ERK1/2 from three independent experiments (mean ± SD, n = 3). Data are displayed relative to non-stimulated Rac1b siRNA-transfected cells set arbitrarily at 1. The asterisks indicate significance. Data displayed in each panel are from the same blot/gel treated subsequently with antibodies to p-ERK1/2, Rac1b, HSP90, and ALK5, then stripped and reincubated with an antibody to t-ERK1/2. Image collected and cropped by CiteAb from the following publication (https://www.nature.com/articles/s41598-017-15170-6), licensed under a CC-BY license. Not internally tested by R&D Systems.
Detection of Human ERK1/ERK2 by Western Blot
Phospho-proteome profiling results of LX-2 cells co-cultured with C3A–CYP2E1 cells with or without DDC treatment and detection of the effect of DDC on intracellular kinases in LX-2 cells of co-cultures200 μg of total cell lysates from LX-2 cells co-cultured with C3A-2E1 cells with or without 100 μM DDC for 1 h were incubated with membranes of the human phospho-MAPK Array Kit according to the manufacturer's instructions. Phospho MAPK Array data were developed on X-ray films following exposure to chemiluminescent reagents. 20 μg aliquots of total cell lysates from LX-2 cells were subjected to Western blotting analysis. (A) Template showing the location of MAPK antibodies spotted onto the human phospho-MAPK Array Kit. (B) The activation status of ERK1/2 in LX-2 cells co-cultured with C3A-2E1 cells after DDC treatment. (C) The activation status of p38 in LX-2 cells co-cultured with C3A-2E1 cells after DDC treatment. (D) The activation status of Akt in LX-2 cells co-cultured with C3A-2E1 cells after DDC treatment. (E) The activation status of ERK1/2, p38 and Akt in LX-2 cells co-cultured with C3A cells after DDC treatment. Image collected and cropped by CiteAb from the following publication (https://pubmed.ncbi.nlm.nih.gov/23577625), licensed under a CC-BY license. Not internally tested by R&D Systems.
Detection of Human ERK1/ERK2 by Western Blot
Depletion of Rac1b increases constitutive and growth factor-induced ERK1/2 phosphorylation. (A) Panc1 cells were transiently transfected with siRNA specific to Rac1b (R1b) or irrelevant control siRNA (Co), serum-starved for 24 h and treated with TGF-beta 1 as indicated. Cells were subjected to immunoblotting for p-ERK1/2, t-ERK1/2 and HSP90 as well as Rac1b as a control for transfection efficiency. The chart below shows the relative intensities of the p-ERK1/2 bands normalized to those for t-ERK1/2 from three independent experiments (mean ± SD, n = 3). Data are displayed relative to non-stimulated Rac1b siRNA-transfected cells set arbitrarily at 1. Asterisks indicate a significant difference. (B) Colo357 and IMIM-PC1 cells were transiently transfected twice on two consecutive days with 50 nM each of a siRNA specific for Rac1b (R1b), or an irrelevant control siRNA (Co), serum-starved for 24 h and subjected to immunoblotting for phospho-ERK1/2 (p-ERK1/2) and total ERK1/2 (t-ERK1/2) as well al HSP90 as a loading control. The charts below the blots show the relative intensity of the p-ERK1/2 bands normalized to the t-ERK1/2 bands of three independent experiments (mean ± SD, n = 3). Asterisks indicate a significant difference. (C) Panc1 cells stably expressing a dominant negative ALK5 mutant (ALK5KR) or empty vector were transfected twice with 50 nM each of Co siRNA or Rac1b siRNA and subjected to immunoblot analysis of p-ERK1/2. The blot was stripped and reprobed with antibodies against and t-ERK1/2 and Rac1b. The graph below the blots show the relative intensities of p-ERK1/2 normalized to those for t-ERK1/2 from three independent experiments (mean ± SD, n = 3). (D) Panc1 cells were transfected with 50 nM of irrelevant Co siRNA, Rac1b siRNA or ALK5 siRNA, or 25 nM each of Rac1b + ALK5 siRNA. Cells were serum-starved, treated with TGF-beta 1 for 12 h and subjected to immunoblotting for p-ERK1/2, t-ERK1/2 and HSP90 as well as for Rac1b and ALK5 to verify successful depletion. The graph below the blots shows the relative intensities of p-ERK1/2 bands normalized to those for t-ERK1/2 from three independent experiments (mean ± SD, n = 3). Data are displayed relative to non-stimulated Rac1b siRNA-transfected cells set arbitrarily at 1. The asterisks indicate significance. Data displayed in each panel are from the same blot/gel treated subsequently with antibodies to p-ERK1/2, Rac1b, HSP90, and ALK5, then stripped and reincubated with an antibody to t-ERK1/2. Image collected and cropped by CiteAb from the following publication (https://www.nature.com/articles/s41598-017-15170-6), licensed under a CC-BY license. Not internally tested by R&D Systems.
Detection of Human ERK1/ERK2 by Western Blot
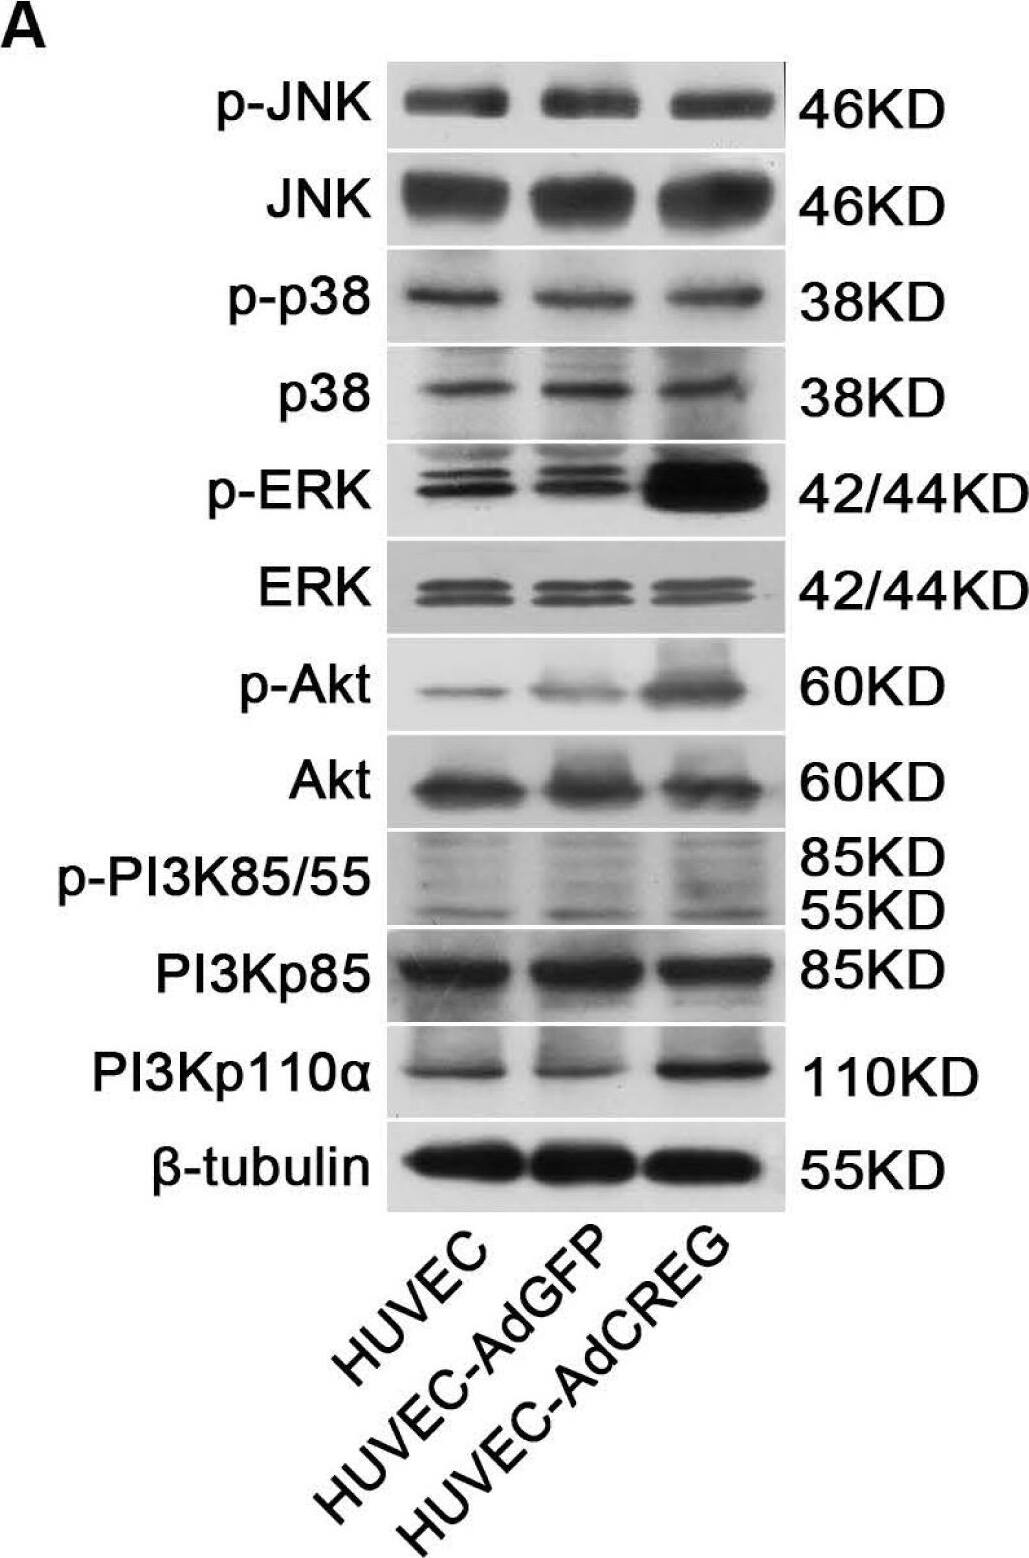
CREG overexpression activates both ERK&PI3K/Akt signaling pathways,&ERK, but not PI3K/Akt, mediates CREG effects on HUVEC proliferation. (A) In the three groups of cells (HUVEC, AdGFP&AdCREG), expression of JNK, p38, ERK, PI3K&Akt signaling molecules&their phosphorylated (p-) forms detected by WB, with beta-tubulin as the loading control. Image collected & cropped by CiteAb from the following open publication (https://pubmed.ncbi.nlm.nih.gov/24018888), licensed under a CC-BY license. Not internally tested by R&D Systems.
Detection of Human ERK1/ERK2 by Western Blot
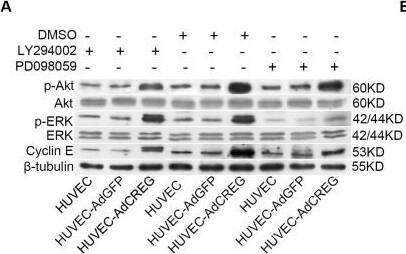
ERK, but not PI3K/Akt, mediates the increase of cyclin E induced by CREG overexpression in HUVEC. (A) Expression of p-ERK, ERK, p-Akt, Akt, cyclin E and beta-tubulin was detected by Western blotting in the three groups of cells with LY294002 (50 μM) or PD098059 (20 μM) treatment. Vehicle (DMSO)-treated cells were used as control, and beta-tubulin was used as a loading control; (B,C) Pooled analysis of the levels of Akt (B) and ERK (C) signaling activation accessed by the grayscale ratios of p-Akt/Akt and p-ERK/ERK, respectively. Data are given as the mean ± SD (n = 3). *p < 0.05; **p < 0.01. NS: no significant difference. (D) After normalization to beta-tubulin, the difference in the expression of cyclin E between the HUVEC-AdGFP and HUVEC-AdCREG group was reduced by the treatment of PD098059, but not LY294002. Data are given as the mean ± SD (n = 3). **p < 0.01. NS: no significant difference. Image collected and cropped by CiteAb from the following open publication (https://pubmed.ncbi.nlm.nih.gov/24018888), licensed under a CC-BY license. Not internally tested by R&D Systems.
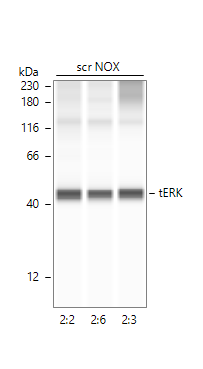
Detection of Human ERK1/ERK2 by Simple WesternTM.
Image of total ERK in A549 cells. Primary antibody dilution - 1:20 in antibody diluent 2. 60 min of incubation. Image from a verified customer review.

