GAPDH in Human Prostate Cancer Tissue.
GAPDH was detected in immersion fixed paraffin-embedded sections of human prostate cancer tissue using Goat Anti-Human/Mouse/Rat GAPDH Antigen Affinity-purified Polyclonal Antibody (Catalog # AF5718) at 3 µg/mL for 1 hour at room temperature followed by incubation with the Anti-Goat IgG VisUCyte™ HRP Polymer Antibody (Catalog #
VC004). Tissue was stained using DAB (brown) and counterstained with hematoxylin (blue). Specific staining was localized to cytoplasm and nuclei. View our protocol for IHC Staining with VisUCyte HRP Polymer Detection Reagents.
Detection of Human GAPDH by Simple WesternTM.
Simple Western lane view shows lysates of human brain (motor cortex) tissue and HepG2 human hepatocellular carcinoma cell line, loaded at 0.2 mg/mL. A specific band was detected for GAPDH at approximately 43 kDa (as indicated) using 10 µg/mL of Goat Anti-Human/Mouse/Rat GAPDH Antigen Affinity-purified Polyclonal Antibody (Catalog # AF5718) followed by 1:50 dilution of HRP-conjugated Anti-Goat IgG Secondary Antibody (Catalog #
HAF109). This experiment was conducted under reducing conditions and using the 12-230 kDa separation system.
Detection of Mouse GAPDH by Western Blot
Role of Akt pathway in aliskiren's effects on attenuating collagen expression.A and B demonstrate the results of Western blotting for phospho- and total Akt in hearts of mice treated with various diets. C shows changes in the protein levels of collagen type I, phospho- and total Akt in response to 24 hours of exposure to D,L. Homocysteine (200 µmol/L) with or without pre-treatment with aliskiren 10 µmol/L (AL), wortmannin 1 µmol/L or Akt Inhibitor VIII 1 µmol/L. Hhe – Hhe-inducing diet; D,L, homocysteine (lower panel); AL 0.05– aliskiren 0.5 mg/kg/day; AL 5– aliskiren 5 mg/kg/day; AL 50– aliskiren 50 mg/kg/day; Wort – wortmannin; Akt in – Akt inhibitor VIII. *p<0.05; **p<0.01; and ***p<0.001. Image collected and cropped by CiteAb from the following publication (https://pubmed.ncbi.nlm.nih.gov/24349097), licensed under a CC-BY license. Not internally tested by R&D Systems.
Detection of Rat GAPDH by Western Blot
Effect of prodigiosins on the mRNA and protein expression of HO-1 in gastric tissue.Data (means ± SEM of three assays) were normalized to the levels of GAPDH and expressed as fold induction (log2 scale), relative to the level of HO-1 in the control. aP < 0.05, significant difference vs. the health rats; bP < 0.05, significant difference vs. HCl/ethanol-induced rats, Duncan's post-hoc test. Image collected and cropped by CiteAb from the following publication (https://pubmed.ncbi.nlm.nih.gov/31194753), licensed under a CC-BY license. Not internally tested by R&D Systems.
Detection of Human GAPDH by Western Blot
The DU145FP cells express higher levels of cancer stemness related genes. (A) Transcriptome analyses of prostate cancer stemness-related markers. The Log2 transformed ratio of FPKM values (e.g., FP/WT) are indicated by color-coded index bars. (B) Cells were stained with fluorophore conjugated monoclonal antibodies against CD44 and EPCAM, the antibody against integrin alpha2 beta3 without fluorophore conjugation was detected by using secondary antibody conjugated with fluorophore, and stained cells were analyzed by flow cytometry. The scatter plots and histograms show representative results. CTRL denote cell stained with isotype control antibody or only secondary antibody; ST denote cell stained with antibody against EPCAM and integrin alpha2 beta3; US denote unstained cells. (C) Immunoblotting confirmation of the protein expression of A-tubulin, GAPDH, SOX9, SLUG, HIF1A, HIF2A, CD44 and integrin alpha2 beta3. Image collected and cropped by CiteAb from the following publication (https://pubmed.ncbi.nlm.nih.gov/28698547), licensed under a CC-BY license. Not internally tested by R&D Systems.
Detection of Rat GAPDH by Western Blot
Effects of aliskiren on homocysteine-induced matrix expression in cultured cardiac fibroblasts.Fibroblasts were cultured in the presence or absence of D,L, homocysteine 200 µmol/L for 24 hours after pretreatment with varying concentrations of aliskiren (0.1–10 µmol/L). Real time PCR was done to measure relative expression of COLIA2 (alpha 2 chain of type I collagen; A) and COL3A1 (alpha 1 chain of type III collagen; B) genes. Figure 5C demonstrates the results of real time PCR to compare the effects of losartan and captopril with aliskiren on homocysteine induced expression of COL1A2 gene. Western blotting was conducted to measure the expression of collagen type I protein (D and E) Glyceraldehyde 3 phosphate dehydrogenase (GAPDH) was used as internal control. Hcy-D,L, homocysteine; AL-aliskiren; Los – losartan; and Cap – captopril. *p<0.05. Image collected and cropped by CiteAb from the following publication (https://pubmed.ncbi.nlm.nih.gov/24349097), licensed under a CC-BY license. Not internally tested by R&D Systems.
Detection of Mouse GAPDH by Western Blot
Role of Akt pathway in aliskiren's effects on attenuating collagen expression.A and B demonstrate the results of Western blotting for phospho- and total Akt in hearts of mice treated with various diets. C shows changes in the protein levels of collagen type I, phospho- and total Akt in response to 24 hours of exposure to D,L. Homocysteine (200 µmol/L) with or without pre-treatment with aliskiren 10 µmol/L (AL), wortmannin 1 µmol/L or Akt Inhibitor VIII 1 µmol/L. Hhe – Hhe-inducing diet; D,L, homocysteine (lower panel); AL 0.05– aliskiren 0.5 mg/kg/day; AL 5– aliskiren 5 mg/kg/day; AL 50– aliskiren 50 mg/kg/day; Wort – wortmannin; Akt in – Akt inhibitor VIII. *p<0.05; **p<0.01; and ***p<0.001. Image collected and cropped by CiteAb from the following publication (https://pubmed.ncbi.nlm.nih.gov/24349097), licensed under a CC-BY license. Not internally tested by R&D Systems.
Detection of Mouse GAPDH by Western Blot
Effects of aliskiren on myocardial matrix gene expression.Real time PCR was performed with ventricular tissue obtained from mice after 12-inducing diet and different doses of aliskiren. Figure 3A demonstrates changes in expression of COL1A1(alpha 1 chain of type I collagen) and 3B shows changes in COL1A2(alpha2 chain of type I collagen) genes. Lower right panels (3C and 3D) demonstrate the results of western blotting for collagen type I in various groups. Hhe – Hhe-inducing diet; AL 0.5– aliskiren 0.5 mg/kg/day; AL 5– aliskiren 5 mg/kg/day; and AL 50– aliskiren 50 mg/kg/day. * p<0.05; and *** p<0.001. Image collected and cropped by CiteAb from the following publication (https://pubmed.ncbi.nlm.nih.gov/24349097), licensed under a CC-BY license. Not internally tested by R&D Systems.
Detection of Mouse Human/Mouse/Rat GAPDH Antibody by Western Blot
S. Typhimurium evades autophagy by disrupting Sirt1-dependent AMPK activation.(A) Immunofluorescence image of S. Typhimurium co-localization with LC3 in GFP-LC3 expressing BMDMs at indicated time points. Data shown are representative of 3 independent experiments (n = 3). (B) Immunoblot analysis of p62 and LC3 expression upon S. Typhimurium infection in BMDMs. (C) LC3 and p62 expression levels are quantified by densitometry analysis. Data shown are from 3 independent experiments. (D) Confocal image of macrophages stained for Sirt1 and LC3. (E) BMDMs stained for LC3 and AMPK upon S. Typhimurium infection. (F) Confocal image of macrophages stained for LKB1 and LC3. (G) Immunoblot analysis of Sirt1, AMPK and LKB1 in wild type (WT) and Atg7-deficient macrophages. (H) Densitometric analysis of Sirt1, AMPK and LKB1 immunoblots (n = 3). Bar graphs are expressed as mean ± SEM, ***p≤0.001, **p≤0.01 and *p≤0.05. Scale bar = 10μm for microscopical images. Image collected and cropped by CiteAb from the following publication (https://pubmed.ncbi.nlm.nih.gov/28192515), licensed under a CC-BY license. Not internally tested by R&D Systems.
Detection of Mouse Human/Mouse/Rat GAPDH Antibody by Western Blot
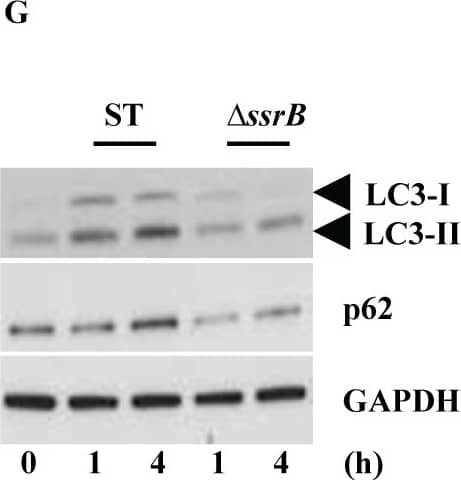
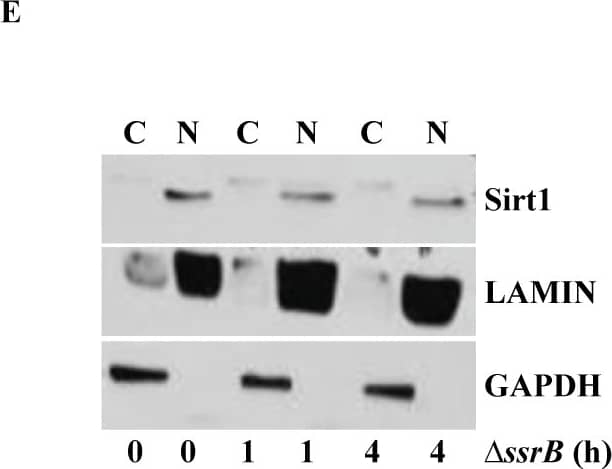
S. Typhimurium mediated targeting of Sirt1 for lysosomal degradation is virulence dependent.Immunoblot analysis of ACC and LKB1 activation upon infection with deltassrB(A) and deltassaV(B) compared to S. Typhimurium. Sirt1 and acetylated-NF kappaB from macrophages infected with deltassrB(C)and deltassaV(D) compared to S. Typhimurium. (E) Expression of Sirt1 from cytoplasmic (C) and nuclear (N) fraction from BMDMs infected with deltassrB. (F) Confocal image of Sirt1 and LysoTracker Red in deltassrB-infected BMDMs. Sirt1-LysoTracker Red co-localization in untreated BMDMs infected with S. Typhimurium for 4h is shown for comparison (n = 3). (G) Immunoblot analysis of LC3 and p62. (H) Densitometric analysis of LC3 lipidation and p62 (n = 4). (I) Immunofluorescence image of deltassrB-infected BMDMs stained for LC3 and LPS of S. Typhimurium (n = 3). (J) Quantitation of LC3 co-localization with SCVs. 100 SCVs were counted and expressed as percentage co-localization. (K) AKT, mTOR, p70S6K, NDRG1 expression upon S. Typhimurium (ST) and deltassrB infection in BMDMs. (L) Densitometric analysis of AKT, mTOR, p70S6K and NDRG1 are shown from 3 independent experiments. Bar graphs are expressed as mean ± SEM, ***p≤0.001. Scale bar = 10μm for microscopical images. Image collected and cropped by CiteAb from the following publication (https://pubmed.ncbi.nlm.nih.gov/28192515), licensed under a CC-BY license. Not internally tested by R&D Systems.
Detection of Mouse Human/Mouse/Rat GAPDH Antibody by Western Blot
S. Typhimurium evades autophagy by disrupting Sirt1-dependent AMPK activation.(A) Immunofluorescence image of S. Typhimurium co-localization with LC3 in GFP-LC3 expressing BMDMs at indicated time points. Data shown are representative of 3 independent experiments (n = 3). (B) Immunoblot analysis of p62 and LC3 expression upon S. Typhimurium infection in BMDMs. (C) LC3 and p62 expression levels are quantified by densitometry analysis. Data shown are from 3 independent experiments. (D) Confocal image of macrophages stained for Sirt1 and LC3. (E) BMDMs stained for LC3 and AMPK upon S. Typhimurium infection. (F) Confocal image of macrophages stained for LKB1 and LC3. (G) Immunoblot analysis of Sirt1, AMPK and LKB1 in wild type (WT) and Atg7-deficient macrophages. (H) Densitometric analysis of Sirt1, AMPK and LKB1 immunoblots (n = 3). Bar graphs are expressed as mean ± SEM, ***p≤0.001, **p≤0.01 and *p≤0.05. Scale bar = 10μm for microscopical images. Image collected and cropped by CiteAb from the following publication (https://pubmed.ncbi.nlm.nih.gov/28192515), licensed under a CC-BY license. Not internally tested by R&D Systems.
Detection of Mouse Human/Mouse/Rat GAPDH Antibody by Western Blot
S. Typhimurium mediated targeting of Sirt1 for lysosomal degradation is virulence dependent.Immunoblot analysis of ACC and LKB1 activation upon infection with deltassrB(A) and deltassaV(B) compared to S. Typhimurium. Sirt1 and acetylated-NF kappaB from macrophages infected with deltassrB(C)and deltassaV(D) compared to S. Typhimurium. (E) Expression of Sirt1 from cytoplasmic (C) and nuclear (N) fraction from BMDMs infected with deltassrB. (F) Confocal image of Sirt1 and LysoTracker Red in deltassrB-infected BMDMs. Sirt1-LysoTracker Red co-localization in untreated BMDMs infected with S. Typhimurium for 4h is shown for comparison (n = 3). (G) Immunoblot analysis of LC3 and p62. (H) Densitometric analysis of LC3 lipidation and p62 (n = 4). (I) Immunofluorescence image of deltassrB-infected BMDMs stained for LC3 and LPS of S. Typhimurium (n = 3). (J) Quantitation of LC3 co-localization with SCVs. 100 SCVs were counted and expressed as percentage co-localization. (K) AKT, mTOR, p70S6K, NDRG1 expression upon S. Typhimurium (ST) and deltassrB infection in BMDMs. (L) Densitometric analysis of AKT, mTOR, p70S6K and NDRG1 are shown from 3 independent experiments. Bar graphs are expressed as mean ± SEM, ***p≤0.001. Scale bar = 10μm for microscopical images. Image collected and cropped by CiteAb from the following publication (https://pubmed.ncbi.nlm.nih.gov/28192515), licensed under a CC-BY license. Not internally tested by R&D Systems.
Detection of Mouse Human/Mouse/Rat GAPDH Antibody by Western Blot
S. Typhimurium mediated targeting of Sirt1 for lysosomal degradation is virulence dependent.Immunoblot analysis of ACC and LKB1 activation upon infection with deltassrB(A) and deltassaV(B) compared to S. Typhimurium. Sirt1 and acetylated-NF kappaB from macrophages infected with deltassrB(C)and deltassaV(D) compared to S. Typhimurium. (E) Expression of Sirt1 from cytoplasmic (C) and nuclear (N) fraction from BMDMs infected with deltassrB. (F) Confocal image of Sirt1 and LysoTracker Red in deltassrB-infected BMDMs. Sirt1-LysoTracker Red co-localization in untreated BMDMs infected with S. Typhimurium for 4h is shown for comparison (n = 3). (G) Immunoblot analysis of LC3 and p62. (H) Densitometric analysis of LC3 lipidation and p62 (n = 4). (I) Immunofluorescence image of deltassrB-infected BMDMs stained for LC3 and LPS of S. Typhimurium (n = 3). (J) Quantitation of LC3 co-localization with SCVs. 100 SCVs were counted and expressed as percentage co-localization. (K) AKT, mTOR, p70S6K, NDRG1 expression upon S. Typhimurium (ST) and deltassrB infection in BMDMs. (L) Densitometric analysis of AKT, mTOR, p70S6K and NDRG1 are shown from 3 independent experiments. Bar graphs are expressed as mean ± SEM, ***p≤0.001. Scale bar = 10μm for microscopical images. Image collected and cropped by CiteAb from the following publication (https://pubmed.ncbi.nlm.nih.gov/28192515), licensed under a CC-BY license. Not internally tested by R&D Systems.
Detection of Mouse Human/Mouse/Rat GAPDH Antibody by Western Blot
S. Typhimurium mediated targeting of Sirt1 for lysosomal degradation is virulence dependent.Immunoblot analysis of ACC and LKB1 activation upon infection with deltassrB(A) and deltassaV(B) compared to S. Typhimurium. Sirt1 and acetylated-NF kappaB from macrophages infected with deltassrB(C)and deltassaV(D) compared to S. Typhimurium. (E) Expression of Sirt1 from cytoplasmic (C) and nuclear (N) fraction from BMDMs infected with deltassrB. (F) Confocal image of Sirt1 and LysoTracker Red in deltassrB-infected BMDMs. Sirt1-LysoTracker Red co-localization in untreated BMDMs infected with S. Typhimurium for 4h is shown for comparison (n = 3). (G) Immunoblot analysis of LC3 and p62. (H) Densitometric analysis of LC3 lipidation and p62 (n = 4). (I) Immunofluorescence image of deltassrB-infected BMDMs stained for LC3 and LPS of S. Typhimurium (n = 3). (J) Quantitation of LC3 co-localization with SCVs. 100 SCVs were counted and expressed as percentage co-localization. (K) AKT, mTOR, p70S6K, NDRG1 expression upon S. Typhimurium (ST) and deltassrB infection in BMDMs. (L) Densitometric analysis of AKT, mTOR, p70S6K and NDRG1 are shown from 3 independent experiments. Bar graphs are expressed as mean ± SEM, ***p≤0.001. Scale bar = 10μm for microscopical images. Image collected and cropped by CiteAb from the following publication (https://pubmed.ncbi.nlm.nih.gov/28192515), licensed under a CC-BY license. Not internally tested by R&D Systems.
Detection of GAPDH by Western Blot
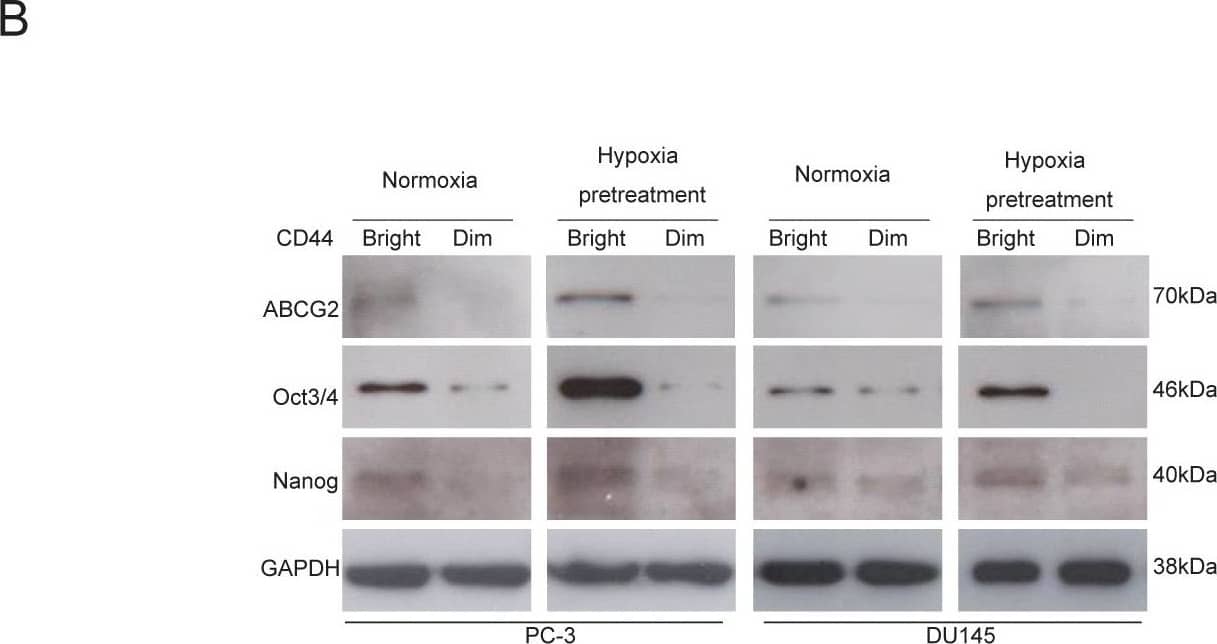
CD44bright cells are mainly positive for ABCG2, Oct3/4 and Nanog.(A) Double staining of CD44 and ABCG2 surface markers with flow cytometry assay shows higher levels expressions of these factors in both cell lines under hypoxia for 48 hours. (B) The CD44bright cells under normoxia express higher levels of ABCG2, Oct3/4 and Nanog, but the CD44dim cells under the same normoxia condition express very low levels of these factors. The CD44bright cells pretreated under 1% O2 for 48 hours show even higher levels of these factors compared to the CD44bright cells cultivated under normoxia. Image collected and cropped by CiteAb from the following open publication (https://pubmed.ncbi.nlm.nih.gov/22216200), licensed under a CC-BY license. Not internally tested by R&D Systems.
Detection of Human GAPDH by Simple Western
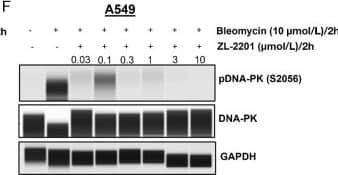
Evaluation of ZL-2201 antiproliferative activity in vitro. A, Chemical structure of ZL-2201, a potent and selective DNA-PK inhibitor. B, Concentration-dependent response to ZL-2201 in M059J and M059K glioblastoma cancer cells measured by CTG after 6-day of treatment. The graph represents the average inhibitory (IC50) values (n = 3). C, Concentration-dependent response to ZL-2201 in CRISPR KO of ATM in A549 and FaDu cancer cells measured by CTG after 6 days of treatment. The graph represents the average inhibitory (IC50) values (n = 2–5). D, IC50 responses to ZL-2201 in ATM mutant cell lines (black bars) versus ATM WT A549 cell line (gray bar). Cell growth was measured by CTG after 6 days of treatment. The graph represents the average inhibitory (IC50) values (n = 2–6). NCI-H1703 (E) and A549 (F) cancer cells were treated with bleomycin (10 μmol/L) for 2 hours followed by the addition of increasing concentration of ZL-2201 for 2 hours. Whole-cell lysates were harvested, and concentration-dependent inhibition of DNA-PK protein were analyzed by Simple Western. Image collected and cropped by CiteAb from the following open publication (https://pubmed.ncbi.nlm.nih.gov/37663435), licensed under a CC-BY license. Not internally tested by R&D Systems.
Detection of Human GAPDH by Simple Western
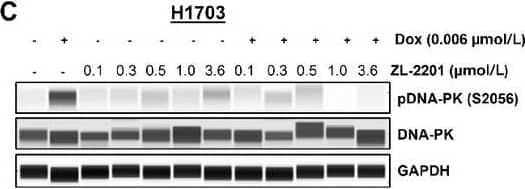
Phenotypic evaluation of ZL-2201 synergy with various DNA-damaging agents. C, NCI-H1703 cells treated with ZL-2201 (0.1, 0.3, 0.5, 1,&3.6 μmol/L)&a low dose of doxorubicin (0.006 μmol/L) for 2 hours. Whole-cell lysates harvested,&Simple Western was used to show the inhibition of pDNA-PK upon combination treatment of ZL-2201 with doxorubicin. Image collected & cropped by CiteAb from the following open publication (https://pubmed.ncbi.nlm.nih.gov/37663435), licensed under a CC-BY license. Not internally tested by R&D Systems.
Detection of Human GAPDH by Simple Western
Evaluation of ZL-2201 antiproliferative activity in vitro. A, Chemical structure of ZL-2201, a potent and selective DNA-PK inhibitor. B, Concentration-dependent response to ZL-2201 in M059J and M059K glioblastoma cancer cells measured by CTG after 6-day of treatment. The graph represents the average inhibitory (IC50) values (n = 3). C, Concentration-dependent response to ZL-2201 in CRISPR KO of ATM in A549 and FaDu cancer cells measured by CTG after 6 days of treatment. The graph represents the average inhibitory (IC50) values (n = 2–5). D, IC50 responses to ZL-2201 in ATM mutant cell lines (black bars) versus ATM WT A549 cell line (gray bar). Cell growth was measured by CTG after 6 days of treatment. The graph represents the average inhibitory (IC50) values (n = 2–6). NCI-H1703 (E) and A549 (F) cancer cells were treated with bleomycin (10 μmol/L) for 2 hours followed by the addition of increasing concentration of ZL-2201 for 2 hours. Whole-cell lysates were harvested, and concentration-dependent inhibition of DNA-PK protein were analyzed by Simple Western. Image collected and cropped by CiteAb from the following open publication (https://pubmed.ncbi.nlm.nih.gov/37663435), licensed under a CC-BY license. Not internally tested by R&D Systems.


