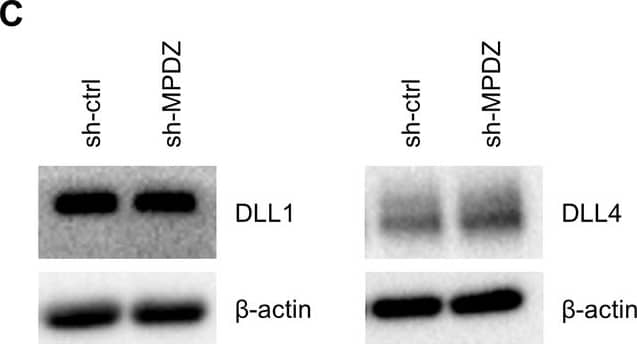
Detection of Mouse DLL4 by Western Blot
MPDZ promotes Notch signaling activity.(A) HUVECs were either transduced with lentivirus expressing GFP (sh-ctrl) or with lentivirus expressing shRNA against MPDZ (sh-MPDZ). Expression level of Notch target genes HEY1, HEY2 and HES1 were analyzed by qPCR 48 hr after transduction. Data are presented as mean ±SD. n ≥ 3; *, p<0.05; **, p<0.01; ***, p<0.001 unpaired Student’s t-test. (B) Cardiac endothelial cells were isolated from Mpdzfl/fl and Mpdz deltaEC mice by magnetic beads bound with CD31 antibodies. Expression levels of Notch target genes Hey1 and Hey2 were analyzed by qPCR. Data are presented as mean ±SD. n = 3; *, p<0.05; ***, p<0.001 unpaired Student’s t-test. (C) HUVECs were either transduced with lentivirus expressing GFP (sh-ctrl) or with lentivirus expressing shRNA against MPDZ (sh-MPDZ). Expression levels of DLL1 and DLL4 were analyzed by immunoblotting 48 hr after transduction. beta-actin served as loading control. Data are presented as mean ±SD. n ≥ 3; n.s., not significant. (D) HUVECs were either transduced with adenovirus expressing GFP (ctrl) or with adenovirus expressing MPDZ. Expression levels of DLL1 and DLL4 were analyzed by immunoblotting 48 hr after transduction. beta-actin served as loading control. Data are presented as mean ±SD. n ≥ 3; n.s., not significant. (E) Lung endothelial cells were isolated from Mpdzfl/fl and Mpdz deltaEC mice by CD31 magnetic beads. Protein amounts of Dll1 and Dll4 were analyzed by immunoblotting. beta-actin served as loading control. Data are presented as mean ±SD. n = 3; n.s., not significant.10.7554/eLife.32860.007Figure 2—source data 1.Source data of qantitative PCR analysis related to Figure 2A and B.Source data of qantitative PCR analysis related to Figure 2A and B. Image collected and cropped by CiteAb from the following open publication (https://pubmed.ncbi.nlm.nih.gov/29620522), licensed under a CC-BY license. Not internally tested by R&D Systems.
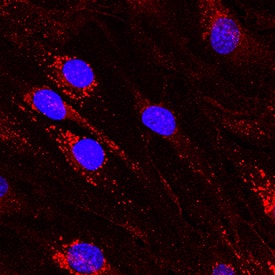
Detection of Mouse DLL4 by Immunocytochemistry/ Immunofluorescence
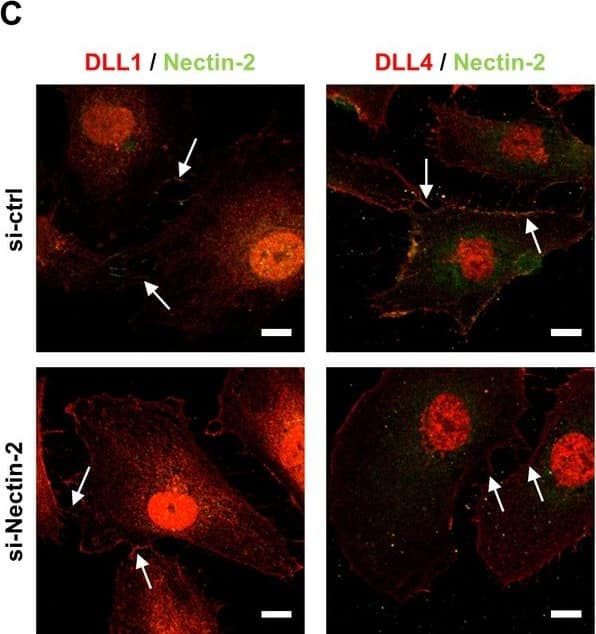
Mpdz does not affect cell cell junction assembly.(A, B) HUVECs were either transduced with lentivirus expressing GFP (sh-ctrl) or with lentivirus expressing shRNA against MPDZ (sh-MPDZ). Cells were cultured under sparse conditions (A) or confluent conditions (B). After PFA fixation cells were stained for DLL1 and Nectin-2 or DLL4 and Nectin-2 and counterstained with DAPI. Images were acquired with the confocal microscope LSM 700. Arrow indicates co-localization of DLL1/4 with Nectin-2 at the cell membrane. Arrow head indicates diminished co-localization at the cell membrane. Scale bar: 10 µm. (C) HUVECs were either transfected with control siRNA (si-ctrl) or with siRNA against Nectin-2 (si-Nectin-2). After PFA fixation cells were stained for DLL1 and Nectin-2 or DLL4 and Nectin-2. Images were acquired with the confocal microscope LSM 700. Arrow indicates localization of DLL1/4 at the cell membrane.Scale bar: 10 µm. Image collected and cropped by CiteAb from the following open publication (https://pubmed.ncbi.nlm.nih.gov/29620522), licensed under a CC-BY license. Not internally tested by R&D Systems.
Detection of Mouse DLL4 by Western Blot
MPDZ promotes Notch signaling activity.(A) HUVECs were either transduced with lentivirus expressing GFP (sh-ctrl) or with lentivirus expressing shRNA against MPDZ (sh-MPDZ). Expression level of Notch target genes HEY1, HEY2 and HES1 were analyzed by qPCR 48 hr after transduction. Data are presented as mean ±SD. n ≥ 3; *, p<0.05; **, p<0.01; ***, p<0.001 unpaired Student’s t-test. (B) Cardiac endothelial cells were isolated from Mpdzfl/fl and Mpdz deltaEC mice by magnetic beads bound with CD31 antibodies. Expression levels of Notch target genes Hey1 and Hey2 were analyzed by qPCR. Data are presented as mean ±SD. n = 3; *, p<0.05; ***, p<0.001 unpaired Student’s t-test. (C) HUVECs were either transduced with lentivirus expressing GFP (sh-ctrl) or with lentivirus expressing shRNA against MPDZ (sh-MPDZ). Expression levels of DLL1 and DLL4 were analyzed by immunoblotting 48 hr after transduction. beta-actin served as loading control. Data are presented as mean ±SD. n ≥ 3; n.s., not significant. (D) HUVECs were either transduced with adenovirus expressing GFP (ctrl) or with adenovirus expressing MPDZ. Expression levels of DLL1 and DLL4 were analyzed by immunoblotting 48 hr after transduction. beta-actin served as loading control. Data are presented as mean ±SD. n ≥ 3; n.s., not significant. (E) Lung endothelial cells were isolated from Mpdzfl/fl and Mpdz deltaEC mice by CD31 magnetic beads. Protein amounts of Dll1 and Dll4 were analyzed by immunoblotting. beta-actin served as loading control. Data are presented as mean ±SD. n = 3; n.s., not significant.10.7554/eLife.32860.007Figure 2—source data 1.Source data of qantitative PCR analysis related to Figure 2A and B.Source data of qantitative PCR analysis related to Figure 2A and B. Image collected and cropped by CiteAb from the following open publication (https://pubmed.ncbi.nlm.nih.gov/29620522), licensed under a CC-BY license. Not internally tested by R&D Systems.
Detection of Mouse DLL4 by Immunocytochemistry/ Immunofluorescence
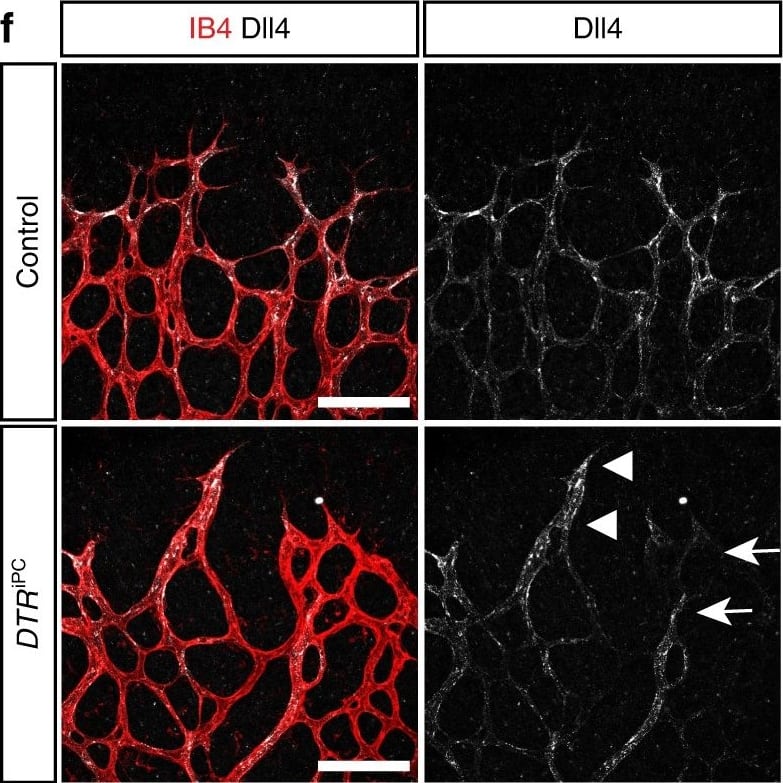
Endothelial changes after pericyte depletion. a–f Maximum intensity projection of confocal images from control and DTRiPC P6 retinas stained for IB4 (red) in combination with VEGF-A a, VEGFR2 b, VEGFR3 c, Tie2 d, Esm1 e, and Dll4 f (all in white), as indicated. Note local increase of VEGFR2, VEGFR3, and Esm1 (arrowheads in b, c, e) but not Tie2 or VEGF-A at the edge of the vessel plexus. Dll4 expression in DTRiPC sprouts is increased in some regions (arrowheads) but absent in others (arrows). Scale bar, 100 µm. g–j Quantitation of VEGF-A immunosignals area and intensity g, signal intensity for VEGFR2 h and VEGFR3 i and proportion of Esm1+ area with respect to vascular area j in the P6 control and DTRiPC angiogenic front. Error bars, s.e.m. p-values, Student’s t-test. Image collected and cropped by CiteAb from the following open publication (https://pubmed.ncbi.nlm.nih.gov/29146905), licensed under a CC-BY license. Not internally tested by R&D Systems.
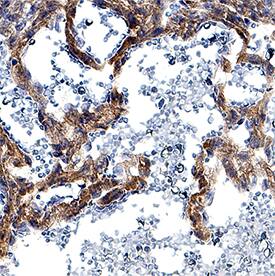
Detection of Mouse DLL4 by Immunohistochemistry
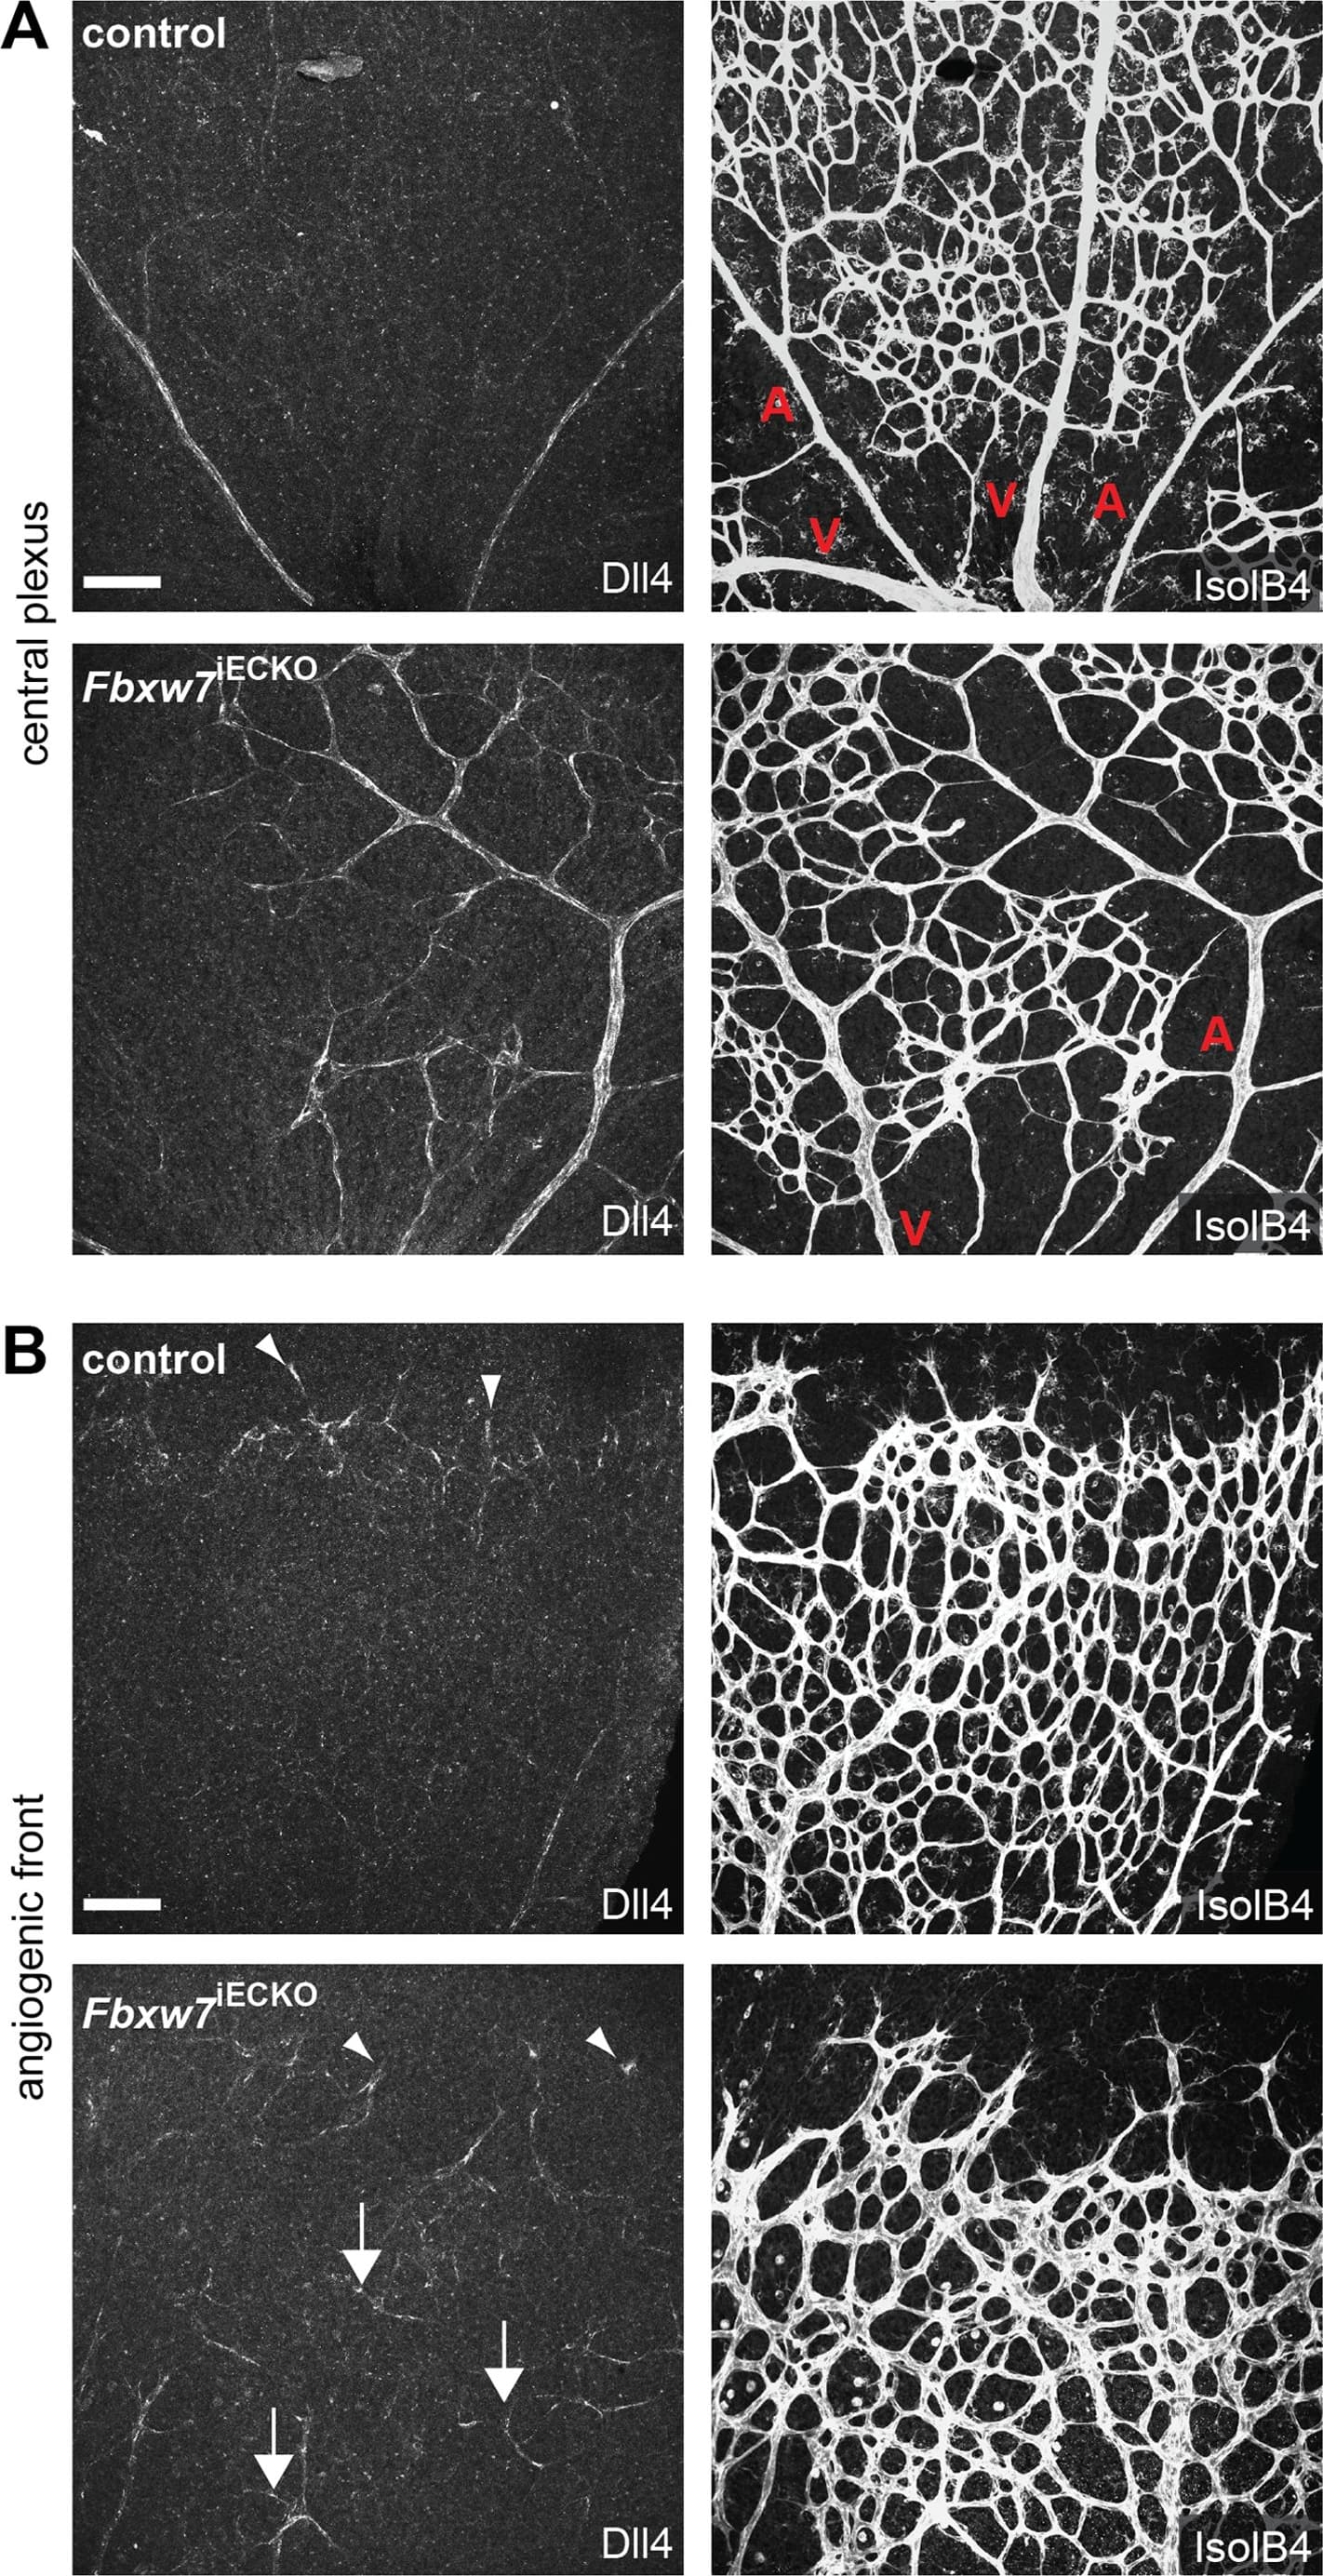
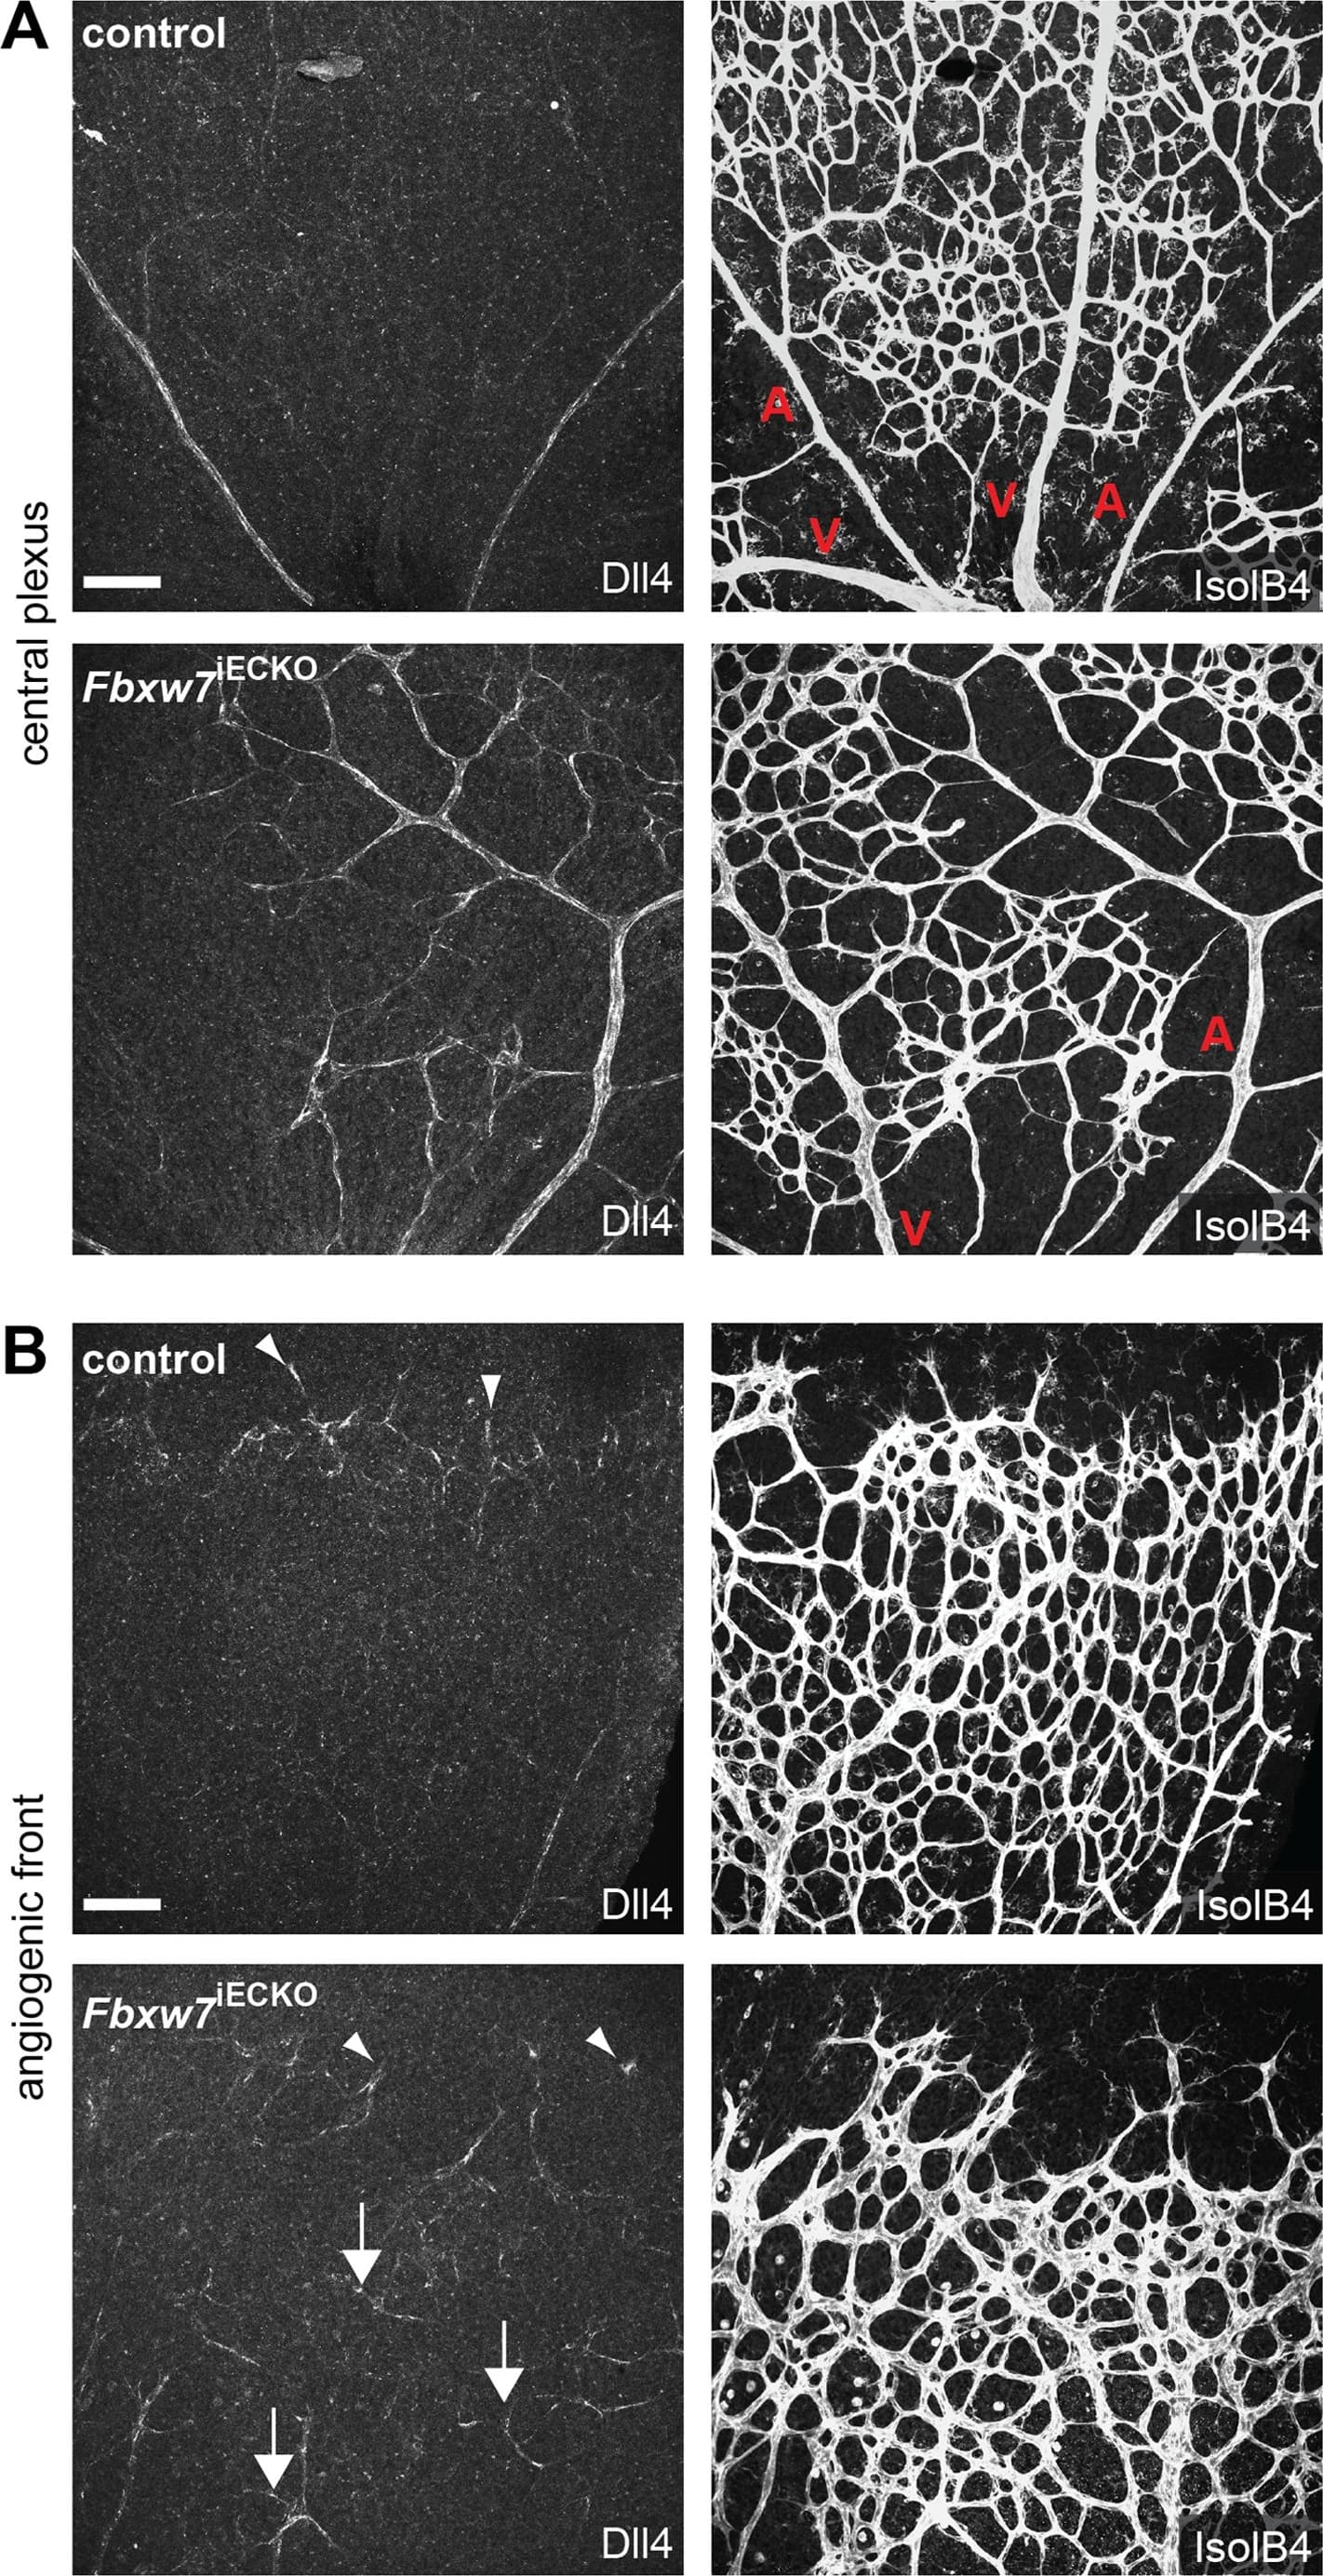
Targeting of Fbxw7 induced the upregulation of Dll4 expression.Anti-Dll4 and Isolectin B4 (IsolB4)-stained retinal whole-mounts of Fbxw7iECKO and littermate control retinas, as indicated (A, B). Arrowheads in (B) mark Dll4+ peripheral sprouts at the edge of the growing plexus, arrows indicate upregulated Dll4 in Fbxw7iECKO retinal capillaries. Quantitative analysis (with Volocity 5; n = 3 for each group) of image data confirmed elevated Dll4 levels (number of pixels) in the mutant endothelium (C). Likewise, quantitative RT-PCR analysis showed reduced Fbxw7 expression but upregulated Dll4 transcript levels in P6 Fbxw7iECKO lungs (D). Expression of the Cdh5 gene was used for normalization. Error bars indicate SEM. P values are indicated as ** (<0.001) and * (p<0.05). Scale bars are 100 µm. Image collected and cropped by CiteAb from the following open publication (https://pubmed.ncbi.nlm.nih.gov/22848434), licensed under a CC-BY license. Not internally tested by R&D Systems.
Detection of Mouse Mouse DLL4 Antibody by Immunohistochemistry-Frozen
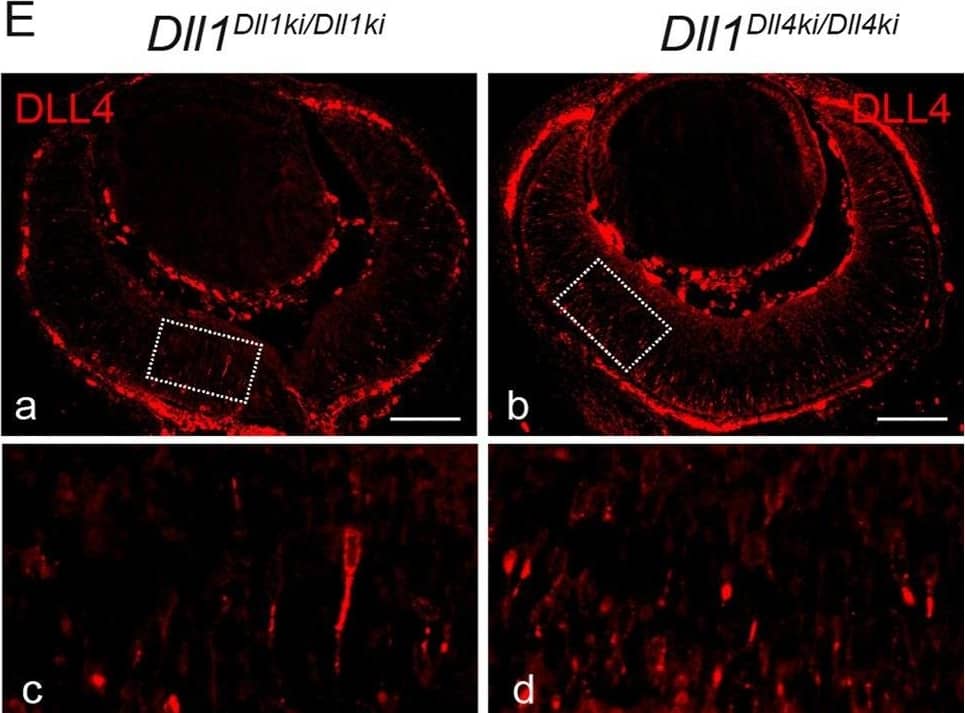
DLL4 expressed from the Dll1 locus rescues DLL1 loss-of-function in the retina.(A)Dll1 null mutant retinas show epithelial disruption with formation of polarised rosettes in which the apical markers N-Cadherin (NCad, a) and ZO-1 (ZO1, b) are abnormally present at the central lumen. Ectopic proliferating progenitors, labelled with PHH3 (b, arrowheads), are located close to the apical lumen of these rosettes. (B) In contrast, the neuroepithelium of homozygous Dll1Dll1ki and Dll1Dll4ki embryos is correctly organised without rosettes, and N-Cadherin shows the normal apical localisation close to the retinal pigmented epithelium (a,b). Mitotic progenitors (PHH3+) are only detected at the apical region of the neuroepithelium (a,b arrowheads). A normal stratification of CHX10+ progenitors and P27+ differentiating neurons is also observed (c,d). (C, D) E13.5 homozygous Dll1Dll1ki and Dll1Dll4ki retinas show no significant difference in the number of ISL1+ RGCs (C) and CRABP+ amacrine cells (D). Cells immunopositive for Islet-1 and Crabp were counted and related to the total number of cells in the retina (DAPI+). Percentages are shown as mean ± SEM; ns, not significant. (E) Expression of DLL4 in homozygous Dll1Dll1ki (a,c) and in homozygous Dll1Dll4ki (b,d) E13.5 retinas as detected by an anti-DLL4 antibody. (c) and (d) are magnifications of (a) and (b), respectively. Endogenous plus transgenic DLL4 is expressed in more cells in Dll1Dll4ki/Dll4ki as compared to endogenous DLL4 expression in Dll1Dll1ki/Dll1ki while signal strength is similar. Scale bars are 50 μm in (A, B) and 100 μm in (E). Image collected and cropped by CiteAb from the following publication (https://pubmed.ncbi.nlm.nih.gov/26114479), licensed under a CC-BY license. Not internally tested by R&D Systems.
Detection of Mouse DLL4 by Immunohistochemistry
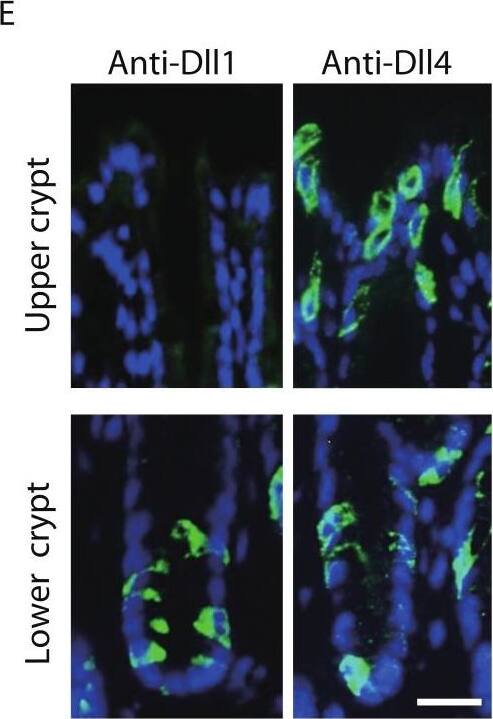
Dll1 and Dll4 are expressed in distinct patterns in the mice gastrointestinal epithelium.Immunohistochemistry of Dll1 and Dll4 were performed using mice small intestinal (A, B) and colonic tissues (D, E). Within the small intestinal epithelium, staining by anti-Dll1 antibody showed positive cells exclusively within the crypt (A, B), whereas staining by anti-Dll4 antibody showed positive cells both in the crypt and in the villi. Quantification of Dll1+ve and Dll4+ve intestinal epithelial cells (IECs) showed that Dll1+ve IECs are predominantly found within the crypt, whereas Dll4+ve IECs are found mostly in the villi (C). In the colonic epithelium, staining by anti-Dll1 antibody showed positive cells exclusively within the lower part of the crypt (D, E), whereas staining by anti-Dll4 antibody showed positive cells both in the lower- and upper part of the crypt, including the surface epithelium. Quantification of Dll1+ve and Dll4+ve IECs showed that Dll1+ve IECs are found exclusively within the lower half of the crypt, whereas Dll4+ve IECs are found both in the lower and upper region of the crypt at a comparable frequency (F). Negative staining of non-immunized isotype antibodies (Control Ab) confirmed the specific staining of Dll1 (A) and Dll4 (D). Scale bar represents 20 µm. Quantitative data are shown as mean ∓ SD of triplicate experiments (n = 3). ∗ indicates P < 0.05 as determined by Welch’s t-test. N.S. indicates not significant. Image collected and cropped by CiteAb from the following open publication (https://pubmed.ncbi.nlm.nih.gov/24860699), licensed under a CC-BY license. Not internally tested by R&D Systems.
Detection of Mouse DLL4 by Immunohistochemistry
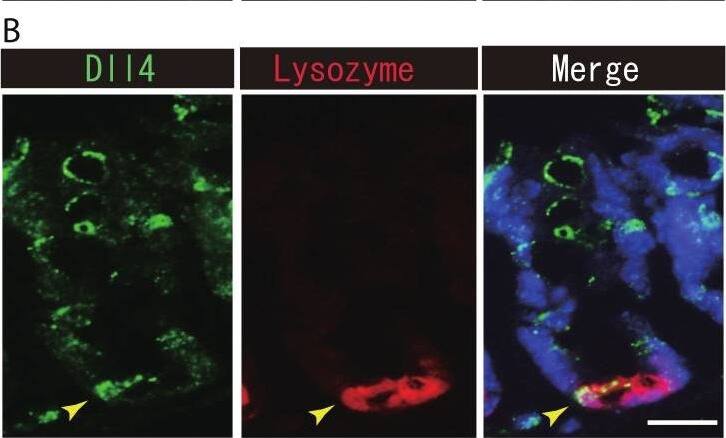
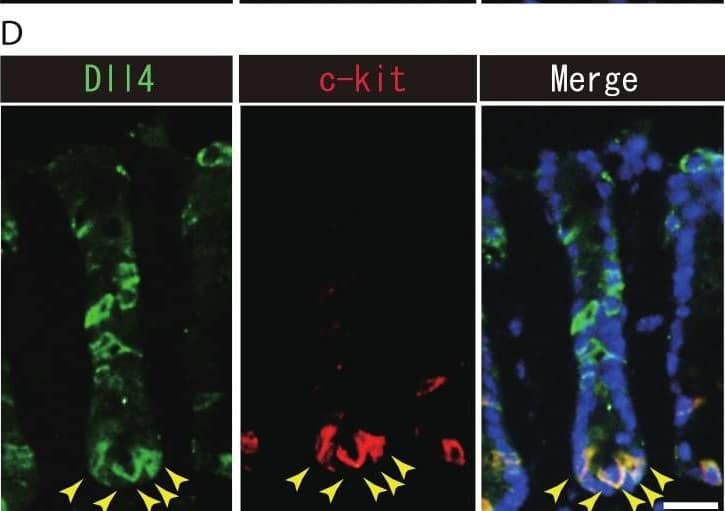
Dll1+ve or Dll4+ve IECs constitute the intestinal stem cell niche.Double immunostaining of Dll1 or Dll4 with a stem-cell niche cell marker, Lysozyme or c-kit, was performed in the mice small intestine and in the colon, respectively. (A) Immunostaining of Dll4 (green) with Lysozyme (red) shows that Dll4 is expressed in Paneth cells of the small intestine (yellow arrowhead). Scale bar represents 20 µm. (B) Double immunostaining of Dll1 (green) and c-kit (red) shows that Dll1+ve colonic IECs mostly co-express c-kit (yellow arrowhead). Also, double immunostaining of Dll4 (green) and c-kit (red) showed that a distinct population of Dll4+ve cells co-express c-kit (yellow arrowhead). Scale bar represents 20 µm. Image collected and cropped by CiteAb from the following open publication (https://pubmed.ncbi.nlm.nih.gov/24860699), licensed under a CC-BY license. Not internally tested by R&D Systems.


