Mouse EphB4 Antibody
R&D Systems, part of Bio-Techne | Catalog # AF446


Key Product Details
Validated by
Biological Validation
Species Reactivity
Validated:
Mouse
Cited:
Human, Mouse, Rat, Fish - Danio rerio (Zebrafish), Primate - Chlorocebus aethiops (African Green Monkey)
Applications
Validated:
CyTOF-ready, Flow Cytometry, Immunohistochemistry, Western Blot
Cited:
Bioassay, Flow Cytometry, Immunofluorescence, Immunohistochemistry, Immunohistochemistry-Frozen, Immunohistochemistry-Paraffin, Immunoprecipitation, Western Blot
Label
Unconjugated
Antibody Source
Polyclonal Goat IgG
Product Specifications
Immunogen
Mouse myeloma cell line NS0-derived recombinant mouse EphB4
Leu16-Ala539
Accession # P54761
Leu16-Ala539
Accession # P54761
Specificity
Detects mouse EphB4 in direct ELISAs and Western blots. In direct ELISAs, approximately 5% cross-reactivity with recombinant mouse (rm) EphB6 and rmEphA3 is observed and less than 1% cross-reactivity with rmEphA2, rmEphA4, rmEphA6, rmEphA7, rmEphA8, rmEphB2, and rmEphB3 is observed.
Clonality
Polyclonal
Host
Goat
Isotype
IgG
Scientific Data Images for Mouse EphB4 Antibody
EphB4 in Mouse Embryo.
EphB4 was detected in immersion fixed frozen sections of mouse embryo (15 d.p.c.) using Goat Anti-Mouse EphB4 Antigen Affinity-purified Polyclonal Antibody (Catalog # AF446) at 15 µg/mL overnight at 4 °C. Tissue was stained using the Anti-Goat HRP-DAB Cell & Tissue Staining Kit (brown; Catalog # CTS008) and counterstained with hematoxylin (blue). View our protocol for Chromogenic IHC Staining of Frozen Tissue Sections.Detection of Mouse EphB4 by Western Blot
Reduced Eph-B4 activity increases venous neointimal thickening. (A) Representative photomicrographs (left panel) and bar graph (right panel) showing AVF venous limb wall thickness in control and Eph-B4 het mice (day 21); *P = 0.047 (t-test). n = 8. Scale bar 25 µm. (B) Line graph showing infrarenal IVC diameter in control or Eph-B4 het mice; *P = 0.59 (ANOVA). n = 8–9. (C) Representative Western blot showing inhibited tyrosine phosphorylation in the Y774F-Eph-B4 mutant compared to the WT-Eph-B4 construct (0–60 min). (D) Bar graph showing Ephrin-B2/Fc stimulated COS cell migration after transfection with WT-Eph-B4 or Y774F-Eph-B4 plasmids. P < 0.0001 (ANOVA); *P < 0.0001 Ephrin-B2/Fc WT-Eph-B4 vs Y774F-Eph-B4. n = 3–4. (E) Representative photomicrographs (left panel) showing AVF venous wall (elastin stain) in control mice or mice treated with WT-Eph-B4 or mutant Y774F-Eph-B4. Arrow heads denote neointimal thickness. Scale bar, 25 µm. Bar graph (right panel) showing quantification of AVF venous wall thickness in control mice (white bar) or mice treated with WT-Eph-B4 (gray bar) or mutant Y774F-Eph-B4 (blue bar), day 21; P = 0.035 (ANOVA). *P = 0.038 (WT-Eph-B4 vs Y774F-Eph-B4; post hoc). n = 5–7. (F) Line graph showing infrarenal IVC diameter in mice with AVF treated with WT-Eph-B4 (gray line) or mutant Y774F-Eph-B4 (purple line) compared to control (black line); *P = 0.005 (ANOVA). n = 5–11. Data represent mean ± SEM. Image collected and cropped by CiteAb from the following open publication (https://pubmed.ncbi.nlm.nih.gov/29133876), licensed under a CC-BY license. Not internally tested by R&D Systems.Detection of Human EphB4 by Western Blot
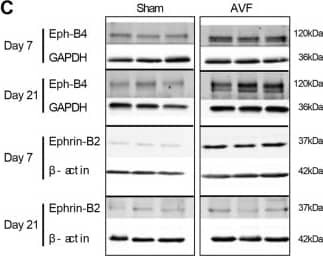
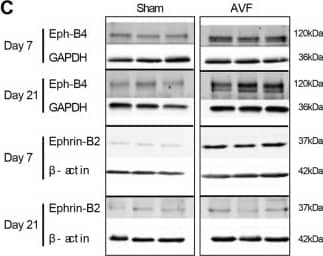
Increased Eph-B4 and Ephrin-B2 expression during adaptive venous remodeling. (A) Western blot and adjacent bar graph of densitometry showing human Eph-B4 expression in AVF venous limb compared to normal vein. *P = 0.0016; t-test. n = 3–4. (B) Line graphs show expression of Eph-B4 (blue) and Ephrin-B2 (red) in the AVF venous limb compared to sham IVC; P < 0.0001 (ANOVA). *P < 0.05 (P = 0.0123, Eph-B4; P = 0.0041, Ephrin-B2; post hoc); **P < 0.05 (P < 0.0001, Ephrin-B2; post hoc). n = 5–8. (C) Western blots showing Eph-B4 and Ephrin-B2 protein expression in AVF venous limb compared to sham IVC. n = 3–5. (D) Graphs showing densitometry of Eph-B4 (left panel) and Ephrin-B2 (right panel) expression in the AVF venous limb compared to sham IVC; *P < 0.05 (P < 0.0001, Eph-B4 day 7, AVF vs sham; P < 0.0001, Eph-B4 day 21, AVF vs sham; P < 0.0001, Ephrin-B2 day 7, AVF vs sham; post hoc). n = 3–5. (E) Diagram of rat model showing location of infrarenal IVC pericardial patch exposed to an aortocaval AVF (n = 6 per group). (F) Representative Western blot (upper panel) showing Eph-B4 and Ephrin-B2 expression in patch neointima (day 14) of control vein compared to patch neointima of AVF vein. Graphs (lower panel) show quantification of western blot bands; P < 0.0001 (ANOVA). *P < 0.05 (P = 0.0003, Eph-B4; P = 0.0043, Ephrin-B2; post hoc). n = 3. (G) Representative photomicrographs (upper panel) showing Eph-B4 (green) and Ephrin-B2 (red) immunoreactive signal (day 14). White arrowheads indicate colocalization of Eph-B4 and Ephrin-B2. L, vessel lumen. Graph (lower panel) shows quantification of immunoreactive signal; P < 0.0001 (ANOVA). *P < 0.05 (P = 0.0136 Eph-B4; P < 0.0001 Ephrin-B2; post hoc). n = 3. Scale bar 100 µm. Data represent mean ± SEM. Image collected and cropped by CiteAb from the following open publication (https://pubmed.ncbi.nlm.nih.gov/29133876), licensed under a CC-BY license. Not internally tested by R&D Systems.Applications for Mouse EphB4 Antibody
Application
Recommended Usage
CyTOF-ready
Ready to be labeled using established conjugation methods. No BSA or other carrier proteins that could interfere with conjugation.
Flow Cytometry
2.5 µg/106 cells
Sample: MCF-7 human breast cancer cell line
Sample: MCF-7 human breast cancer cell line
Immunohistochemistry
5-15 µg/mL
Sample: Immersion fixed frozen sections of mouse embryo (E13-15)
Sample: Immersion fixed frozen sections of mouse embryo (E13-15)
Western Blot
0.1 µg/mL
Sample: Recombinant Mouse EphB4 Fc Chimera (Catalog # 446-B4)
Sample: Recombinant Mouse EphB4 Fc Chimera (Catalog # 446-B4)
Reviewed Applications
Read 4 reviews rated 4.3 using AF446 in the following applications:
Formulation, Preparation, and Storage
Purification
Antigen Affinity-purified
Reconstitution
Reconstitute at 0.2 mg/mL in sterile PBS. For liquid material, refer to CoA for concentration.
Formulation
Lyophilized from a 0.2 μm filtered solution in PBS with Trehalose. *Small pack size (SP) is supplied either lyophilized or as a 0.2 µm filtered solution in PBS.
Shipping
Lyophilized product is shipped at ambient temperature. Liquid small pack size (-SP) is shipped with polar packs. Upon receipt, store immediately at the temperature recommended below.
Stability & Storage
Use a manual defrost freezer and avoid repeated freeze-thaw cycles.
- 12 months from date of receipt, -20 to -70 °C as supplied.
- 1 month, 2 to 8 °C under sterile conditions after reconstitution.
- 6 months, -20 to -70 °C under sterile conditions after reconstitution.
Background: EphB4
References
- Eph Nomenclature Committee [letter] (1997) Cell 90:403.
- Flanagan, J.G. and P. Vanderhaeghen (1998) Annu. Rev. Neurosci. 21:309.
- Pasquale, E.B. (1997) Curr. Opin. Cell Biol. 9:608.
Long Name
Eph Receptor B4
Alternate Names
Htk, Mdk2, Myk1, Tyro11
Gene Symbol
EPHB4
UniProt
Additional EphB4 Products
Product Documents for Mouse EphB4 Antibody
Product Specific Notices for Mouse EphB4 Antibody
For research use only
Loading...
Loading...
Loading...
Loading...
Loading...


