Detection of Mouse LRIG1 by Immunohistochemistry
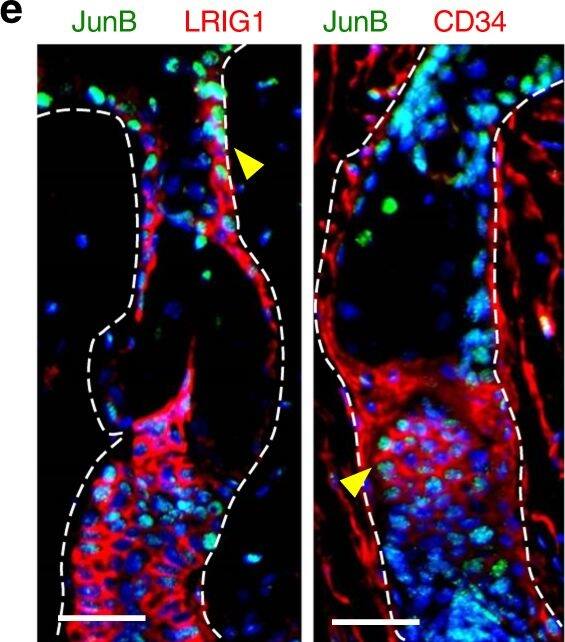
JunB expression during skin maturation and upon stress. a Representative microphotographs with double immunostaining for JunB (green) and FABP5 (red), indicative of sebaceous glands, in skin derived from 1, 3, and 5 days old mice. Inset showing magnified view of a sebaceous gland. Scale bars, 50 µm. b Immunostaining of JunB (green) and FABP5 (red) in 60 days old mice. Inset showing magnified view. c Representative microphotographs with double immunostaining of JunB (green) and FABP5 (red) in dorsal skin of 60 days old mice following hair plucking or d after topical TPA application, a potent inducer of proliferation. e Immunostaining of JunB (green) and LRIG1 or CD34 (red) in dorsal skin of 60 days old mice following hair plucking. f Immunostaining of JunB (green) and FABP5 (red) in adult human skin. E, epidermis; D, dermis; HF, hair follicle; SG, sebaceous gland; SD, sebaceous duct; HS, hair shaft. Asterisk indicates hair shaft autofluorescence. Dashed line indicates the epidermal-dermal junction. Scale bars, 50 µm Image collected and cropped by CiteAb from the following publication (https://pubmed.ncbi.nlm.nih.gov/30143626), licensed under a CC-BY license. Not internally tested by R&D Systems.
Detection of Mouse LRIG1 by Immunohistochemistry
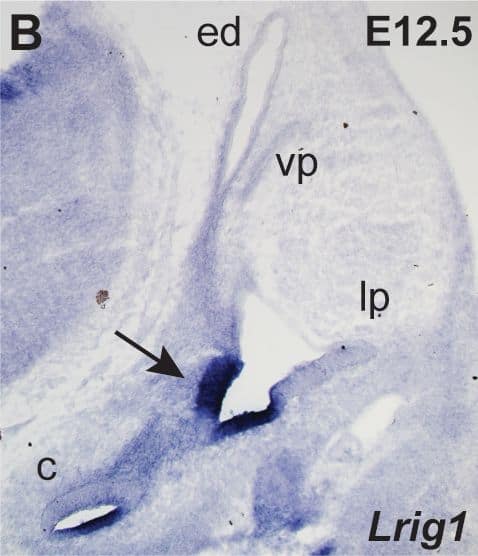
Lrigs are co-expressed in the embryonic inner ear.(A) Diagram of the immature inner ear structure at E12.5 (left) and the mature structure at E16 (right), with schematic cross sections cut transverse to the ear at each age shown below. For the E16 cross section, the sensory epithelia are labeled red and the neurons green. In situs for Lrig1 (B) and X-gal staining for Lrig3-beta geo activity (C) show overlapping expression for Lrig1 and Lrig3 in the atrium (arrowhead) and the non-sensory domain of the cochlea. On the other hand, Lrig2-beta geo is active throughout the developing otic epithelium (D). c = cochlea, ed = endolymphatic duct, lp = lateral pouch, vp = vertical pouch. Scale bar = 50 µm. Image collected and cropped by CiteAb from the following publication (https://pubmed.ncbi.nlm.nih.gov/24086156), licensed under a CC-BY license. Not internally tested by R&D Systems.
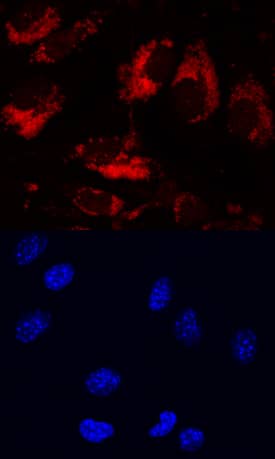
Detection of Mouse LRIG1 by Immunocytochemistry/Immunofluorescence
Lrig1 and Lrig2-beta geo are co-expressed in non-sensory tissues and in the vestibular ganglion.Transverse sections through Lrig2+/− tissue at E12.5 (A–C), E16.5 (D–G), and P15 (H–K) were double labeled with combinations of antibodies to Lrig1, beta-galactosidase (to detect Lrig2-beta geo), Sox2, and neurofilament (NF). (A) At E12.5, Lrig1 was detected in the atrium (bracket), while Lrig2-beta geo was present throughout the otic epithelium and surrounding mesenchyme (A″), overlapping with Lrig1 in the atrium (B). Within the atrium, Lrig1 was present in non-sensory tissues that flank Sox-2 positive sensory regions (arrowheads, C–C″). This expression was maintained at E16.5, with Lrig1 in the transitional epithelium adjacent to the utricular macula (arrowhead, D′) and in the extramacular epithelium of the saccule (arrowhead, F′), as well as in vestibular projections to the utricle and lateral crista (arrow, D′). Lrig2-beta geo, on the other hand, continued to be expressed broadly in both sensory and non-sensory portions of the vestibular organs at E16.5 (E′, G′). After the onset of hearing (P15), Lrig1 was expressed in NF-positive fibers innervating the utricular and saccular maculae (arrows, I, J), whereas Lrig2-beta geo was enriched in all vestibular sensory epithelia (I′,J′,K), which were recognized by the presence of NF labeled projections. c = crista, cd = cochlear duct, ed = endolymphatic duct, hb = hindbrain, lp = lateral pouch, sg = spiral ganglion, sm = saccular macula, um = utricular macule, vg = vestibular ganglion, vp = vertical pouch, VIIIV = vestibular division of the eighth cranial nerve. Scale bar = 40 µm. Image collected and cropped by CiteAb from the following publication (https://pubmed.ncbi.nlm.nih.gov/24086156), licensed under a CC-BY license. Not internally tested by R&D Systems.
Detection of Mouse LRIG1 by Immunocytochemistry/Immunofluorescence
Lrig1 and Lrig2-beta geo are co-expressed in the non-sensory region of the cochlea.Transverse sections through Lrig2+/− tissue at E12.5 (A), E16.5 (B), and P15 (C) were double labeled with antibodies to Lrig1, beta-galactosidase, and NF. (A) At E12.5, staining was evident in the non-sensory region of the cochlear epithelium (asterisk) and the mesenchyme surrounding the spiral ganglion. (B) At E16.5, Lrig1 was detected in the medial wall of the cochlea, which will form the inner sulcus and Reissner's membrane (asterisk). (C) At P15, Lrig1 was found in the base of Reissner's membrane (asterisk), with localization to the cell surface (inset). In contrast, at E12.5 and 16.5, Lrig2-beta geo was found broadly in the cochlear epithelium and surrounding mesenchyme (A′–B′). At P15, expression was enriched in spiral ganglion neurons and in the organ of Corti (C′). cd = cochlear duct, m = mesenchyme, oC = organ of Corti, rm = Reissner's membrane, sg = spiral ganglion. Scale bar = 40 µm. Image collected and cropped by CiteAb from the following publication (https://pubmed.ncbi.nlm.nih.gov/24086156), licensed under a CC-BY license. Not internally tested by R&D Systems.
Detection of Mouse LRIG1 by Immunocytochemistry/Immunofluorescence
Association of Oct1 with normal somatic stem cells.A. IF images of cross-sections from grossly uninvolved colon margins of a male familial adenomatous polyposis patient. Frozen sections were stained with mouse anti-Oct1 antibodies (Millipore MAB5434) and co-stained with TO-PRO. Crypts are shown in cross-section. White dashed circle highlights a crypt. Arrows indicate cells staining strongly for Oct1. B. IF images of colon crypt sections from a normal male individual. Sections were stained with DAPI, and anti-Oct1 and anti-ALDH1a1 antibodies. Merged images are shown at right. White dashed lines highlight crypts. Examples of cells co-staining with Oct1 and ALDH1a1 are highlighted with yellow arrows. An example cell staining with ALDH1a1 only is highlighted with an asterisk. Inset at lower right-hand corner is a digital magnification of the central portion of the image. Sections were formalin-fixed and paraffin-embedded. C. Frozen mouse colon tissue sections were stained with DAPI, and anti-Lrig1 and anti-Oct1 antibodies. IF images of longitudinal sections are shown. White dashed lines highlight the crypt. D. IF images of mouse small intestine sections. Sections were stained with DAPI and anti-Oct1 antibodies. Merged images are shown at right. White dashed lines highlight a crypt. Inset at upper right-hand corner is a digital magnification of the central portion of the image. Sections were formalin-fixed and paraffin-embedded. E. IF images of cross-sectional duodenum sections from a normal C57BL/6 mouse. Frozen sections were stained with DAPI and anti-Oct1 and anti-Lgr5 antibodies. Merged images are shown at right. Examples of co-staining cells are highlighted with yellow arrows. White dashed lines highlights crypts. F. Longitudinal sections. Image collected and cropped by CiteAb from the following publication (https://pubmed.ncbi.nlm.nih.gov/23144633), licensed under a CC-BY license. Not internally tested by R&D Systems.
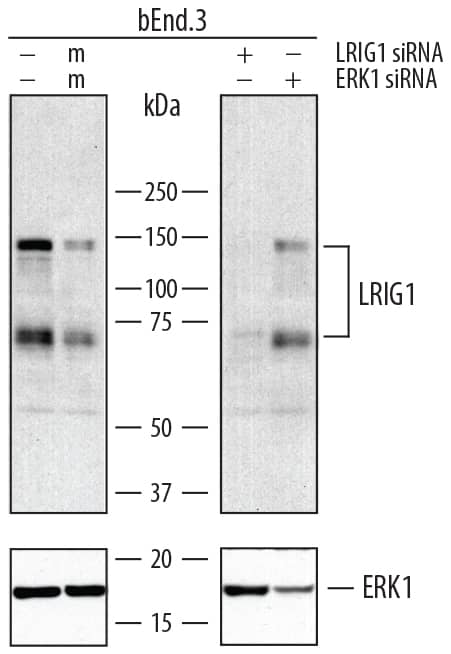
Detection of Mouse LRIG1 by Western Blot
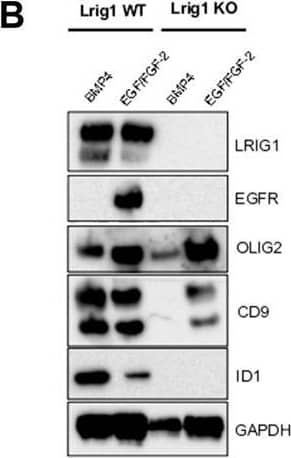
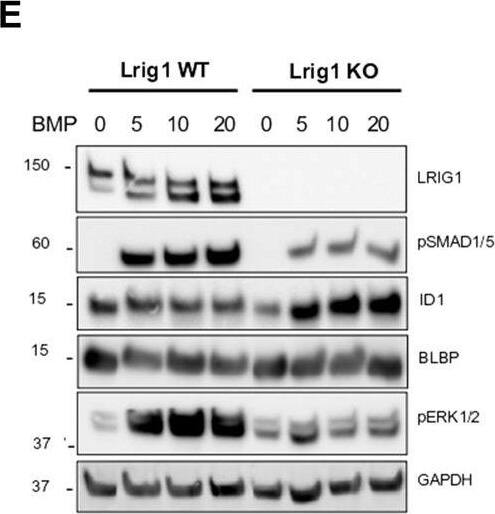
Lrig1 KO GSCs show impaired BMP signalling (A) Phase-contrast imaging of Lrig1 WT and Lrig1 KO GSCs treated with EGF/FGF or BMP4 for 3 days. (B) Immunoblot for LRIG1, EGFR, OLIG2, CD9, ID1 and GAPDH expression in Lrig1 WT and Lrig1 KO GSCs treated with EGF/FGF or BMP4 for 3 days. (C) Immunoblot and quantification for PCNA and GAPDH in Lrig1 WT and Lrig1 KO GSCs grown in EGF/FGF-2 or treated with 5 ng/ml or 10 ng/ml of BMP4 for 3 days. Quantification shown relative to GAPDH and Lrig1 WT EGF/FGF-2 control. (D) Immunoblot and quantification for MCM2 and GAPDH in Lrig1 WT and Lrig1 KO GSCs grown in EGF/FGF-2 or treated with 5 ng/ml or 10 ng/ml of BMP4 for 3 days. Quantification shown relative to GAPDH and Lrig1 WT EGF/FGF-2 control. (E) Immunoblot for LRIG1, pSMAD1/5, ID1, BLBP, pERK1/2 and GAPDH in Lrig1 WT and Lrig1 KO GSCs treated with different dosages of BMP4 for 3 days. Dosages in ng/ml. Protein band sizes shown in kDa. (F) Flow cytometry plots showing strategy to select Lrig1-positive cells in Lrig1 KO GSCs after reintroduction of mLrig1-FLAG. (G) Immunostaining for pSMAD1/5 (red) and nuclear counterstaining with DAPI (blue). +Lrig1-FLAG refer to the sorted populations. ICC was performed on Fucci PE Lrig1 WT, Fucci PE Lrig1 KO and the populations sorted for Lrig1-FLAG following expansion. (H) Quantification of the percentage of pSMAD 1/5 in the different conditions (n = 3) Unpaired two-tailed t-tests. Scale bar in (A) is 50 μm and (H) is 20 µm. Image collected and cropped by CiteAb from the following open publication (https://pubmed.ncbi.nlm.nih.gov/36420140), licensed under a CC-BY license. Not internally tested by R&D Systems.
Detection of Mouse LRIG1 by Western Blot
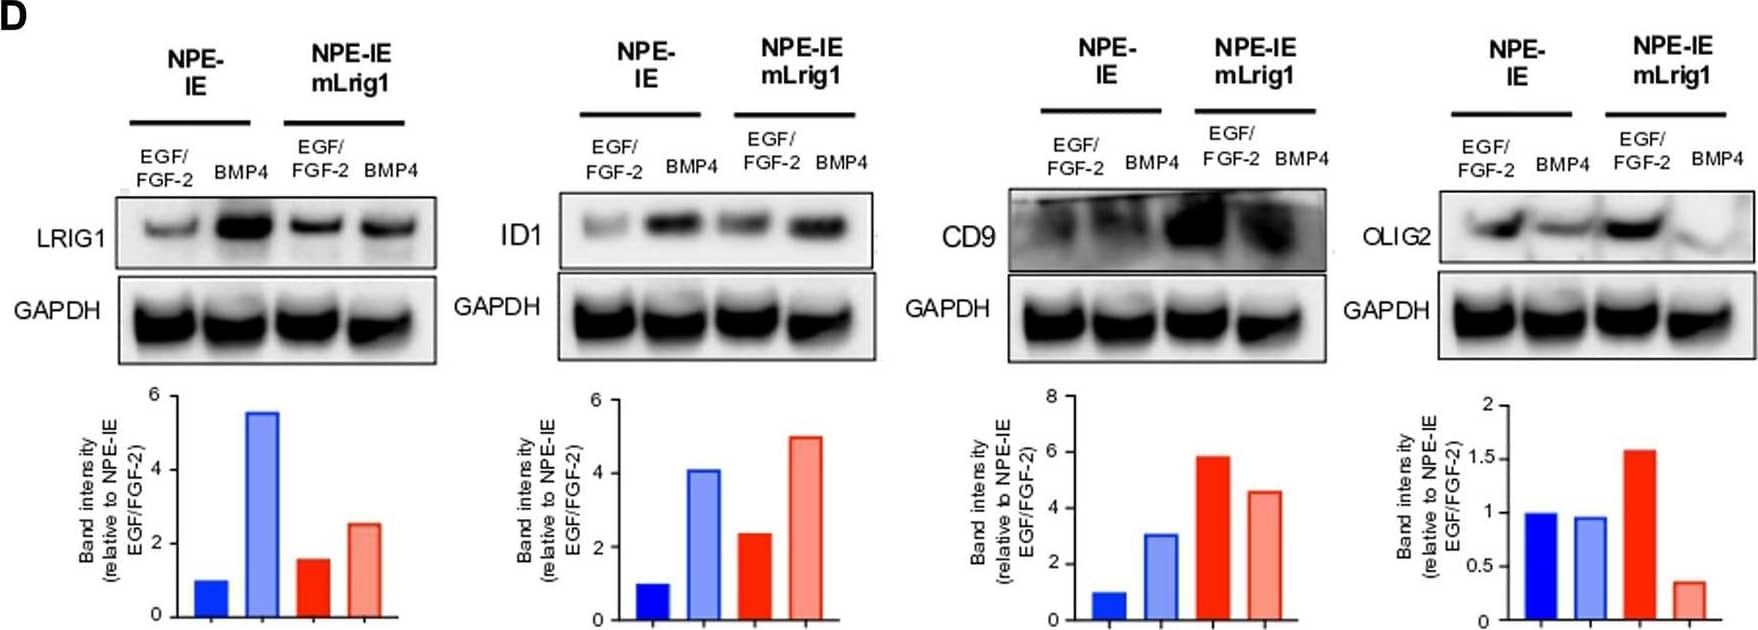
Overexpression of Lrig1 reduces GSC proliferation. (A) Representative fluorescence imaging of DAPI stained colonies using Operetta high-content analysis system for NPE-IE control and NPE-IE mLrig1 overexpressing cells. (B) Quantification of the number of colonies formed in single cell colony forming assays by NPE-IE control and NPE-IE mLrig1 overexpressing cells (n = 3) (C) Quantification of the size of colonies formed in single cell colony forming assays by NPE-IE control and NPE-IE mLrig1 overexpressing cells (n = 3) p = 0.0456. Each dot represents a single colony. (D) Immunoblot and quantification of LRIG1, OLIG2, ID1, CD9 and GAPDH (loading control) in NPE-IE control and NPE-IE mLrig1 overexpressing GSCs treated with EGF/FGF or BMP4 for 3 days. Quantification shown relative to GAPDH and NPE-IE EGF/FGF-2 control. Scale bar in (A) is 500 μm. Image collected and cropped by CiteAb from the following open publication (https://pubmed.ncbi.nlm.nih.gov/36420140), licensed under a CC-BY license. Not internally tested by R&D Systems.
Detection of Mouse LRIG1 by Western Blot
Lrig1 KO GSCs show impaired BMP signalling (A) Phase-contrast imaging of Lrig1 WT and Lrig1 KO GSCs treated with EGF/FGF or BMP4 for 3 days. (B) Immunoblot for LRIG1, EGFR, OLIG2, CD9, ID1 and GAPDH expression in Lrig1 WT and Lrig1 KO GSCs treated with EGF/FGF or BMP4 for 3 days. (C) Immunoblot and quantification for PCNA and GAPDH in Lrig1 WT and Lrig1 KO GSCs grown in EGF/FGF-2 or treated with 5 ng/ml or 10 ng/ml of BMP4 for 3 days. Quantification shown relative to GAPDH and Lrig1 WT EGF/FGF-2 control. (D) Immunoblot and quantification for MCM2 and GAPDH in Lrig1 WT and Lrig1 KO GSCs grown in EGF/FGF-2 or treated with 5 ng/ml or 10 ng/ml of BMP4 for 3 days. Quantification shown relative to GAPDH and Lrig1 WT EGF/FGF-2 control. (E) Immunoblot for LRIG1, pSMAD1/5, ID1, BLBP, pERK1/2 and GAPDH in Lrig1 WT and Lrig1 KO GSCs treated with different dosages of BMP4 for 3 days. Dosages in ng/ml. Protein band sizes shown in kDa. (F) Flow cytometry plots showing strategy to select Lrig1-positive cells in Lrig1 KO GSCs after reintroduction of mLrig1-FLAG. (G) Immunostaining for pSMAD1/5 (red) and nuclear counterstaining with DAPI (blue). +Lrig1-FLAG refer to the sorted populations. ICC was performed on Fucci PE Lrig1 WT, Fucci PE Lrig1 KO and the populations sorted for Lrig1-FLAG following expansion. (H) Quantification of the percentage of pSMAD 1/5 in the different conditions (n = 3) Unpaired two-tailed t-tests. Scale bar in (A) is 50 μm and (H) is 20 µm. Image collected and cropped by CiteAb from the following open publication (https://pubmed.ncbi.nlm.nih.gov/36420140), licensed under a CC-BY license. Not internally tested by R&D Systems.
Detection of Mouse LRIG1 by Flow Cytometry
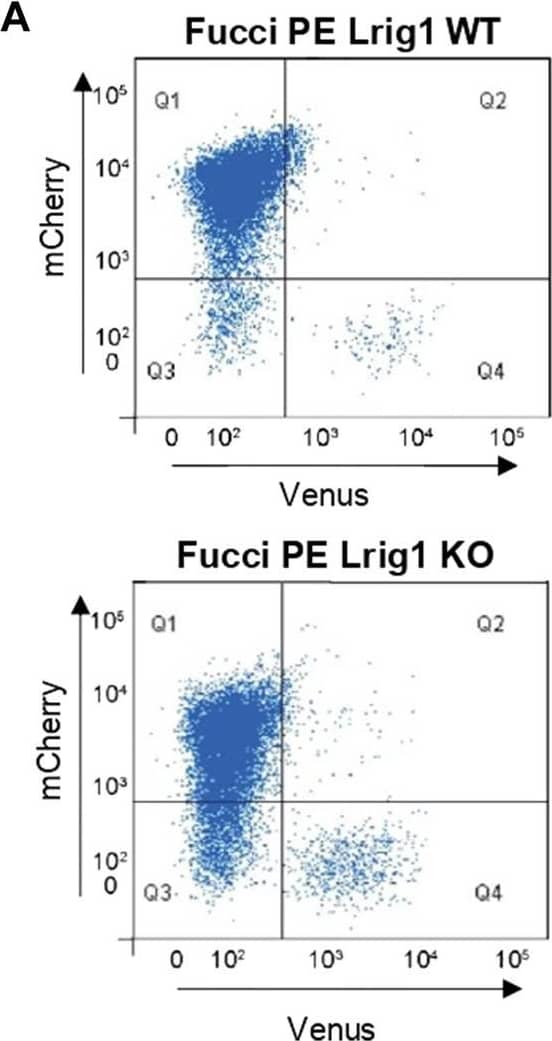
Lrig1 regulates proliferation of GSCs. (A) Flow analysis of Fucci mCherry-Cdt1 and aVenus-hGem reporters in Lrig1 WT and Lrig1 KO mouse GSCs. (n = 3). (B) Quantification of the number of colonies formed in single cell colony forming assays by Fucci NSCs, Fucci PE Lrig1 WT (GSCs with p53 KO and EGFRvIII overexpression) and Fucci PE Lrig1 KO. n = 3 (mean ± SD). (C) Quantification of the size of colonies formed in single cell colony forming assays by Fucci NSC, Fucci PE Lrig1 WT (GSCs with p53 KO and EGFRvIII overexpression) and Fucci PE Lrig1 KO as assessed by DAPI (n = 3 independent experiments, median ± SD, each dot represents a single colony). p value = 0.0456. (D) Representative fluorescence imaging of DAPI stained colonies using Operetta high-content analysis system. Scale bar in (D) is 1,500 μm. Image collected and cropped by CiteAb from the following open publication (https://pubmed.ncbi.nlm.nih.gov/36420140), licensed under a CC-BY license. Not internally tested by R&D Systems.

