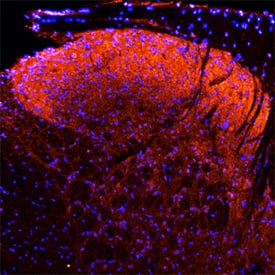
Neuropilin‑1 in Rat Spinal Cord.
Neuropilin-1 was detected in perfusion fixed frozen sections of rat spinal cord using Goat Anti-Rat Neuropilin-1 Antigen Affinity-purified Polyclonal Antibody (Catalog # AF566) at 15 µg/mL overnight at 4 °C. Tissue was stained using the NorthernLights™ 557-conjugated Anti-Goat IgG Secondary Antibody (red; Catalog #
NL001) and counter-stained with DAPI (blue). Specific staining was localized to the dorsal horn. View our protocol for Fluorescent IHC Staining of Frozen Tissue Sections.
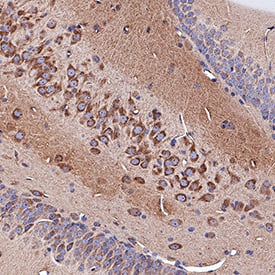
Neuropilin‑1 in Rat Brain.
Neuropilin-1 was detected in immersion fixed paraffin-embedded sections of rat brain (hippocampus) using Goat Anti-Mouse/Rat Neuropilin-1 Antigen Affinity-purified Polyclonal Antibody (Catalog # AF566) at 3 µg/mL for 1 hour at room temperature followed by incubation with the Anti-Goat IgG VisUCyte™ HRP Polymer Antibody (Catalog #
VC004). Tissue was stained using DAB (brown) and counterstained with hematoxylin (blue). Specific staining was localized to cytoplasm in neuronal cell bodies and projections. View our protocol for IHC Staining with VisUCyte HRP Polymer Detection Reagents.
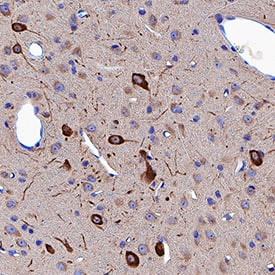
Neuropilin‑1 in Rat Brain.
Neuropilin-1 was detected in immersion fixed paraffin-embedded sections of rat brain (thalamus) using Goat Anti-Mouse/Rat Neuropilin-1 Antigen Affinity-purified Polyclonal Antibody (Catalog # AF566) at 3 µg/mL for 1 hour at room temperature followed by incubation with the Anti-Goat IgG VisUCyte™ HRP Polymer Antibody (Catalog #
VC004). Tissue was stained using DAB (brown) and counterstained with hematoxylin (blue). Specific staining was localized to cytoplasm in neuronal cell bodies and projections. View our protocol for IHC Staining with VisUCyte HRP Polymer Detection Reagents.
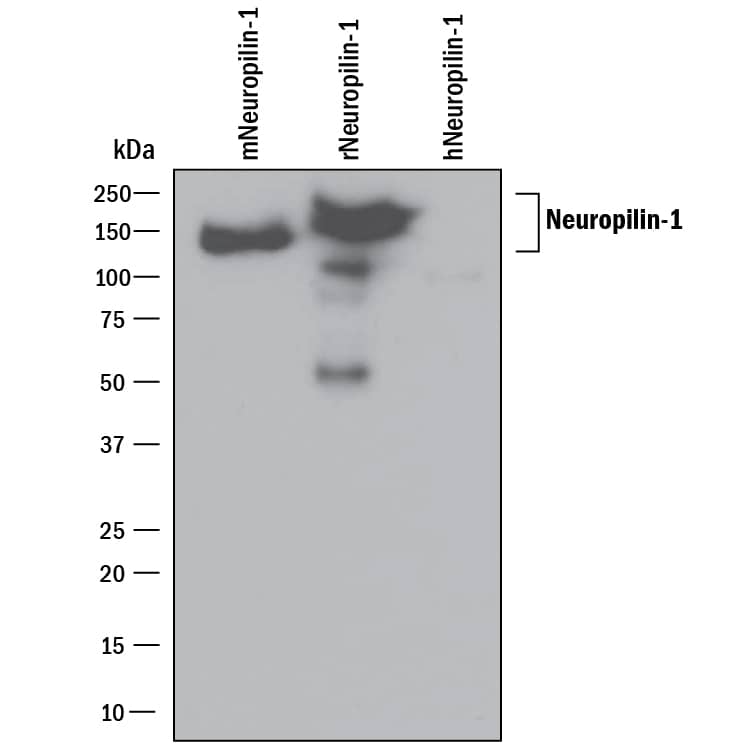
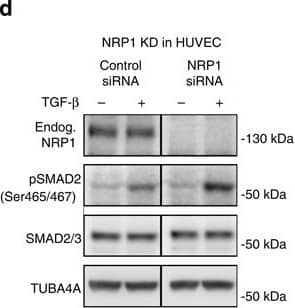
Detection of Mouse Neuropilin-1 by Western Blot
Nrp1 influences Smad2/3 activation.(a–c) Representative confocal images of wt sprouts from EBs immunolabelled for pSmad2. The outline of the wt sprouts is indicated with a dashed line using the endogenous DsRED marker. DAPI staining (not shown) was used to mark nuclei (blue line). Sprouts from (a) untreated EBs, (b) treated with 2 ng ml−1 Tgf-beta for 1 h and(c) treated with 10 μM SB-421543 for 4 h. Scale bar, 13 μm. (d,e) Western blot analysis of proteins from P4 HUVEC transfected with control siRNA and NRP1 siRNA, with or without stimulation with 2 ng ml−1 TGF-beta for 1 h. Full western blots are shown in Supplementary Fig. 10. A representative blot of six is shown; P=0.0012 NRP1 siRNA compared with control. (f,g) Proteins from P4 HUVEC transfected with control-GFP and NRP1–GFP–His construct for 24 h, with or without stimulation with 2 ng ml−1 TGF-beta for 1 h were assessed for SMAD2 phosphorylation. Full western blots are shown in Supplementary Fig. 11. A representative blot of four is shown; P=0.0017 NRP1 overexpression compared with control. (e,g) Quantification of pSMAD2 protein normalized to SMAD2/3. (h–k) Western blot analysis of proteins from P4 HUVEC transfected with control siRNA and NRP1 siRNA, with or without stimulation with 2 ng ml−1 TGF-beta for 1 h. Full western blots are shown in Supplementary Figs 12 and 13. (i) Quantification of pSMAD2 protein normalized to SMAD2/3; P=0.0848 Nrp1 siRNA compared with control. (k) Quantification of pSMAD3 protein normalized to SMAD3; P=0.0181 NRP1 siRNA compared with control. (l,m) Western blot analysis of P4 HUVEC transfected with control siRNA and NRP1 siRNA, with or without stimulation with 10 ng ml−1 BMP9 for 15 and 30 min. Full western blots are shown in Supplementary Fig. 14. A representative blot of four is shown. (m) Quantification of pSMAD2/3 protein normalized to SMAD2; P<0.0011 NRP1 siRNA compared with control. All values represent mean±s.e.m. DAPI, 4,6-diamidino-2-phenylindole; NS, not significant. Image collected and cropped by CiteAb from the following open publication (https://pubmed.ncbi.nlm.nih.gov/26081042), licensed under a CC-BY license. Not internally tested by R&D Systems.
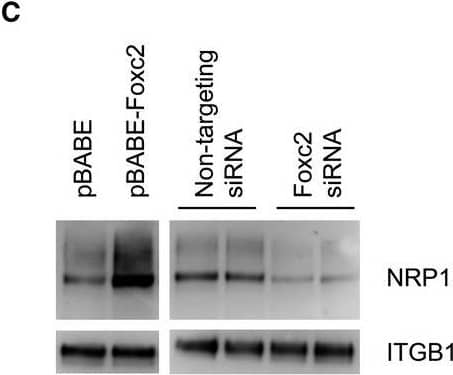
Detection of Mouse Neuropilin-1 by Western Blot
Expression of candidate genes. (A) qPCR analysis of relative mRNA levels in total RNA from isolated glomeruli of Foxc2fl/fl; Pod‐Cre+, Foxc2fl/+; Pod‐Cre+ and Foxc2fl/+ mice. Expression levels were normalized against the expression of Rplp0. (B) qPCR analysis of relative mRNA levels in total RNA from a podocyte cell line treated with either Foxc2 siRNA or non‐targeting siRNA. (C) Western blot analysis of NRP1 and ITGB1 protein expression after Foxc2 induction (pBABE‐Foxc2) or knockdown (Foxc2 siRNA). Empty vector (pBABE) and non‐targeting siRNA was used as controls. *P < 0.05 Foxc2fl/fl;Pod‐Cre+ versus Foxc2fl/+. Error bars in (A) and (B) represent SEM. Image collected and cropped by CiteAb from the following open publication (https://pubmed.ncbi.nlm.nih.gov/31062503), licensed under a CC-BY license. Not internally tested by R&D Systems.
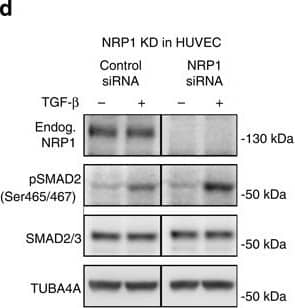
Detection of Mouse Neuropilin-1 by Western Blot
Nrp1 influences Smad2/3 activation.(a–c) Representative confocal images of wt sprouts from EBs immunolabelled for pSmad2. The outline of the wt sprouts is indicated with a dashed line using the endogenous DsRED marker. DAPI staining (not shown) was used to mark nuclei (blue line). Sprouts from (a) untreated EBs, (b) treated with 2 ng ml−1 Tgf-beta for 1 h and(c) treated with 10 μM SB-421543 for 4 h. Scale bar, 13 μm. (d,e) Western blot analysis of proteins from P4 HUVEC transfected with control siRNA and NRP1 siRNA, with or without stimulation with 2 ng ml−1 TGF-beta for 1 h. Full western blots are shown in Supplementary Fig. 10. A representative blot of six is shown; P=0.0012 NRP1 siRNA compared with control. (f,g) Proteins from P4 HUVEC transfected with control-GFP and NRP1–GFP–His construct for 24 h, with or without stimulation with 2 ng ml−1 TGF-beta for 1 h were assessed for SMAD2 phosphorylation. Full western blots are shown in Supplementary Fig. 11. A representative blot of four is shown; P=0.0017 NRP1 overexpression compared with control. (e,g) Quantification of pSMAD2 protein normalized to SMAD2/3. (h–k) Western blot analysis of proteins from P4 HUVEC transfected with control siRNA and NRP1 siRNA, with or without stimulation with 2 ng ml−1 TGF-beta for 1 h. Full western blots are shown in Supplementary Figs 12 and 13. (i) Quantification of pSMAD2 protein normalized to SMAD2/3; P=0.0848 Nrp1 siRNA compared with control. (k) Quantification of pSMAD3 protein normalized to SMAD3; P=0.0181 NRP1 siRNA compared with control. (l,m) Western blot analysis of P4 HUVEC transfected with control siRNA and NRP1 siRNA, with or without stimulation with 10 ng ml−1 BMP9 for 15 and 30 min. Full western blots are shown in Supplementary Fig. 14. A representative blot of four is shown. (m) Quantification of pSMAD2/3 protein normalized to SMAD2; P<0.0011 NRP1 siRNA compared with control. All values represent mean±s.e.m. DAPI, 4,6-diamidino-2-phenylindole; NS, not significant. Image collected and cropped by CiteAb from the following open publication (https://pubmed.ncbi.nlm.nih.gov/26081042), licensed under a CC-BY license. Not internally tested by R&D Systems.
Detection of Neuropilin-1 by Western Blot
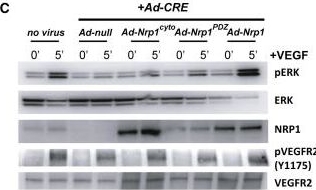
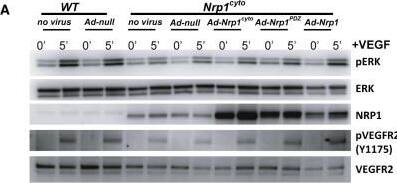
Rescue of VEGF-A Signaling in Nrp1cyto and Nrp1fl/fl Primary EC by Full-Length NRP1 and of EC Tubulogenesis following NRP1 siRNA Knockdown with Constitutively Active ERK(A and B) Western blot analysis of Nrp1cyto EC that were transduced with the indicated adenoviral constructs, serum-starved and stimulated with 50 ng/ml VEGF-A165. Blots (A) and quantitation of ERK activation (B) show that Ad-Nrp1, but not Ad-Nrp1cyto or Ad-Nrp1PDZ, restores VEGF-A-induced VEGFR2 and ERK activation in Nrp1cyto EC (mean ± SD, n = 3, *p < 0.05).(C and D) Western blot analysis of Nrp1fl/fl EC treated with adenoviral constructs expressing CRE recombinase to inactivate NRP1 were transduced with the indicated adenoviral constructs, serum-starved and stimulated with 50 ng/ml VEGF-A165. Blots (C) and quantitation (D) show that Ad-Nrp1, but not Ad-Nrp1cyto or Ad-Nrp1PDZ, restores the activation of VEGFR2 and ERK (mean ± SD, n = 3, *p < 0.05).(E and F) HUVEC treated with control or NRP1 siRNA were treated with the indicated adenoviral vectors to compare their capacity to undergo tube formation in 3D collagen matrices after 72 hr. Representative images (E) and quantification (F) of tubulogenesis after 72 hr (mean ± SEM, n = 18, *p < 0.05). Scale bar represents 100 um. Image collected and cropped by CiteAb from the following open publication (https://pubmed.ncbi.nlm.nih.gov/23639442), licensed under a CC-BY license. Not internally tested by R&D Systems.
Detection of Neuropilin-1 by Western Blot
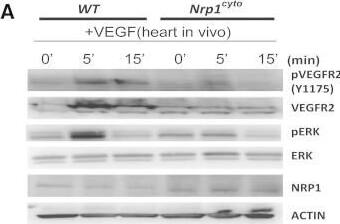
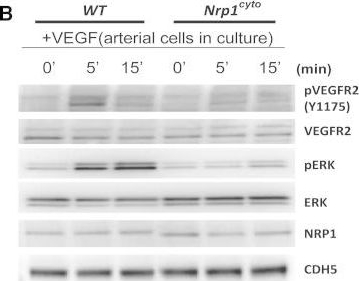
Impaired VEGF-A Signaling in Nrp1cyto Mice(A) Western blot analysis of heart lysates following intraperitoneal injection of VEGF-A. Blots show reduced ERK and VEGFR2 phosphorylation in Nrp1cyto mice relative to WT littermates.(B–D) Western blot analysis of cell lysates from primary arterial EC from Nrp1cyto and WT EC that were serum-starved and then stimulated for the indicated times with 50 ng/ml VEGF-A165. (B) Blots show reduced phosphorylation of VEGFR2 on Y1175 and of ERK in Nrp1cyto relative to control EC. (C) Quantification of the ratio of phospho-VEGFR2 (pVEGFR2) relative to total VEGFR2 (VEGFR2) (mean ± SD, n = 5, *p < 0.05). (D) Quantification of the ratio of phospho-ERK (pERK) relative to total ERK (ERK) (mean ± SD, n = 5, *p < 0.05).(E) Western blot analysis of cell lysates from Nrp1cyto and WT primary arterial EC that were serum-starved and stimulated for the indicated times with 50 ng/ml of FGF2 or IGF1. ERK phosphorylation was similar in Nrp1cyto and WT EC.See also Figure S4. Image collected and cropped by CiteAb from the following open publication (https://pubmed.ncbi.nlm.nih.gov/23639442), licensed under a CC-BY license. Not internally tested by R&D Systems.
Detection of Neuropilin-1 by Western Blot
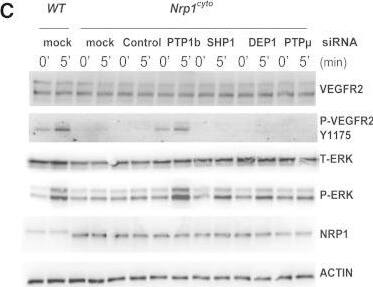
Rescue of Defective ERK Signaling in VEGF-A-Stimulated Nrp1cyto Arterial EC by Knockdown of PTP1bPrimary arterial EC from Nrp1cyto mice transfected with siRNA specific for the indicated phosphatases were serum-starved and then stimulated with 50 ng/ml VEGF-A165.(A and B) Knockdown of the indicated phosphatases in Nrp1cyto arterial EC shown by immunoblotting (A); PTP1b knockdown was quantified in (B), dashed line indicates normal expression levels.(C and D) ERK and VEGFR2 (Y1175) phosphorylation after knockdown of the indicated phosphatases shown by immunoblotting (C). Quantification of pERK activation is shown in (D) (n = 3, mean ± SD, *p < 0.05). Image collected and cropped by CiteAb from the following open publication (https://pubmed.ncbi.nlm.nih.gov/23639442), licensed under a CC-BY license. Not internally tested by R&D Systems.
Detection of Neuropilin-1 by Western Blot
Rescue of VEGF-A Signaling in Nrp1cyto and Nrp1fl/fl Primary EC by Full-Length NRP1 and of EC Tubulogenesis following NRP1 siRNA Knockdown with Constitutively Active ERK(A and B) Western blot analysis of Nrp1cyto EC that were transduced with the indicated adenoviral constructs, serum-starved and stimulated with 50 ng/ml VEGF-A165. Blots (A) and quantitation of ERK activation (B) show that Ad-Nrp1, but not Ad-Nrp1cyto or Ad-Nrp1PDZ, restores VEGF-A-induced VEGFR2 and ERK activation in Nrp1cyto EC (mean ± SD, n = 3, *p < 0.05).(C and D) Western blot analysis of Nrp1fl/fl EC treated with adenoviral constructs expressing CRE recombinase to inactivate NRP1 were transduced with the indicated adenoviral constructs, serum-starved and stimulated with 50 ng/ml VEGF-A165. Blots (C) and quantitation (D) show that Ad-Nrp1, but not Ad-Nrp1cyto or Ad-Nrp1PDZ, restores the activation of VEGFR2 and ERK (mean ± SD, n = 3, *p < 0.05).(E and F) HUVEC treated with control or NRP1 siRNA were treated with the indicated adenoviral vectors to compare their capacity to undergo tube formation in 3D collagen matrices after 72 hr. Representative images (E) and quantification (F) of tubulogenesis after 72 hr (mean ± SEM, n = 18, *p < 0.05). Scale bar represents 100 um. Image collected and cropped by CiteAb from the following open publication (https://pubmed.ncbi.nlm.nih.gov/23639442), licensed under a CC-BY license. Not internally tested by R&D Systems.

