Detection of Mouse Wnt-5a by Immunocytochemistry/ Immunofluorescence
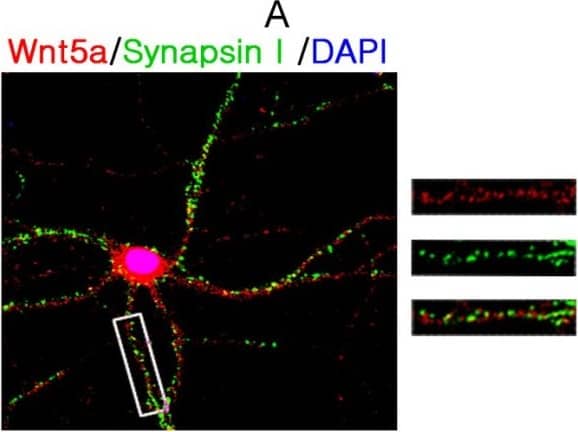
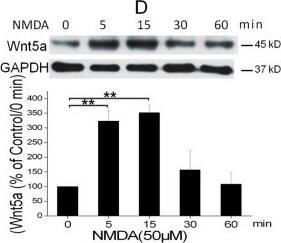
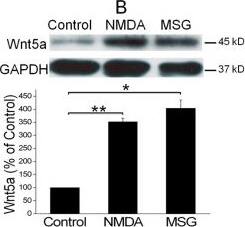
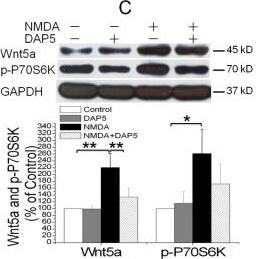
NMDAR activation rapidly increases Wnt5a in cortical cultures. A. Cellular localization of Wnt5a in neurons. Shown are confocal images of primary cortical neurons after double-fluorescent immunostaining with anti-Wnt5a (red) and anti-synapsin I (green) antibodies. The nucleus was stained by DAPI (blue). B. MSG or NMDA stimulation increased Wnt5a protein. Primary cortical neurons (10 DIV) were treated with 10 μΜ MSG or 50 μΜ NMDA for 15 min. Wnt5a protein was detected by Western blotting. Data in the summary graphs (mean ± SEM) were from three independent experiments (*, p < 0.05; **, p < 0.01; One-way ANOVA). C. NMDA receptor-regulated Wnt5a increase. Primary cortical neurons (10 DIV) were pre-treated with vehicle (Control) or 100 μΜ DAP5 for 30 min, then incubated with 50 μΜ NMDA for 15 min. Wnt5a and p-P70S6K(included as a marker for translation activation) were detected by Western blotting summarized in the graph (n = 3; *, p < 0.05; **, p < 0.01; One-way ANOVA). D. Dynamic expression of Wnt5a protein after NMDA stimulation. Primary cortical neurons (10 DIV) were treated with 50 μΜ NMDA for 0, 5, 15, 30 and 60 min followed by Western blotting analysis of Wnt5a (n = 3; *, P < 0.05; **, p < 0.01; One-way ANOVA). E. NMDA-induced Wnt5a protein secretion. Primary cortical neurons (10 DIV) were treated with 50 μΜ NMDA for 0, 2, 4, 8, 16 and 32 min, and Wnt5a protein in the media was concentrated and detected on immunoblots. Image collected and cropped by CiteAb from the following open publication (https://molecularbrain.biomedcentral.com/articles/10.1186/1756-6606-5-1), licensed under a CC-BY license. Not internally tested by R&D Systems.
Detection of Mouse Wnt-5a by Western Blot
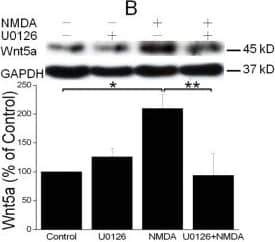
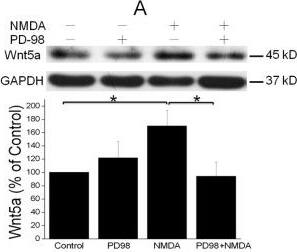
NMDAR activation stimulates Wnt5a protein synthesis via the MAPK signaling pathway. A. Primary cortical neurons (10 DIV) were pre-treated with vehicle (Control) or 20 μM PD98059 (PD98) for 30 min, and then stimulated with 50 μΜ NMDA for 15 min. Wnt5a protein was measured by Western blotting and quantified data were presented in graphs (mean ± SEM; n = 3, *p < 0.05; One-way ANOVA). B. Primary cortical neurons (10 DIV) were pre-treated with vehicle (Control) or 20 μM U0126 for 30 min, followed by 50 μΜ NMDA for 15 min. Graphs (mean ± SEM) are from three independent experiments (*, p < 0.05; **, p < 0.01; One-way ANOVA). Image collected and cropped by CiteAb from the following open publication (https://molecularbrain.biomedcentral.com/articles/10.1186/1756-6606-5-1), licensed under a CC-BY license. Not internally tested by R&D Systems.
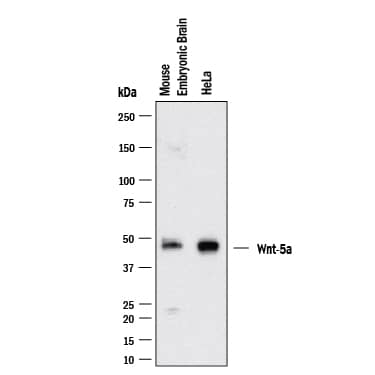
Detection of Human Wnt-5a by Western Blot
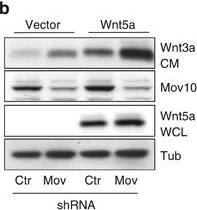
Inhibition of Mov10 increases Wnt5a secretion and Ror2-dependent cell invasion. (a) Wnt5a secretion in conditioned media (CM) from UACC903 melanoma cells compared with whole-cell lysate (WCL) from control and Mov10 shRNA-expressing cells. (b) Wnt5a secretion in UACC903 cells expressing a Wnt5a transgene. (c) Wnt3a secretion in UACC903 cells expressing a Wnt3a transgene. (d) Secretion of fibronectin (FN) from UACC903 cells expressing control and Mov10 shRNA. (e) Collagen invasion of WM239A melanoma cells expressing two Mov10 shRNA constructs. (f) Quantification of invasion assay in (a) Student's t-test, compared with shControl, shMov10-1 P=2.29 × 10⁻¹¹, shMov10-2 P=3.95 × 10⁻¹⁰. (g) Collagen invasion assay of cells expressing Ror2 shRNA and Mov10 shRNA (see Supplementary Figure S2). (h) Quantification of invasion assay in (d). Student's t-test, shMov10+shCtr vs shCtr P=3.07 × 10⁻¹¹, shMov10+shRor2-1 vs shMov10+shCtr P=9.02 × 10⁻¹⁰, shMov10+shRor2-2 vs shMov10+shCtr P=1.42 × 10⁻¹¹. Error bars indicate s.d. Image collected and cropped by CiteAb from the following open publication (https://www.nature.com/articles/oncsis201515), licensed under a CC-BY license. Not internally tested by R&D Systems.
Detection of Mouse Wnt-5a by Western Blot
NMDAR activation stimulates Wnt5a protein synthesis via the MAPK signaling pathway. A. Primary cortical neurons (10 DIV) were pre-treated with vehicle (Control) or 20 μM PD98059 (PD98) for 30 min, and then stimulated with 50 μΜ NMDA for 15 min. Wnt5a protein was measured by Western blotting and quantified data were presented in graphs (mean ± SEM; n = 3, *p < 0.05; One-way ANOVA). B. Primary cortical neurons (10 DIV) were pre-treated with vehicle (Control) or 20 μM U0126 for 30 min, followed by 50 μΜ NMDA for 15 min. Graphs (mean ± SEM) are from three independent experiments (*, p < 0.05; **, p < 0.01; One-way ANOVA). Image collected and cropped by CiteAb from the following open publication (https://molecularbrain.biomedcentral.com/articles/10.1186/1756-6606-5-1), licensed under a CC-BY license. Not internally tested by R&D Systems.
Detection of Mouse Wnt-5a by Western Blot
NMDAR activation rapidly increases Wnt5a in cortical cultures. A. Cellular localization of Wnt5a in neurons. Shown are confocal images of primary cortical neurons after double-fluorescent immunostaining with anti-Wnt5a (red) and anti-synapsin I (green) antibodies. The nucleus was stained by DAPI (blue). B. MSG or NMDA stimulation increased Wnt5a protein. Primary cortical neurons (10 DIV) were treated with 10 μΜ MSG or 50 μΜ NMDA for 15 min. Wnt5a protein was detected by Western blotting. Data in the summary graphs (mean ± SEM) were from three independent experiments (*, p < 0.05; **, p < 0.01; One-way ANOVA). C. NMDA receptor-regulated Wnt5a increase. Primary cortical neurons (10 DIV) were pre-treated with vehicle (Control) or 100 μΜ DAP5 for 30 min, then incubated with 50 μΜ NMDA for 15 min. Wnt5a and p-P70S6K(included as a marker for translation activation) were detected by Western blotting summarized in the graph (n = 3; *, p < 0.05; **, p < 0.01; One-way ANOVA). D. Dynamic expression of Wnt5a protein after NMDA stimulation. Primary cortical neurons (10 DIV) were treated with 50 μΜ NMDA for 0, 5, 15, 30 and 60 min followed by Western blotting analysis of Wnt5a (n = 3; *, P < 0.05; **, p < 0.01; One-way ANOVA). E. NMDA-induced Wnt5a protein secretion. Primary cortical neurons (10 DIV) were treated with 50 μΜ NMDA for 0, 2, 4, 8, 16 and 32 min, and Wnt5a protein in the media was concentrated and detected on immunoblots. Image collected and cropped by CiteAb from the following open publication (https://molecularbrain.biomedcentral.com/articles/10.1186/1756-6606-5-1), licensed under a CC-BY license. Not internally tested by R&D Systems.
Detection of Mouse Wnt-5a by Western Blot
NMDAR activation rapidly increases Wnt5a in cortical cultures. A. Cellular localization of Wnt5a in neurons. Shown are confocal images of primary cortical neurons after double-fluorescent immunostaining with anti-Wnt5a (red) and anti-synapsin I (green) antibodies. The nucleus was stained by DAPI (blue). B. MSG or NMDA stimulation increased Wnt5a protein. Primary cortical neurons (10 DIV) were treated with 10 μΜ MSG or 50 μΜ NMDA for 15 min. Wnt5a protein was detected by Western blotting. Data in the summary graphs (mean ± SEM) were from three independent experiments (*, p < 0.05; **, p < 0.01; One-way ANOVA). C. NMDA receptor-regulated Wnt5a increase. Primary cortical neurons (10 DIV) were pre-treated with vehicle (Control) or 100 μΜ DAP5 for 30 min, then incubated with 50 μΜ NMDA for 15 min. Wnt5a and p-P70S6K(included as a marker for translation activation) were detected by Western blotting summarized in the graph (n = 3; *, p < 0.05; **, p < 0.01; One-way ANOVA). D. Dynamic expression of Wnt5a protein after NMDA stimulation. Primary cortical neurons (10 DIV) were treated with 50 μΜ NMDA for 0, 5, 15, 30 and 60 min followed by Western blotting analysis of Wnt5a (n = 3; *, P < 0.05; **, p < 0.01; One-way ANOVA). E. NMDA-induced Wnt5a protein secretion. Primary cortical neurons (10 DIV) were treated with 50 μΜ NMDA for 0, 2, 4, 8, 16 and 32 min, and Wnt5a protein in the media was concentrated and detected on immunoblots. Image collected and cropped by CiteAb from the following open publication (https://molecularbrain.biomedcentral.com/articles/10.1186/1756-6606-5-1), licensed under a CC-BY license. Not internally tested by R&D Systems.
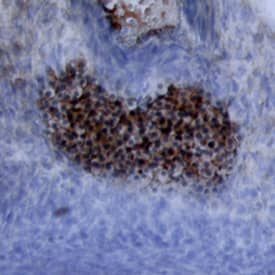
Detection of Mouse Wnt-5a by Immunohistochemistry
PGC depletion in Ror2 and Wnt5a mutants.(A–C) PGCs were visualized by wholemount SSEA1 immunostaining with SSEA1 antibody in e10.25 WT, Ror2, and Wnt5a embryos. (E–G) Gonadal ridges from e11.5 stained with GCNA, and (I–K) e12.5 male gonads stained with GCNA antibody. The caudal end is down in all images. (D, H, L) Quantification of PGCs in the entire e10.25 embryo, e11.5 and e12.5 gonads from confocal stacks, with individuals denoted as WT (diamond), Ror2Y324C mutants (triangle), and Wnt5a null (circle), and means indicated as bars. Consistent with appearances, a significant reduction of PGCs was observed in Wnt5a and from e11.5 onward in Ror2Y324C. We noted no significant difference in the number of PGCs between XX and XY gonads at e12.5 (not shown). Results of the Student's t-test are indicated, * p<0.05, **, p<0.01, ***p<0.001. Image collected and cropped by CiteAb from the following open publication (https://dx.plos.org/10.1371/journal.pgen.1002428), licensed under a CC-BY license. Not internally tested by R&D Systems.
Detection of Mouse Wnt-5a by Western Blot
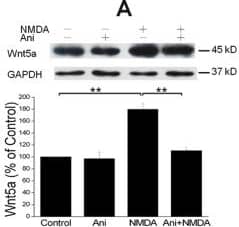
NMDAR-elicited Wnt5a increase requires translation but not transcription. A. Primary cortical neurons (10 DIV) were pre-treated with vehicle (Control) or 20 μΜ anisomycin for 30 min, and then incubated with 50 μΜ NMDA for 15 min, followed by Wnt5a immunoblotting. The Graph is a summary of three independent experiments (**, p < 0.01; One-way ANOVA). B. Primary cortical neurons (10 DIV) were pre-treated with vehicle (Control) or 20 μΜ actinomycin D for 30 min, followed by addition of 50 μΜ NMDA for 15 min. Wnt5a protein was detected by Western blotting and quantified. The Graph is a summary of four independent experiments (*, p < 0.05; **, p < 0.01; One-way ANOVA). C. Primary cortical neurons (10 DIV) were treated with vehicle (Control) or 50 μΜ NMDA for 15 min. Wnt5a mRNA was quantified by Real-time RT-PCR (qPCR). The summary graph is from three independent experiments (40 cycles, CT values: 25.1 ± 0.5/control vs. 25.6 ± 0.3/NMDA; p > 0.05; two-tailed Student's tests). D. Melt curve of Wnt5a qPCR on control cells. The melt curve on NMDA-stimulated cells was similar (not shown). E. RT-PCR results of Wnt5a in control and NMDA-treated cells. Image collected and cropped by CiteAb from the following open publication (https://molecularbrain.biomedcentral.com/articles/10.1186/1756-6606-5-1), licensed under a CC-BY license. Not internally tested by R&D Systems.
Detection of Mouse Wnt-5a by Western Blot
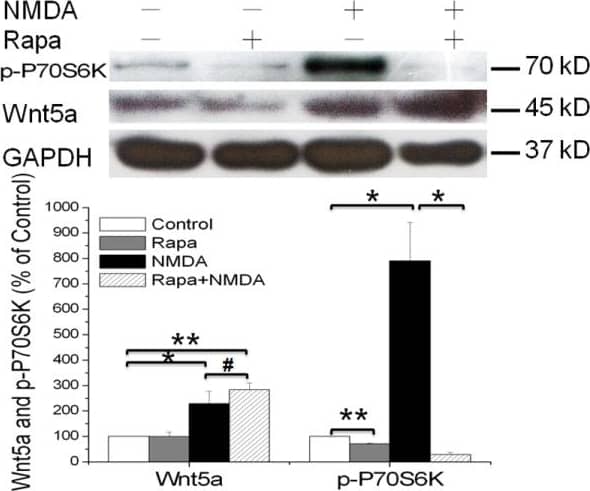
mTOR signaling pathway is not required for the NMDAR-dependent Wnt5a protein synthesis. Primary cortical neurons (10 DIV) were pre-treated with vehicle (Control) or 25nΜ Rapamycin for 30 min, followed by addition of 50 μΜ NMDA for 15 min. Western blotting analysis of Wnt5a and phosphor-P70S6K proteins were performed. Graphs (mean ± SEM) are from four independent experiments (*, p < 0.05; **, p < 0.01; #, p > 0.05; One-way ANOVA). Image collected and cropped by CiteAb from the following open publication (https://molecularbrain.biomedcentral.com/articles/10.1186/1756-6606-5-1), licensed under a CC-BY license. Not internally tested by R&D Systems.
Detection of Mouse Wnt-5a by Immunohistochemistry
PGC depletion in Ror2 and Wnt5a mutants.(A–C) PGCs were visualized by wholemount SSEA1 immunostaining with SSEA1 antibody in e10.25 WT, Ror2, and Wnt5a embryos. (E–G) Gonadal ridges from e11.5 stained with GCNA, and (I–K) e12.5 male gonads stained with GCNA antibody. The caudal end is down in all images. (D, H, L) Quantification of PGCs in the entire e10.25 embryo, e11.5 and e12.5 gonads from confocal stacks, with individuals denoted as WT (diamond), Ror2Y324C mutants (triangle), and Wnt5a null (circle), and means indicated as bars. Consistent with appearances, a significant reduction of PGCs was observed in Wnt5a and from e11.5 onward in Ror2Y324C. We noted no significant difference in the number of PGCs between XX and XY gonads at e12.5 (not shown). Results of the Student's t-test are indicated, * p<0.05, **, p<0.01, ***p<0.001. Image collected and cropped by CiteAb from the following open publication (https://dx.plos.org/10.1371/journal.pgen.1002428), licensed under a CC-BY license. Not internally tested by R&D Systems.


