Detection of Human VEGFR3/Flt-4 by Immunocytochemistry/Immunofluorescence
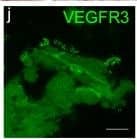
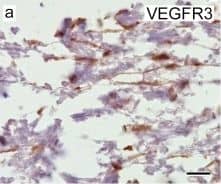
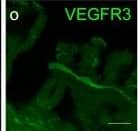
Cells of human meninges co-express LLEC markers. a–c DAB-IHC with single antibodies detects VEGFR3 (a), LYVE1 (b), and MRC1 (c) in the meninges of human post mortem brain showing no signs of neuropathology. These images are taken from a 38 year old male (sample P17/07, Table 1), and confirmed in n = 2 additional samples. P parenchyma. Scale = 150 µm (a); 40 µm (b); and 20 µm (c). d–f DAB-IHC with single antibodies detects VEGFR3 (b), LYVE1 (c), and MRC1 (d) in elderly human meninges (age: 89–92) with evidence of neuropathology and confirmed in n = 3 brains (Table 1). P, parenchyma. Scale = 20 µm. g–p IHC with fluorescent antibodies detects human meningeal cells that co-express MRC1 (h, m, yellow), LYVE1 (i, n, white), and VEGFR3 (j, o, green). Nuclei/RNA are labelled with DAPI (g, l, blue) and images are merged in (k, p). Scale = 10 µm Image collected and cropped by CiteAb from the following publication (https://pubmed.ncbi.nlm.nih.gov/31696318), licensed under a CC-BY license. Not internally tested by R&D Systems.
Detection of Mouse VEGFR3/Flt-4 by Immunocytochemistry/Immunofluorescence
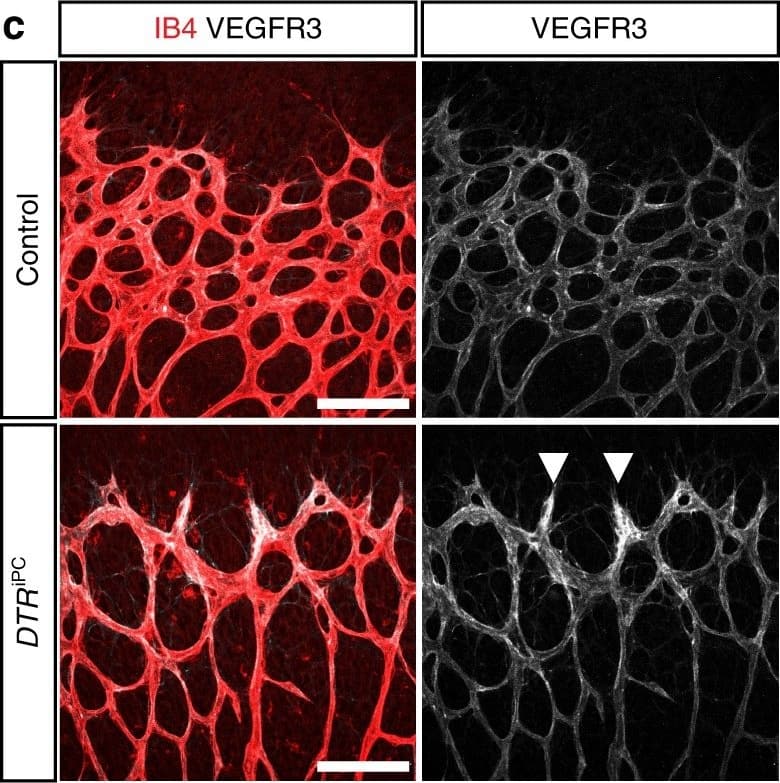
Endothelial changes after pericyte depletion. a–f Maximum intensity projection of confocal images from control and DTRiPC P6 retinas stained for IB4 (red) in combination with VEGF-A a, VEGFR2 b, VEGFR3 c, Tie2 d, Esm1 e, and Dll4 f (all in white), as indicated. Note local increase of VEGFR2, VEGFR3, and Esm1 (arrowheads in b, c, e) but not Tie2 or VEGF-A at the edge of the vessel plexus. Dll4 expression in DTRiPC sprouts is increased in some regions (arrowheads) but absent in others (arrows). Scale bar, 100 µm. g–j Quantitation of VEGF-A immunosignals area and intensity g, signal intensity for VEGFR2 h and VEGFR3 i and proportion of Esm1+ area with respect to vascular area j in the P6 control and DTRiPC angiogenic front. Error bars, s.e.m. p-values, Student’s t-test Image collected and cropped by CiteAb from the following publication (https://pubmed.ncbi.nlm.nih.gov/29146905), licensed under a CC-BY license. Not internally tested by R&D Systems.
Detection of Mouse VEGFR3/Flt-4 by Immunocytochemistry/Immunofluorescence
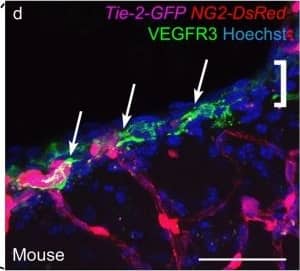
Cells with BLEC molecular markers are present within the mouse leptomeninges. a Coronal brain section of adult zebrafish brain indicating the imaging area in the dorsal optic tectum (TeO). b A 14 month old Tg(kdr-l:mCherry); Tg(flt4:mCitrine) double transgenic zebrafish has cells in the meninges (white bracket) that express flt4/vegfr3 ( alpha-GFP, green) near kdr-l positive ( alpha-RFP, red) blood vessels. DAPI (blue) labels the nuclei. Scale = 50 µm. c Coronal mouse brain section showing the imaging areas of the meninges. d As revealed by IHC, 17-week-old mouse brains express VEGFR3 (green) in the meninges (white bracket). Tie2-GFP;NG2-DsRed double reporter mice were used to distinguish arteries and veins. NG2 (red) labels pericytes and smooth muscle cells, Tie2 (magenta) labels vascular endothelial cells, and Hoechst (blue) stains nuclei. The image is rotated with the parenchyma at the bottom for ease of comparison with panel b. Scale = 50 µm. e-e′′′ As revealed by IHC, cells of the meninges co-express MRC1 (e, yellow), LYVE1 (e′, white), and VEGFR3 (e′′, green). Red arrows highlight cells expressing these three markers. The images are rotated with the parenchyma at the bottom. scale = 30 µm. f, g Quantification of the relative numbers of single and double-labelled cells in 2-month old mouse meninges. VEGFR3 and LYVE1 cell counts were from n = 2 brains, 3 coronal sections (10 area images)/brain. MRC1 and LYVE1 cell counts were from n = 3 brains, 3 coronal sections (4 area images)/brain. The mean values for each set are depicted Image collected and cropped by CiteAb from the following publication (https://pubmed.ncbi.nlm.nih.gov/31696318), licensed under a CC-BY license. Not internally tested by R&D Systems.
Detection of Human VEGFR3/Flt-4 by Immunocytochemistry/Immunofluorescence
Cells of human meninges co-express LLEC markers. a–c DAB-IHC with single antibodies detects VEGFR3 (a), LYVE1 (b), and MRC1 (c) in the meninges of human post mortem brain showing no signs of neuropathology. These images are taken from a 38 year old male (sample P17/07, Table 1), and confirmed in n = 2 additional samples. P parenchyma. Scale = 150 µm (a); 40 µm (b); and 20 µm (c). d–f DAB-IHC with single antibodies detects VEGFR3 (b), LYVE1 (c), and MRC1 (d) in elderly human meninges (age: 89–92) with evidence of neuropathology and confirmed in n = 3 brains (Table 1). P, parenchyma. Scale = 20 µm. g–p IHC with fluorescent antibodies detects human meningeal cells that co-express MRC1 (h, m, yellow), LYVE1 (i, n, white), and VEGFR3 (j, o, green). Nuclei/RNA are labelled with DAPI (g, l, blue) and images are merged in (k, p). Scale = 10 µm Image collected and cropped by CiteAb from the following publication (https://pubmed.ncbi.nlm.nih.gov/31696318), licensed under a CC-BY license. Not internally tested by R&D Systems.
Detection of Mouse VEGFR3/Flt-4 by Immunohistochemistry
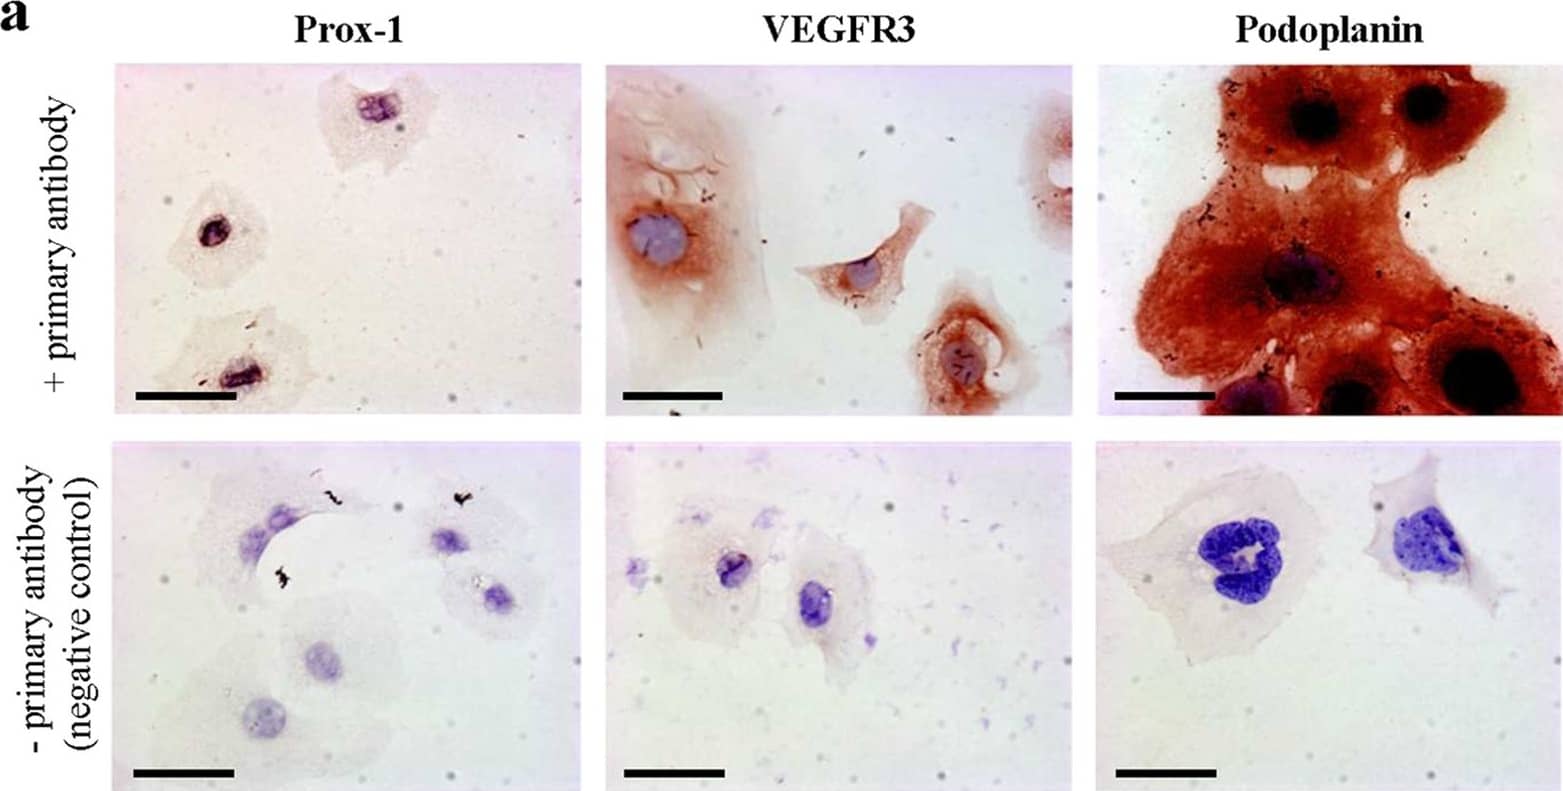
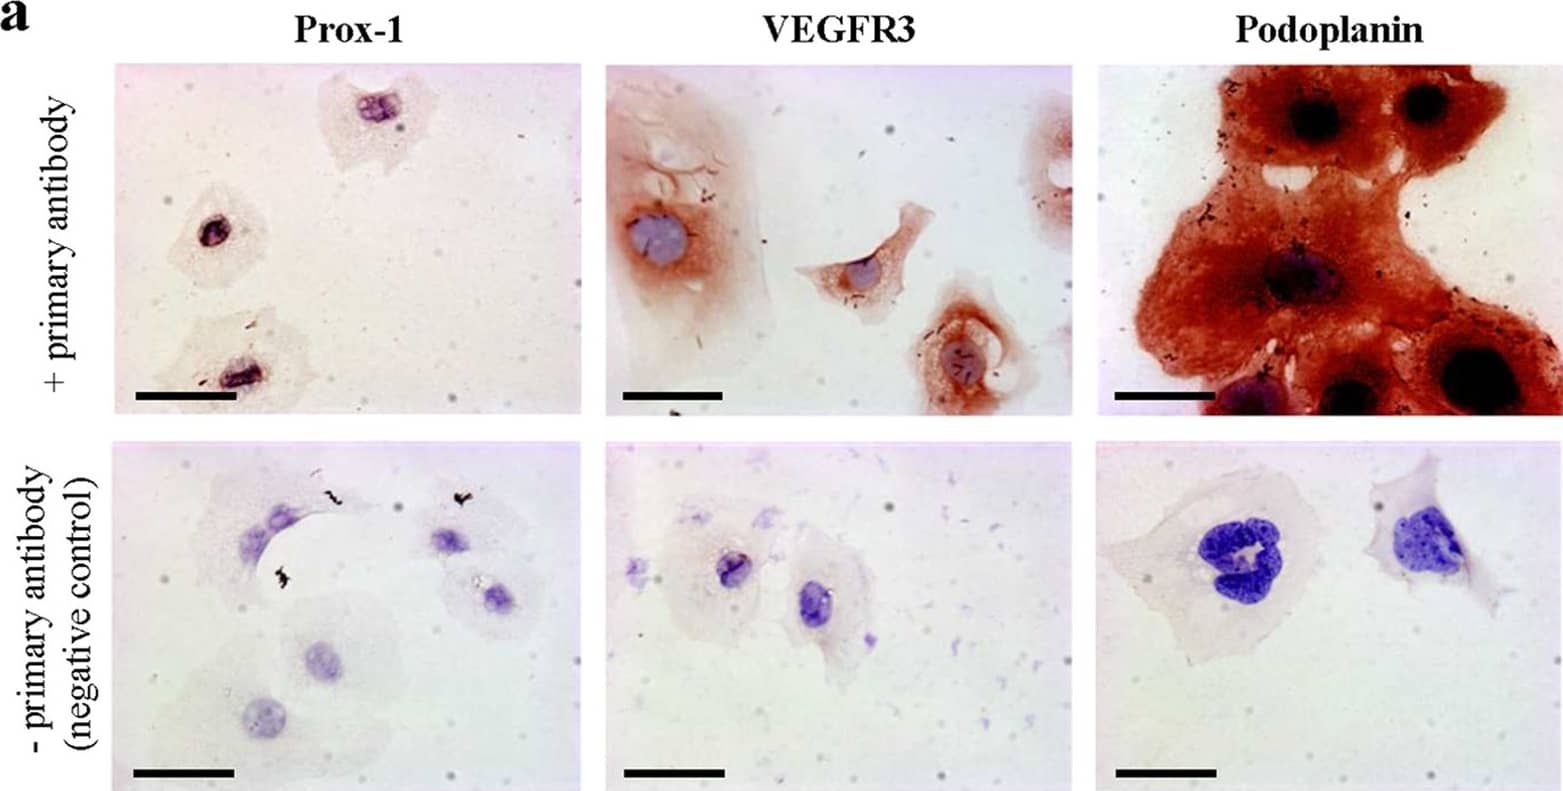
Cultured murine LECs express VDR.To check lymphatic origin of mouse LECs, we used three different well-established markers expressed by LECs. (a) Lymphatic origin of murine LECs was confirmed by IHC for Prox-1, VEGFR3 and Podoplanin (400x). Scale bar: 50 μm. (b) VDR expression of in vitro grown murine LECs was evaluated by western blot. Murine renal tubular epithelial cells (MTCs) served as positive control. (c) VDR expression of murine LECs was assessed by immunofluorescence (antibody D6) staining (200x). Scale bar: 50 μm. Image collected and cropped by CiteAb from the following publication (https://www.nature.com/articles/srep44403), licensed under a CC-BY license. Not internally tested by R&D Systems.
Detection of Mouse VEGFR3/Flt-4 by Immunohistochemistry
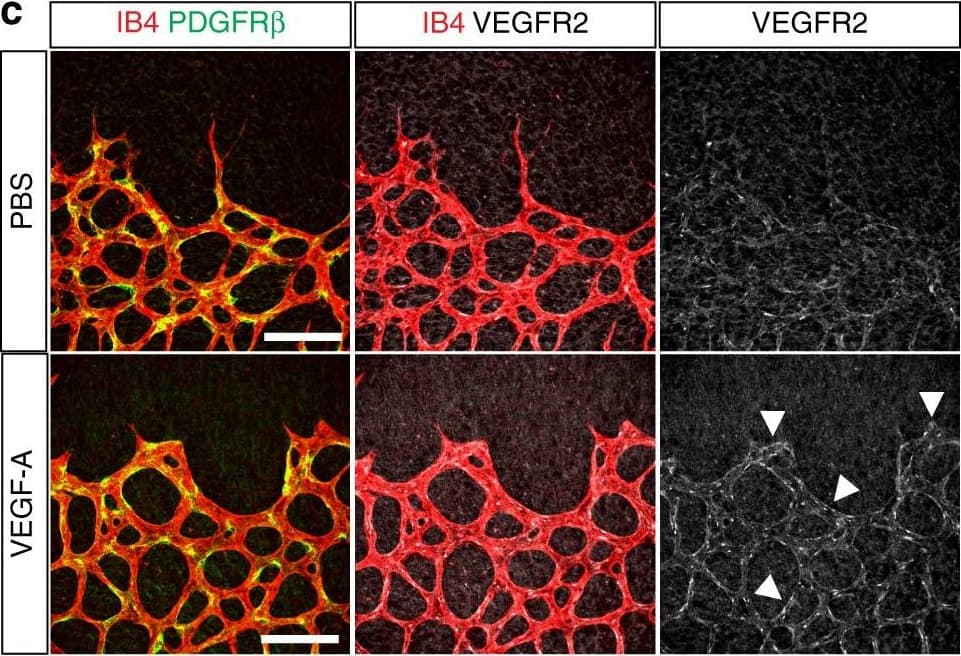
Vascular alterations after intraocular VEGF-A injection. a Morphology of IB4-stained P6 wild-type retinal vessels at 4 h after administration of human VEGF-A165 (0.5 µl at a concentration of 5 μg μl−1). Note blunt appearance of the vessel front after VEGF-A injection but not for vehicle (PBS) control. Scale bar, 200 µm. b Quantitation of sprouts and filopodia at the front of the P6 vessel plexus after injection of VEGF-A165 or vehicle control. Error bars, s.e.m. p-values, Student’s t-test. c PDGFR beta+ (green) pericytes are unaffected by short-term VEGF-A administration, whereas VEGFR2 immunosignals (white) are increased in IB4+ (red) ECs (arrowheads). Images shown correspond to insets in a. Scale bar, 100 µm. d Quantitation of VEGFR2 immunosignals intensity in the peripheral plexus of P6 retinas after injection of VEGF-A165 or vehicle control. Error bars, s.e.m. p-values, Student’s t-test. e Confocal images showing increased Esm1 immunostaining (white) in IB4+ (red) ECs in the peripheral plexus (arrowheads) after VEGF-A injection in P6 pups. Scale bar, 200 µm. f VEGF-A165 injection-mediated increase of Esm1 immunosignals (normalized to IB4+ EC area) in the peripheral capillary plexus but not at the edge of the angiogenic front in comparison to PBS-injected controls at P6. Error bars, s.e.m. p-values, Student’s t-test. NS, not statistically significant. g Short-term VEGF-A165 administration leads to clustering of Erg1+ (green) and IB4+ (red) ECs, as indicated, in thick sprout-like structures of P6 retinas. Panels in the center and on the right (scale bar, 20 µm) show higher magnification of the insets on the left (scale bar, 100 µm). Dashed lines in panels on the right outline IB4+ vessels. h Quantitation of EC density in the leading front vessel and emerging sprouts of the P6 angiogenic front after injection of VEGF-A165 or vehicle control. Error bars, s.e.m. p-values, Student’s t-test Image collected and cropped by CiteAb from the following publication (https://pubmed.ncbi.nlm.nih.gov/29146905), licensed under a CC-BY license. Not internally tested by R&D Systems.
Detection of Human VEGFR3/Flt-4 by Immunocytochemistry/Immunofluorescence
Cells of human meninges co-express LLEC markers. a–c DAB-IHC with single antibodies detects VEGFR3 (a), LYVE1 (b), and MRC1 (c) in the meninges of human post mortem brain showing no signs of neuropathology. These images are taken from a 38 year old male (sample P17/07, Table 1), and confirmed in n = 2 additional samples. P parenchyma. Scale = 150 µm (a); 40 µm (b); and 20 µm (c). d–f DAB-IHC with single antibodies detects VEGFR3 (b), LYVE1 (c), and MRC1 (d) in elderly human meninges (age: 89–92) with evidence of neuropathology and confirmed in n = 3 brains (Table 1). P, parenchyma. Scale = 20 µm. g–p IHC with fluorescent antibodies detects human meningeal cells that co-express MRC1 (h, m, yellow), LYVE1 (i, n, white), and VEGFR3 (j, o, green). Nuclei/RNA are labelled with DAPI (g, l, blue) and images are merged in (k, p). Scale = 10 µm Image collected and cropped by CiteAb from the following publication (https://pubmed.ncbi.nlm.nih.gov/31696318), licensed under a CC-BY license. Not internally tested by R&D Systems.
Detection of Mouse VEGFR3/Flt-4 by Immunohistochemistry
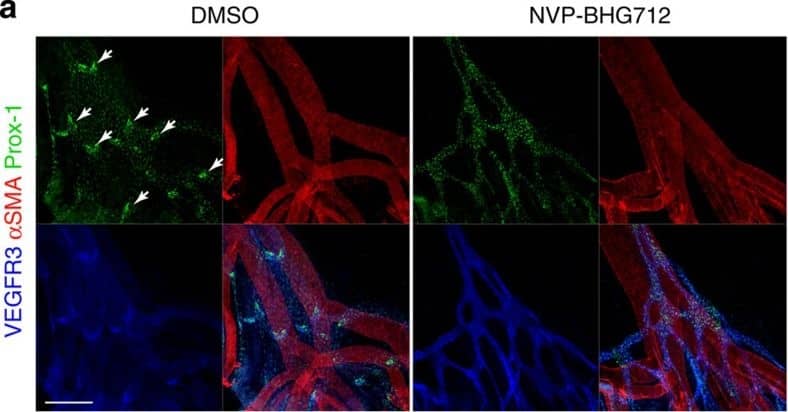
Kinase activity of EphB4 is required for lymphatic valve development.(a) Visualization of mesenteric lymphatic vessels and valves (arrows) by staining for Prox-1 and VEGFR3 2 days following treatment of P3 neonatal mice with NVP-BHG712, a selective EphB4 inhibitor. Blood vessels are highlighted by strong alpha-smooth muscle actin ( alphaSMA) staining. Scale bar, 200 μm. (b) Quantification of mesenteric lymphatic valves, ***P< 0.001 (two-tailed, unpaired student's t-test), n=3 per treatment group (error bars, s.d.). (c) NVP-BHG712 inhibits EphB4 phosphorylation in P2 neonatal mice. Lung tissue lysates were subjected to anti-EphB4 immunoprecipitation followed by anti-pY or anti-EphB4 immunoblotting. Ratios of pEphB4 to total EphB4 (pEphB4: EphB4) are graphed. *P<0.05 (two-tailed, unpaired student's t-test), n=4 per treatment group (error bars, s.d.). Image collected and cropped by CiteAb from the following publication (https://pubmed.ncbi.nlm.nih.gov/25865237), licensed under a CC-BY license. Not internally tested by R&D Systems.
Detection of Mouse VEGFR3/Flt-4 by Immunocytochemistry/Immunofluorescence
Mouse LLECs take up A beta 1-40. a Schematic showing the site of dye and A beta1-40 perfusion into the CSF via the cisterna magna (arrow) of a 2-month old mouse. The dotted line indicates the plane of section. A anterior, P posterior, D dorsal, V ventral. b Coronal brain section indicating the areas imaged. SF4 refers to area captured in Figure S4. c The percentage of each labelled cell type that internalized perfused A beta. Cells co-expressing VEGFR3 and LYVE1 take up A beta at a higher rate than MRC1, LYVE1 double-positive cells as well as MRC1-positive, LYVE1-negative cells (p ≤ 0.05, bootstrap). VEGFR3, LYVE1 counts, n = 2 brains (3 sections/brain). MRC1, LYVE1 counts, n = 3 brains (3 sections/brain). d–d′′′ Cells of the adult mouse meninges that co-express VEGFR3 (d, green) and LYVE1 (d′, white) internalize A beta1-40 (d′′, cyan). Scale = 20 µm. e-e′′′) Cells of the adult mouse meninges that co-express VEGFR3 (e, green) and MRC1 (e′, white) internalize A beta1-40 (e′′, cyan). Scale = 40 µm. f–f′′′) Cells of the adult mouse meninges that co-express MRC1 (f, magenta) and LYVE1 (f′, white) internalize A beta1-40 (f′′, cyan). The walls of a blood vessel (white arrowhead, f′′) also accumulate A beta1-40. Scale = 60 µm Image collected and cropped by CiteAb from the following publication (https://pubmed.ncbi.nlm.nih.gov/31696318), licensed under a CC-BY license. Not internally tested by R&D Systems.
Detection of Mouse Mouse VEGFR3/Flt-4 Antibody by Immunohistochemistry
YAP and TAZ are required for the maintenance of LVs. The lymphatic vessels in the dorsal skin of E16.5 and E18.5 control and Lyve1-Cre;Yapf/f;Tazf/f embryos were analyzed by whole-mount immunohistochemistry. (A,B) LVs were observed in the collecting lymphatic vessels of E16.5 control and Lyve1-Cre;Yapf/f;Tazf/f embryos (arrows). (C,D) The migrating front of E16.5 control (C) and Lyve1-Cre;Yapf/f;Tazf/f (D) embryos appeared comparable. (E-G) At E18.5, the lymphatic vessels from the left and right sides have merged to form a network in control embryos (E). In contrast, huge gaps were observed in between the migrating fronts of E18.5 Lyve1-Cre;Yapf/f;Tazf/f embryos (F, magenta lines). The lymphatic vessels of mutant embryos were also dilated. The distance between the migrating fronts and the diameter of vessels are quantified in G. (H,I) LVs were observed in the collecting lymphatic vessels of E18.5 control embryos (H, yellow arrows). In contrast, the dilated lymphatic vessels of E18.5 Lyve1-Cre;Yapf/f;Tazf/f embryos lacked LVs (I). The various parameters of lymphatic vascular patterning were quantified and are plotted in G. n=4 embryos per each genotype. ****P<0.0001. Data are mean±s.e.m. Scale bars: 200 µm in A-D; 500 µm in E,F; 200 µm in H,I. Image collected and cropped by CiteAb from the following publication (https://pubmed.ncbi.nlm.nih.gov/33060128), licensed under a CC-BY license. Not internally tested by R&D Systems.
Detection of Mouse Mouse VEGFR3/Flt-4 Antibody by Immunohistochemistry
Cultured murine LECs express VDR.To check lymphatic origin of mouse LECs, we used three different well-established markers expressed by LECs. (a) Lymphatic origin of murine LECs was confirmed by IHC for Prox-1, VEGFR3 and Podoplanin (400x). Scale bar: 50 μm. (b) VDR expression of in vitro grown murine LECs was evaluated by western blot. Murine renal tubular epithelial cells (MTCs) served as positive control. (c) VDR expression of murine LECs was assessed by immunofluorescence (antibody D6) staining (200x). Scale bar: 50 μm. Image collected and cropped by CiteAb from the following publication (https://pubmed.ncbi.nlm.nih.gov/28303937), licensed under a CC-BY license. Not internally tested by R&D Systems.
Detection of Mouse Mouse VEGFR3/Flt-4 Antibody by Immunohistochemistry
YAP and TAZ are required for the maintenance of LVs. The lymphatic vessels in the dorsal skin of E16.5 and E18.5 control and Lyve1-Cre;Yapf/f;Tazf/f embryos were analyzed by whole-mount immunohistochemistry. (A,B) LVs were observed in the collecting lymphatic vessels of E16.5 control and Lyve1-Cre;Yapf/f;Tazf/f embryos (arrows). (C,D) The migrating front of E16.5 control (C) and Lyve1-Cre;Yapf/f;Tazf/f (D) embryos appeared comparable. (E-G) At E18.5, the lymphatic vessels from the left and right sides have merged to form a network in control embryos (E). In contrast, huge gaps were observed in between the migrating fronts of E18.5 Lyve1-Cre;Yapf/f;Tazf/f embryos (F, magenta lines). The lymphatic vessels of mutant embryos were also dilated. The distance between the migrating fronts and the diameter of vessels are quantified in G. (H,I) LVs were observed in the collecting lymphatic vessels of E18.5 control embryos (H, yellow arrows). In contrast, the dilated lymphatic vessels of E18.5 Lyve1-Cre;Yapf/f;Tazf/f embryos lacked LVs (I). The various parameters of lymphatic vascular patterning were quantified and are plotted in G. n=4 embryos per each genotype. ****P<0.0001. Data are mean±s.e.m. Scale bars: 200 µm in A-D; 500 µm in E,F; 200 µm in H,I. Image collected and cropped by CiteAb from the following publication (https://pubmed.ncbi.nlm.nih.gov/33060128), licensed under a CC-BY license. Not internally tested by R&D Systems.


