Detection of Human IgG by Western Blot
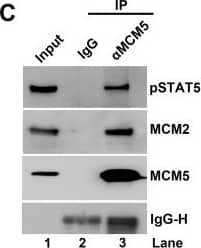
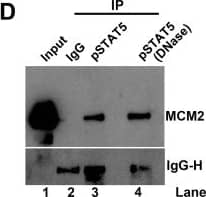
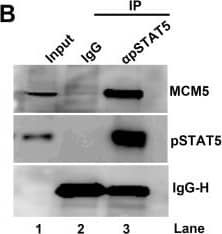
pSTAT5, but not NS1, interacts with the MCM complex.(A) Immunoprecipitation (IP) assay. Cell lysates of NS1Flag-expressing UT7/Epo-S1 cells were prepared for pull-down assays with either anti-Flag-conjugated beads or control beads. Immunoprecipitated proteins were examined for the presence of MCM2 by Western blotting. Blots were reprobed with rabbit anti-pSTAT5(Y694), anti-E2F5, and anti-Flag antibodies. Detection of E2F5 was used as a positive control for NS1 IP. (B) Co-IP assay. UT7/Epo-S1 cells were collected, washed, and lysed with RIPA buffer. After centrifugation, the supernatant was incubated with either rabbit anti-pSTAT5(Y694) or control IgG antibody. Immunoprecipitated proteins were blotted for the presence of the MCM complex with an anti-MCM5 antibody and for pSTAT5 with rabbit anti-pSTAT5(Y694). (C) Reverse Co-IP assay. Reverse Co-IP was performed with an anti-MCM5 antibody. Immunoprecipitated proteins were examined for pSTAT5, MCM2, and MCM5, respectively. (D) Co-IP of lysates treated with DNase. UT7/Epo-S1 cell lysates, either treated or untreated with DNase (750 units of Benzonase) were incubated with anti-pSTAT5(Y694) or control IgG antibodies for Co-IP assay, and immunoprecipitated proteins were examined for MCM2 by Western blot analysis. (E-H) Immunofluorescence analysis. (E&F) Mock- or B19V-infected CD36+ EPCs were co-stained with rabbit anti-STAT5 and mouse anti-MCM2 antibodies, followed by (E) incubation with respective secondary antibodies, or by (F) proximal ligation assay, which produces amplified signal for labeled molecules in close proximity. (G) CD36+ EPCs were incubated with either DMSO or pimozide (at 30 μM) for 2 days. And then the cells were co-stained with rabbit anti-STAT5 and mouse anti-MCM2 antibodies for proximity ligation assay. (H) Infected EPCs were stained with an anti-capsid antibody. Confocal images were taken with an Eclipse C1 Plus (Nikon) microscope at 100 × magnification. Image collected and cropped by CiteAb from the following open publication (https://dx.plos.org/10.1371/journal.ppat.1006370), licensed under a CC-BY license. Not internally tested by R&D Systems.
Detection of Human Normal Rabbit IgG Control by Immunohistochemistry
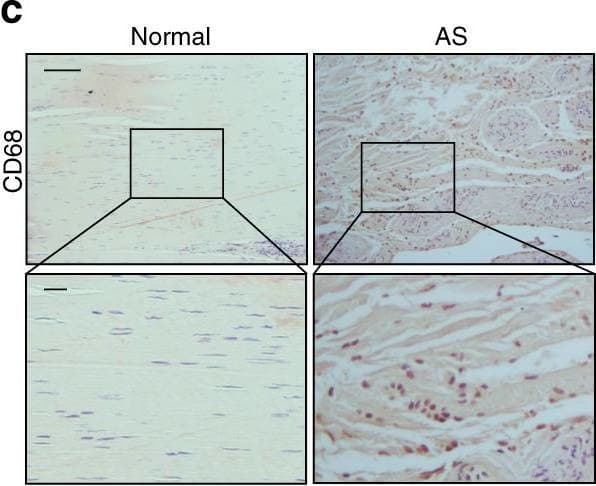
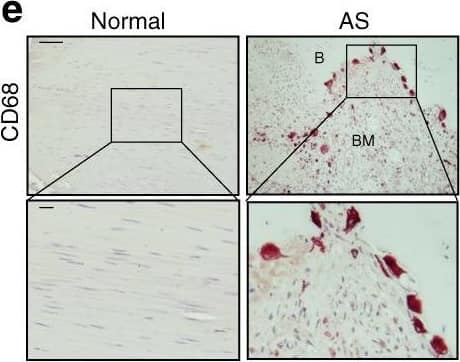
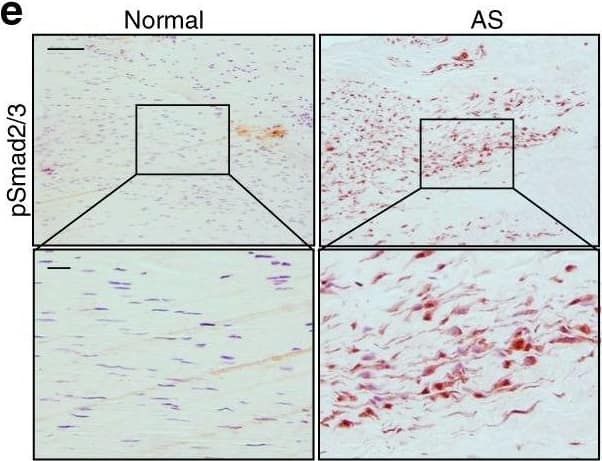
Elevated TGF-beta levels in the early inflammatory stage of AS. a Hematoxylin and eosin (H&E) staining and b Safranin O–Fast Green (SOFG) staining of normal and inflamed interspinous ligaments. In the AS group, the right panels show magnified views of the boxed area in the left panels. Scale bar: 100 μm (two panels on the right); 25 μm (left panel). c Immunostaining and d quantitative analysis of CD68-positive cells (brown) in the normal and inflamed interspinous ligaments (sagittal view). The bottom panels show magnified views of the boxed area in the top panels. Scale bar: 100 μm (top panels); 25 μm (bottom panels). e Immunostaining and f quantitative analysis of pSmad2/3-positive cells (brown) in the normal and inflamed interspinous ligaments (sagittal view) in normal ligaments and inflammatory ligaments. The bottom panels show magnified views of the boxed area in the top panels. Scale bar: 100 μm (top panels); 25 μm (bottom panels). g Immunostaining and h quantitative analysis of pSmad1/5/8-positive cells (brown) in the normal and inflamed interspinous ligaments (sagittal view). The bottom panels show magnified views of the boxed area in the top panels. Scale bar: 100 μm (top panels); 25 μm (bottom panels) Image collected and cropped by CiteAb from the following publication (https://pubmed.ncbi.nlm.nih.gov/33731675), licensed under a CC-BY license. Not internally tested by R&D Systems.
Detection of Human Normal Rabbit IgG Control by Immunohistochemistry
Osteoclast resorption of bony interspinous ligaments releases active TGF-beta to drive the progression of ossification in AS patients. e Immunostaining and f quantitative analysis of CD68-positive cells (brown) in the normal and HO-formed interspinous ligaments (sagittal view). The bottom panels show magnified views of the boxed area in the top panels. Scale bar: 100 μm (top panel); 25 μm (bottom panel). Image collected and cropped by CiteAb from the following publication (https://pubmed.ncbi.nlm.nih.gov/33731675), licensed under a CC-BY license. Not internally tested by R&D Systems.
Detection of Human Normal Rabbit IgG Control by Immunohistochemistry
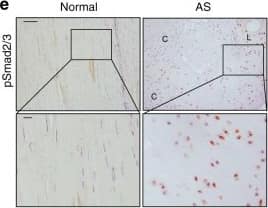
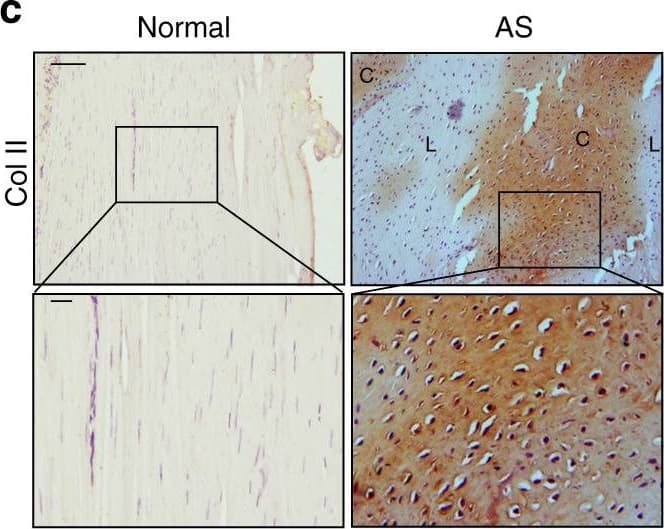
Chondrocyte differentiation and cartilage formation in interspinous ligaments of AS patients before calcification. a Hematoxylin and eosin (H&E) staining and b Safranin O–Fast Green (SOFG) staining of normal and chondrogenic interspinous ligaments. In the AS group, the right panels show magnified views of the boxed area in the left panels. Scale bar: 100 μm (two panels on the right side); 25 μm (left panel). c Immunostaining and d quantitative analysis of collagen II-positive cells (brown) in the normal and chondrogenic interspinous ligaments (sagittal view). The bottom panels show a magnified view of the boxed area in the top panels. Scale bar: 100 μm (top panel); 25 μm (bottom panel). e Immunostaining and f quantitative analysis of pSmad2/3-positive cells (brown) in the normal and chondrogenic interspinous ligaments (sagittal view). The bottom panels show magnified views of the boxed area in the top panels. Scale bar: 100 μm (top panel); 25 μm (bottom panel). g Immunostaining and h quantitative analysis of pSmad1/5/8-positive cells (brown) in the normal and inflammatory interspinous ligaments (sagittal view). The bottom panels show magnified views of the boxed area in the top panels. Scale bar: 100 μm (top panels); 25 μm (bottom panels). C, cartilage; L, ligament Image collected and cropped by CiteAb from the following publication (https://pubmed.ncbi.nlm.nih.gov/33731675), licensed under a CC-BY license. Not internally tested by R&D Systems.
Detection of Human Normal Rabbit IgG Control by Immunohistochemistry
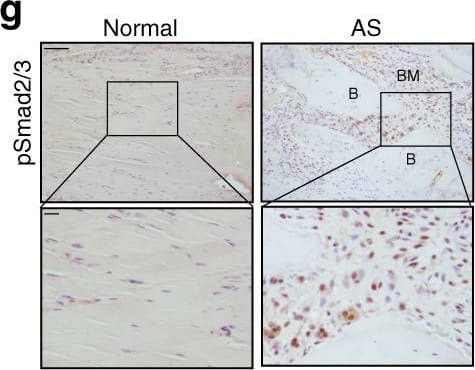
Progression of endochondral heterotopic ossification in AS patients. i Immunostaining and j quantitative analysis of pSmad2/3-positive cells (brown) in the normal ligaments and endochondral-ossified interspinous ligaments (sagittal view). The bottom panels show magnified views of the boxed area in the top panels. Scale bar: 100 μm (top panel); 25 μm (bottom panel). k Immunostaining and l quantitative analysis of Osterix-positive cells (brown) in the normal and endochondral-ossified interspinous ligaments (sagittal view). The bottom panels show magnified views of the boxed area in the top panels. Scale bar: 100 μm (top panel); 25 μm (bottom panel). m Immunostaining and n quantitative analysis of pSmad1/5/8-positive cells (brown) in the normal and inflammatory interspinous ligaments (sagittal view). The bottom panels show magnified views of the boxed area in the top panels. Scale bar: 100 μm (top panels); 25 μm (bottom panels). B, bone; BM, bone marrow; C, cartilage Image collected and cropped by CiteAb from the following publication (https://pubmed.ncbi.nlm.nih.gov/33731675), licensed under a CC-BY license. Not internally tested by R&D Systems.
Detection of Human Normal Rabbit IgG Control by Immunohistochemistry
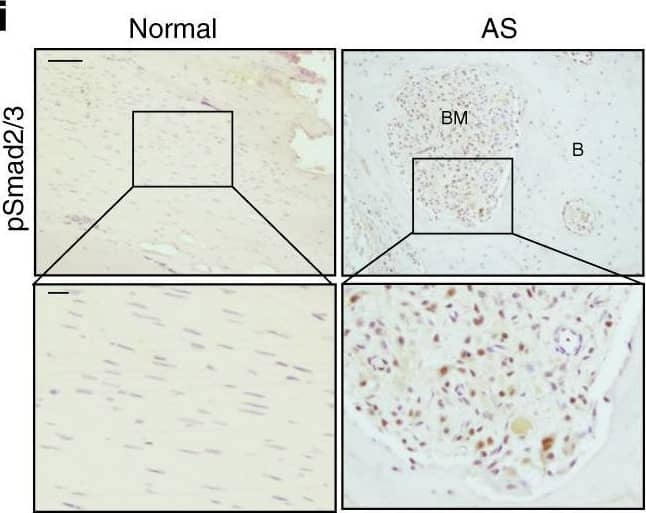
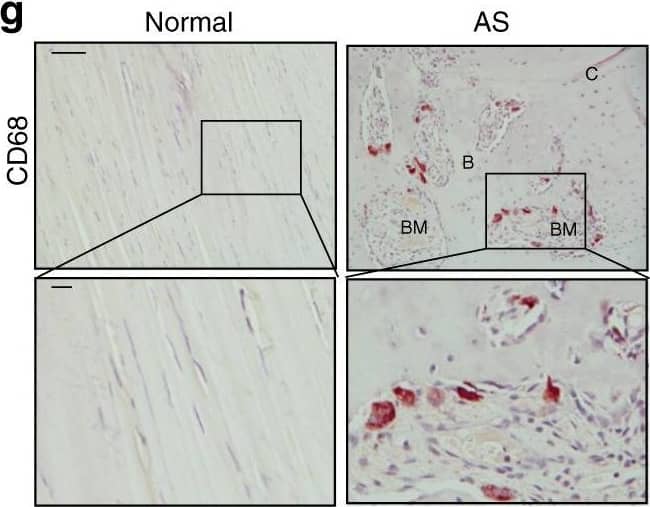
Progression of endochondral heterotopic ossification in AS patients. g Immunostaining and h quantitative analysis of the number of CD68-positive osteoclast (brown) surface (OCS) per bone surface (BS). The bottom panels show magnified views of the boxed area in the top panels. Scale bar: 100 μm (top panel); 25 μm (bottom panel). i Immunostaining and j quantitative analysis of pSmad2/3-positive cells (brown) in the normal ligaments and endochondral-ossified interspinous ligaments (sagittal view). The bottom panels show magnified views of the boxed area in the top panels. Scale bar: 100 μm (top panel); 25 μm (bottom panel). k Immunostaining and l quantitative analysis of Osterix-positive cells (brown) in the normal and endochondral-ossified interspinous ligaments (sagittal view). The bottom panels show magnified views of the boxed area in the top panels. Scale bar: 100 μm (top panel); 25 μm (bottom panel). m Immunostaining and n quantitative analysis of pSmad1/5/8-positive cells (brown) in the normal and inflammatory interspinous ligaments (sagittal view). The bottom panels show magnified views of the boxed area in the top panels. Scale bar: 100 μm (top panels); 25 μm (bottom panels). B, bone; BM, bone marrow; C, cartilage Image collected and cropped by CiteAb from the following publication (https://pubmed.ncbi.nlm.nih.gov/33731675), licensed under a CC-BY license. Not internally tested by R&D Systems.
Detection of Human Normal Rabbit IgG Control by Immunohistochemistry
Chondrocyte differentiation and cartilage formation in interspinous ligaments of AS patients before calcification. a Hematoxylin and eosin (H&E) staining and b Safranin O–Fast Green (SOFG) staining of normal and chondrogenic interspinous ligaments. In the AS group, the right panels show magnified views of the boxed area in the left panels. Scale bar: 100 μm (two panels on the right side); 25 μm (left panel). c Immunostaining and d quantitative analysis of collagen II-positive cells (brown) in the normal and chondrogenic interspinous ligaments (sagittal view). The bottom panels show a magnified view of the boxed area in the top panels. Scale bar: 100 μm (top panel); 25 μm (bottom panel). e Immunostaining and f quantitative analysis of pSmad2/3-positive cells (brown) in the normal and chondrogenic interspinous ligaments (sagittal view). The bottom panels show magnified views of the boxed area in the top panels. Scale bar: 100 μm (top panel); 25 μm (bottom panel). g Immunostaining and h quantitative analysis of pSmad1/5/8-positive cells (brown) in the normal and inflammatory interspinous ligaments (sagittal view). The bottom panels show magnified views of the boxed area in the top panels. Scale bar: 100 μm (top panels); 25 μm (bottom panels). C, cartilage; L, ligament Image collected and cropped by CiteAb from the following publication (https://pubmed.ncbi.nlm.nih.gov/33731675), licensed under a CC-BY license. Not internally tested by R&D Systems.
Detection of Human Normal Rabbit IgG Control by Immunohistochemistry
Osteoclast resorption of bony interspinous ligaments releases active TGF-beta to drive the progression of ossification in AS patients. g Immunostaining and h quantitative analysis of pSmad2/3-positive cells in the normal and HO-formed interspinous ligaments (sagittal view). The bottom panels show magnified views of the boxed area in the top panels. Scale bar: 100 μm (top panel); 25 μm (bottom panel). i Immunostaining and j quantitative analysis of Osterix-positive cells (brown) in the normal and HO-formed interspinous ligaments (sagittal view). The bottom panels show magnified views of the boxed area in the top panels. Scale bar: 100 μm (top panel); 25 μm (bottom panel). k Immunostaining and l quantitative analysis of PDGF-BB-positive cells in the normal and HO-formed interspinous ligaments (sagittal view). The bottom panels show magnified views of the boxed area in the top panels. Scale bar: 100 μm (top panels); 25 μm (bottom panels). m CD31-positive (red) cells, n EMCN-positive (green) cells and quantification of the fold change of o CD31-positive vessels, p EMCN-positive vessels in the normal and HO-formed interspinous ligaments (sagittal view). q PGP9.5-positive (red) cells and CGRP-positive (green) cells and quantification of the fold change of r PGP9.5 and CGRP double positive nerves in the normal and HO-formed interspinous ligaments (sagittal view). s Immunostaining and t quantitative analysis of pSmad1/5/8-positive cells (brown) in the normal and inflammatory interspinous ligaments (sagittal view). The bottom panels show magnified views of the boxed area in the top panels. Scale bar: 100 μm (top panels); 25 μm (bottom panels) Image collected and cropped by CiteAb from the following publication (https://pubmed.ncbi.nlm.nih.gov/33731675), licensed under a CC-BY license. Not internally tested by R&D Systems.
Detection of Human Normal Rabbit IgG Control by Immunohistochemistry
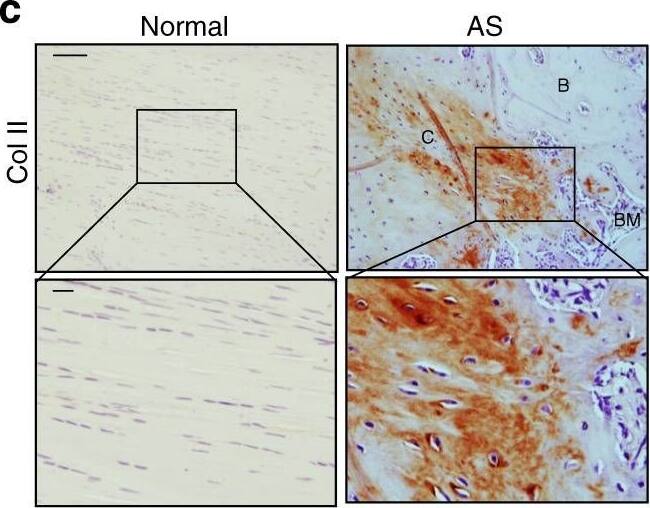
Progression of endochondral heterotopic ossification in AS patients. c Immunostaining and d quantitative analysis of collagen II-positive cells (brown) in the normal and chondrogenic interspinous ligaments (sagittal view). The bottom panels show magnified views of the boxed area in the top panels. Scale bar: 100 μm (top panels); 25 μm (bottom panels). Image collected and cropped by CiteAb from the following publication (https://pubmed.ncbi.nlm.nih.gov/33731675), licensed under a CC-BY license. Not internally tested by R&D Systems.
Detection of Human Normal Rabbit IgG Control by Immunohistochemistry
Elevated TGF-beta levels in the early inflammatory stage of AS. a Hematoxylin and eosin (H&E) staining and b Safranin O–Fast Green (SOFG) staining of normal and inflamed interspinous ligaments. In the AS group, the right panels show magnified views of the boxed area in the left panels. Scale bar: 100 μm (two panels on the right); 25 μm (left panel). c Immunostaining and d quantitative analysis of CD68-positive cells (brown) in the normal and inflamed interspinous ligaments (sagittal view). The bottom panels show magnified views of the boxed area in the top panels. Scale bar: 100 μm (top panels); 25 μm (bottom panels). e Immunostaining and f quantitative analysis of pSmad2/3-positive cells (brown) in the normal and inflamed interspinous ligaments (sagittal view) in normal ligaments and inflammatory ligaments. The bottom panels show magnified views of the boxed area in the top panels. Scale bar: 100 μm (top panels); 25 μm (bottom panels). g Immunostaining and h quantitative analysis of pSmad1/5/8-positive cells (brown) in the normal and inflamed interspinous ligaments (sagittal view). The bottom panels show magnified views of the boxed area in the top panels. Scale bar: 100 μm (top panels); 25 μm (bottom panels) Image collected and cropped by CiteAb from the following publication (https://pubmed.ncbi.nlm.nih.gov/33731675), licensed under a CC-BY license. Not internally tested by R&D Systems.
Detection of Mouse IgG by Western Blot
Protein-protein interaction between ANO1 and NCX3. (A) Co- IP of ANO1 and NCX3 from small intestine smooth muscle membrane fraction. Immunoprecipitates (IP) were obtained by elution with low pH buffer, and immunoblotting (IB) was performed using Wes with anti-ANO1 and anti-NCX3 antibodies. Lanes: 1, protein standards; 2, ANO1 in membrane fraction (2.5 mg); 3, ANO1 in ANO1 immunoprecipitate (5 ml); 4, ANO1 in non-immune rabbit IgG IP; 5, NCX3 in membrane fraction (1 mg); 6, NCX3 in NCX3 immunoprecipitate (5 ml); 7, NCX3 in non-immune rabbit IgG IP; 8, NCX3 in Ano1 immunoprecipitate (5 ml); 9, ANO1 in NCX3 immunoprecipitate (5 ml) n = 4. (B) Association between ANO1 and NCX3 occurs in situ in ICC, as demonstrated by PLA. ICC from small intestine (green, left panel) were exposed to the rabbit anti-ANO1 and goat anti-NCX3 antibodies, followed by the Duolink minus-anti rabbit IgG and plus-anti goat IgG secondary antibodies and the ligation and amplification reactions. For the PLA negative control, ICC were exposed to rabbit anti-ANO1 and mouse anti-myosin regulatory light chain antibodies (upper left panel). PLA-positive red spots were detected by ANO1-NCX3 co-localization (lower left panel). Few red spots were observed in negative controls. Nuclear staining of ICC was achieved with DAPI (blue, left panel). Intact ICC were confirmed by differential interference contrast (DIC) (right panels). Image collected and cropped by CiteAb from the following open publication (https://pubmed.ncbi.nlm.nih.gov/32256387), licensed under a CC-BY license. Not internally tested by R&D Systems.

