By Christina Towers, PhD.
Autophagy is a dynamic cellular recycling process that can be influenced by many different external and internal stimuli. The most commonly used assay to measure autophagy is a western blot for the autophagic membrane-specific protein, LC3. While this assay is relatively simple, if not controlled properly, the results can easily be misinterpreted. Indeed, the most accurate way to measure autophagy is with an autophagic flux assay defined as the new formation of double-membrane vesicle-like structures called autophagosomes and their subsequent fusion with the lysosome. LC3 is a unique component of the autophagic machinery because it is incorporated into the newly forming autophagosome membrane but is then degraded along with the autophagosome contents after lysosomal fusion.
Static measurements of LC3 can be difficult to interpret as an increase in LC3 with a given stimulus could be interpreted as an increase in autophagy due to an increase in autophagosome formation. Alternatively, the same increase in LC3 could be interpreted as a decrease in functional autophagy due to a lack of autophagosome fusion with lysosomes and therefore a buildup of un-degraded autophagosomes and LC3.
By blocking the fusion of autophagosomes with lysosomes, information can be gained about the amount of newly formed autophagosomes in the stimulated cells. This can be likened to water flowing down a creek, and if a dam is added to block the water flow, the amount of accumulating water behind the dam indicates how much water is flowing upstream to downstream. Applying this same idea to autophagy flux; if the breakdown of autophagosomes is blocked (the dam), they accumulate and indicate how many 'new autophagosomes are being produced over a particular time.

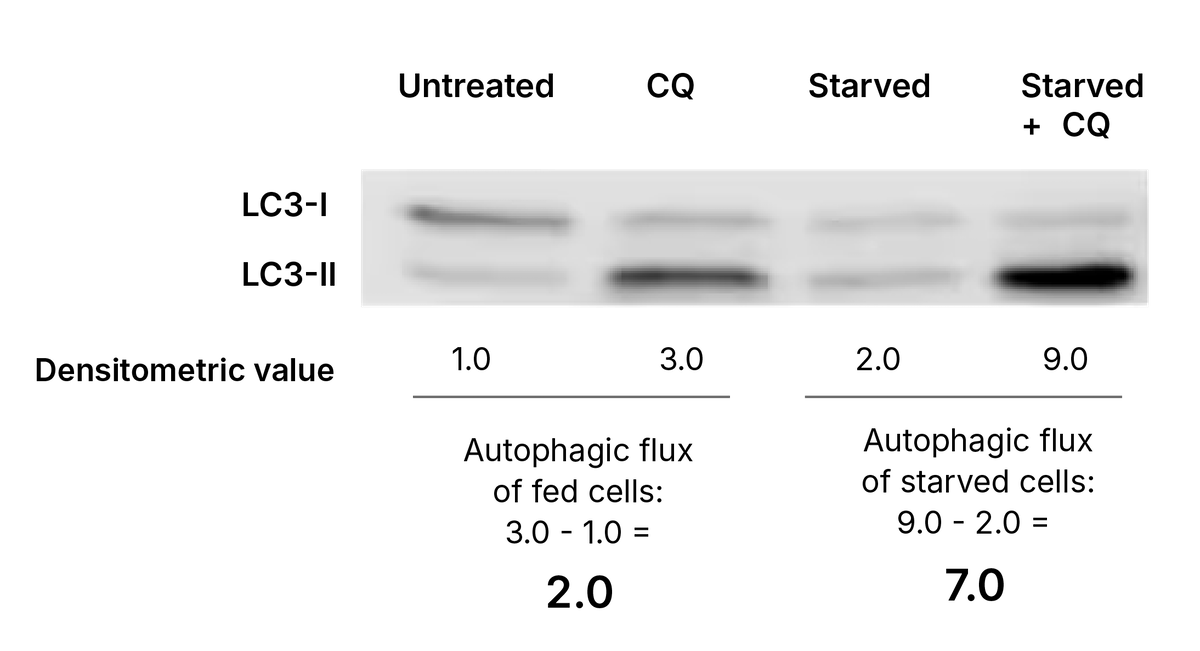
Autophagic flux assay in starved cells with a western blot of LC3. The correct way to calculate autophagic flux based on the LC3-II band is calculated below. Data and densitometric values are hypothetical.LC3B antibody (Catalog # NB100-2220) was used in this example.
For example, starvation-induced autophagy has been confirmed by a myriad of different assays and can also be clearly observed with an autophagic flux assay via an LC3 western blot. To perform this assay (which can easily be adapted to any stimulus), four conditions should be analyzed. (1) Untreated cells, (2) Cells treated with the stimulus of interest, in this case starvation for 16hrs, (3) Cells treated with a lysosomal inhibitor, i.e. chloroquine at 40μM for 2hrs, and (4) Cells starved for 16hrs with chloroquine (40μM) added for the last 2hrs of treatment. Whole cell lysate from these samples is then loaded onto a 12% polyacrylamide gel to ensure sufficient separation of the LC3-I and LC3-II band and probed with and LC3 antibody. Densitometric analysis of the LC3-II band can then be used to assess autophagic flux. It is important to note that the LC3-I band is not indicative of autophagic flux and should not be analyzed, nor should the LC3-II band be normalized to the LC3-I band.

CAUTION: Simply monitoring autophagy flux by LC3-II westerns is not sufficient to claim a change in autophagic flux. It is recommended to use at least 2- 3 separate assays for monitoring autophagic flux including flow cytometry-based assays or confocal imaging to monitor LC3, and western blots for autophagy-specific substrates like p62.

Christina Towers, PhD
University of Colorado (AMC)
Dr. Towers studies the roles of autophagy, apoptosis and cell death in cancer.
