Compass Software for Simple Western
Compass for SW is the control and data analysis application for Simple Western instruments. Compass for SW lets you set up assays and streamlines data analysis with its intuitive interface and robust tools for automating protein quantification and annotation.
- Quantitative analysis for each protein or isoform is done automatically.
- Data can be displayed in a lane view, graph view, or as a digital capillary image.
- Export data and reports with the click of a button.
- 21 CFR Part 11 compliance tools with the Compass Authorization Server.
Download Compass for SW User Guide
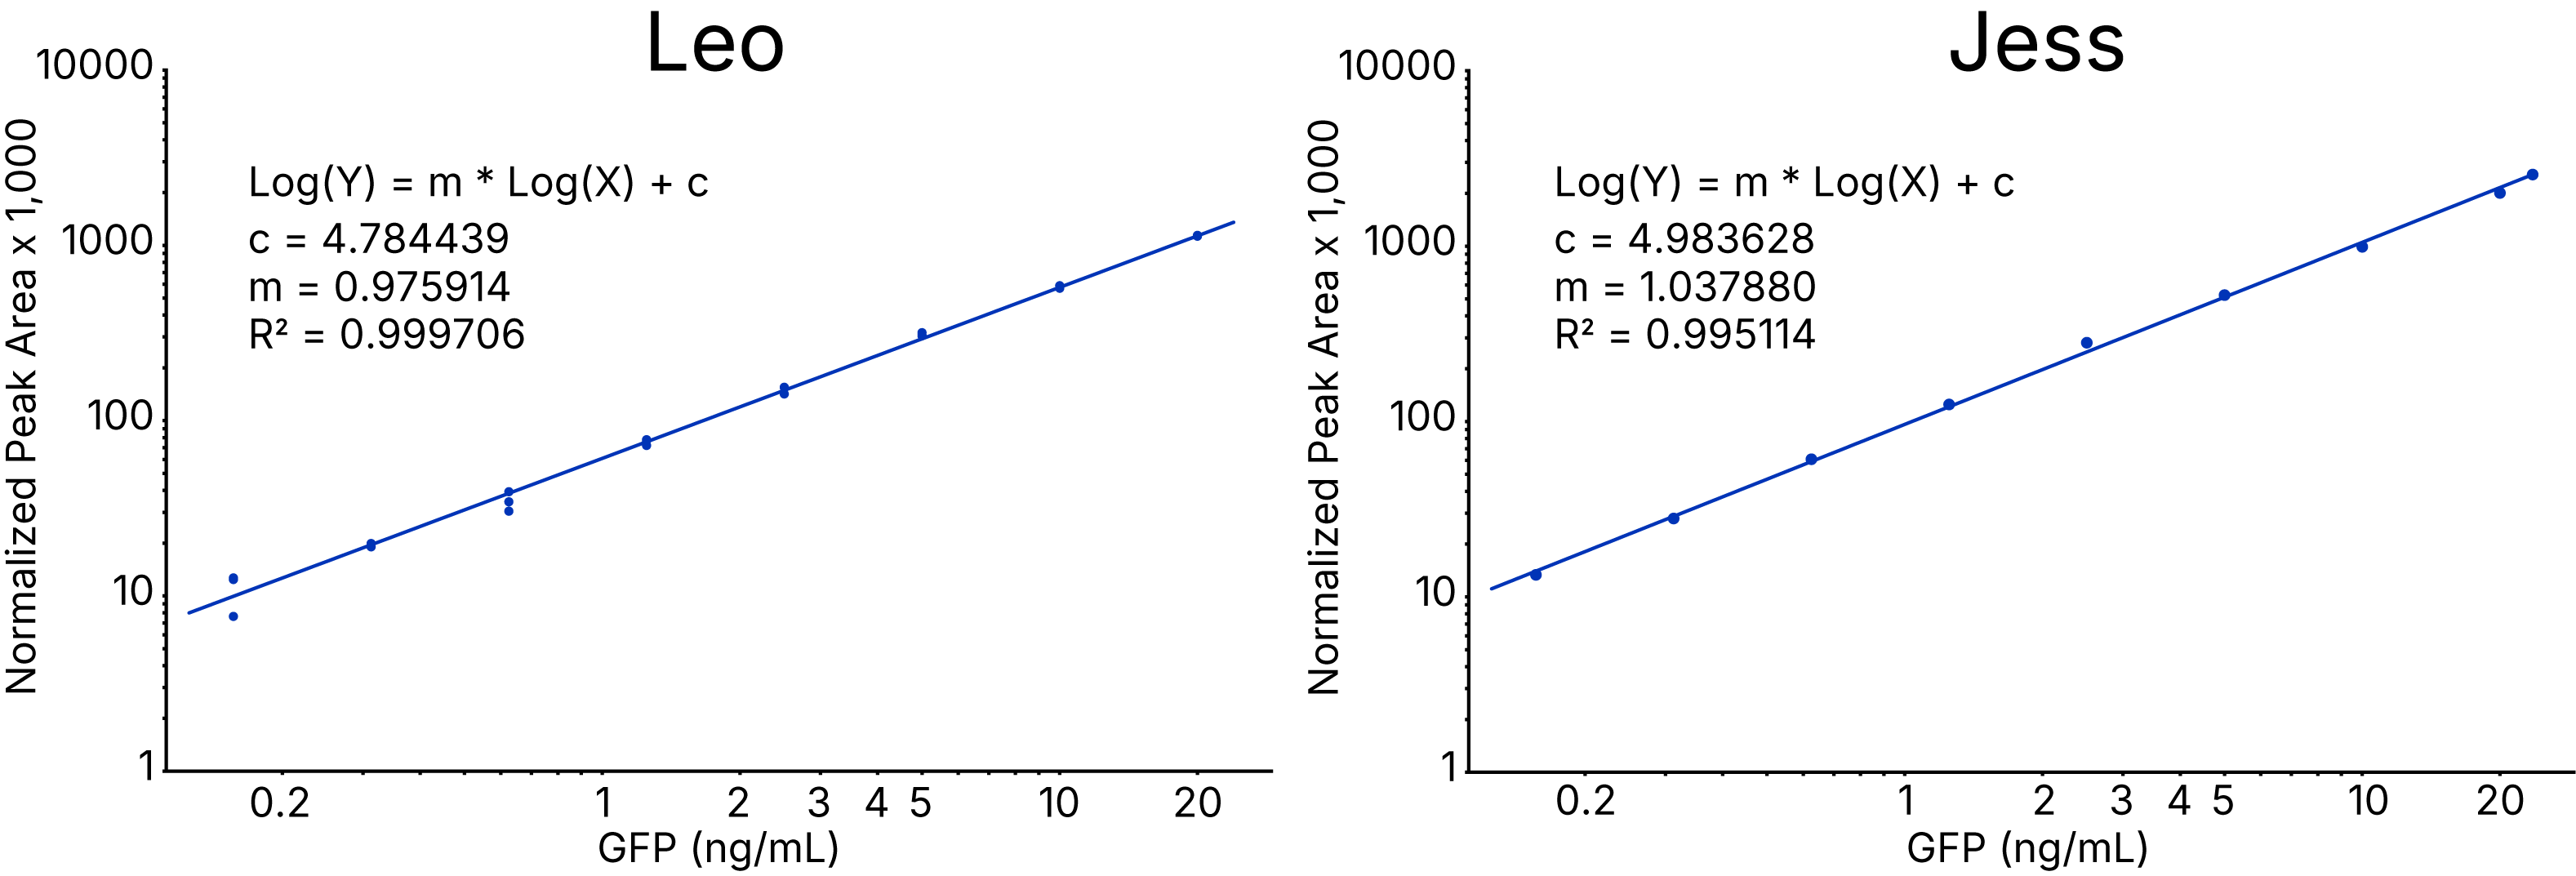
Advanced Standard Curve Tools
- Compass has in-software tools to build a standard curve and generate reported concentrations of unknowns.
- Version 7.0 supports the following curve fits: Linear, 4PL, Log-Log
Sample Group Analytics
- Group samples together by attributes defined in the Assay Layout such as Sample Name, Attribute, or more.
- Compare your replicates and get variability data quickly and easily with sample grouping
Leo Assay Setup and Analysis
- Compass for SW 7.0 lets you set up assays for Leo using 25-100 capillaries and 1-4 cartridges
- Normalizes cartridge-to-cartridge variability using a reference control across each cartridge, allowing for quantitative comparisons between data from one cartridge and another
Lane Annotation
- Create a publication or presentation lane view figure using annotation tools.
- Adjust the lane order and displayed molecular weight, stack multiple channel views, merge lane labels and control where they are located, and add additional label groups to add treatment or time-course information.
Adjustable Peak Integration
- Manually adjust the start and end of peak boundaries in the Graph View for more accurate quantitative results.
Adjustable Total Protein Normalization
- Manually adjust the baseline with start and end pixel position for greater flexibility in generating normalized data.

Charge-Based Protein Analysis
- Proteins can also be displayed as an electropherogram in graph view and data for multiple samples can be overlaid. Peaks are automatically defined by name or pI.
- Hovering your cursor over the peak will reveal its protein-specific information. Quantitative distributions of detected isoforms are reported in a table with export functions included.

Available with All Compass for SW Versions 5.0.1 and Up
High Dynamic Range (HDR) Detection Profile. This feature expands the dynamic range with an algorithm to create high dynamic range multi-image analysis, refreshing substrate from the assay plate prior to each exposure.
Reports. Export reports as .pdf files. Choose from a list that includes plate layout, sample peaks, images and much more.
Multiple Exposure View. Overlay all the chemiluminescence exposure times acquired for a particular run and spot potential signal burnout.
Lane Contrast Tool. Part of the Analysis Settings, the lane contrast tool can be set to user-defined white and black levels. Once saved, the lane contrast setting can be exported and applied to other assays or runs.
21 CFR Part 11 Compliance. The Compass Authorization Server 3.0 can be used to help satisfy the 21 CFR Part 11 compliance and data security requirements when using Simple Western instruments.
When Access Control is enabled and the new Authorization Server has been installed:
- Users are required to log in to Compass when the protein analysis software is launched
- A history of all actions is maintained
- Data files are signed and encrypted to prevent unauthorized changes (e.g., all files are controlled)
- Each instrument maintains a history of user commands
- Each assay and data file includes a history of signed changes to the file
Video Tutorials: Data Analysis with Compass for SW
Compass Basic Analysis
Module 1
- Understanding baseline and how to use it as you analyze your results
Compass Basic Analysis
Module 2
- Graphs, image, and lane views
- Make figures
Compass Basic Analysis
Module 3
- Image exposure settings
- Grouping statistics
Compass Basic Analysis
Module 4
- Managing background
- Managing signal burnout or saturation
- Setting linear dynamic range
Compass Advanced Analysis
Module 1
- Peak Fit in the Analysis Settings
Compass Advanced Analysis
Module 2
- Using the Advanced Settings tool
- Applying filters
- Hiding caps
Compass Advanced Analysis
Module 3
- How to normalize your data to a chosen control
Compass Advanced Analysis
Module 4
- Setting up a standard curve and how to use it to analyze unknown samples