Analysis of ADC Mimics by icIEF with 458 nm Fluorescence Detection
Introduction
Antibody-drug conjugates (ADCs) are a promising class of cancer therapeutics. By combining the complementary activities of monoclonal antibodies (mAbs) with small molecule drugs, ADCs are designed to afford highly selective and highly potent cancer treatment with an expanded therapeutic window over conventional treatment like chemotherapy. Today, there are several ADCs on the market, with many more undergoing development and clinical trials1.
An important factor concerning the efficacy, pharmacokinetics, and stability of ADCs is the drug-toantibody ratio (DAR),which is defined as the number of drug molecules conjugated to the antibody1 . Attaching too few drugs to an antibody can lead to low efficacy, and attaching too many drugs can lead to high clearance rates, instability and systemic toxicity. Therefore, the DAR must be carefully monitored during the synthesis of all ADCs, and measures should be taken to ensure DAR homogeneity1 .
Imaged capillary isoelectric focusing (icIEF) is a popular method for the characterization of charge heterogeneity of complex protein molecules due to its ability to separate and quantify charge isoforms with high precision2 . Because lysine-linked drug conjugates have charge isoforms that are more acidic, icIEF is a useful method to assay the amount of unconjugated from conjugated mAb, and to provide a rapid way to monitor conjugation-related changes3 .
However, certain limitations still exist, as lysine linker without a conjugated drug also shifts charge isoforms to the acidic end, leading to possible overestimation of conjugated mAb in the sample2 . To address this concern, the Maurice system from ProteinSimple introduced fluorescence detection at 458 ± 30 nm in addition to the existing absorbance and native induced fluorescence (NIF) detection modes (Figure 1A). The new fluorescence 458 nm filter is particularly useful for ADC characterization because many ADCs absorb at 280 nm and have fluorescence in this region, allowing for the quantification of the conjugated drug independently of the antibody for each charge isoform.
Here, we provide proof-of-concept using fluorescent ADC mimics, which are antibodies conjugated to fluorescent dyes via lysine residues to represent the cytotoxic drug. In this study, the fluorescent dye, Alexa Fluor® 350 (AF-350), was conjugated at both low and high dye-to-protein (D/P) molar ratios to mimic different DARs (Figure 1B). Our findings demonstrate that the fluorescent conjugate can be imaged independently of the protein signal, and the dye and antibody peaks can be assigned by overlaying the absorption and fluorescence profiles.
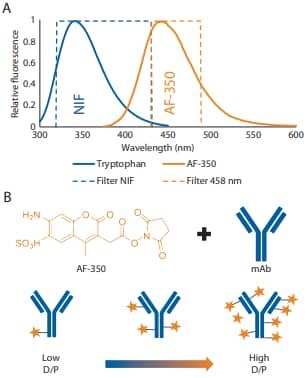
Figure 1. (A) NIF and AF-350 emission and filter bandwidth. (B) Schematic of low to high levels of AF-350 conjugation to a mAb.
Materials
ProteinSimple - A Bio-Techne Brand
- Instrument: Maurice or Maurice C.
- 458 nm Filter (PN 104-0032)
- Maurice cIEF Cartridges (PN PS-MC02-C)
- Maurice cIEF Method Development Kit (PN PS-MDK01-C)
- Compass 2.1 Software
Other materials
- Fluorescent pI marker 5.5, 7.2 and 9.5 (Sigma PN 77866, 89951, 89268)
- Alexa Fluor 350 NHS Ester (Thermo, PN A10168)
- CY3 NHS (Lumiprobe, PN 11020)
- Amicon 10 kDa MWCO spin columns (MilliporeSigma PN UFC5010)
Samples
- Recombinant trastuzumab (R&D Systems, PN MAB9589)
- NIST Monoclonal Antibody (RM 8671)
Methods
- Dilute samples to 0.5–1.0 mg/mL with 0.1 M sodium bicarbonate buffer pH 8.3. Then, incubate the diluted antibody for 60 minutes at 30 °C in the presence of equimolar AF-350 or CY3 dye, according to manufacturer's specifications.
- Remove the free dye with an Amicon 10 kDa spin column by washing with 350 µL of water. Aliquot the final material and store at -80 °C.
- Dilute samples to 0.2 mg/mL final concentration in ampholyte mix consisting of 4% Pharmalytes (3% 8–10.5 and 1% 5–8), 3.2 M urea, 5 mM IDA,10 mM arginine, and pI markers 5.85 and 10.17. This is a platform method developed by ProteinSimple to analyze biosimilars on Maurice. For more information, see Biosimilar Platform Methods on Maurice.
- Focus for 1 minute at 1500 V, then 8 minutes at 3000 V.
- For data acquisition at 458 nm, use a fluorescence exposure series of 5, 10, 15, 20 and 40 seconds.
Results
Following the protocol described above, we conjugated AF-350 to trastuzumab, and then analyzed both conjugated and unconjugated mAbs on Maurice with absorbance detection. The absorbance profile of the unconjugated mAb was similar to that previously observed of trastuzumab (see Biosimilar Platform Methods on Maurice) (Figure 2A). The absorbance profile of conjugated mAb resulted in the appearance of several large peaks in the acidic region (Figure 2B), which is typical for a lysine-conjugated ADC2 . These peaks correspond to the occupancy of the AF-350 NHS dye at available lysine residues. The main peak corresponding to unconjugated trastuzumab was also present.
Next, we examined conjugated and unconjugated mAbs using all detection modes available on Maurice, including absorbance, NIF and 458 nm fluorescence (Figure 3). A useful feature of Compass software is the option to overlay spectra from different channels, allowing for direct comparison of separation profiles obtained from each detection mode. As expected, the NIF profile had perfect alignment with the absorbance profile (Figure 3A-B). By contrast, analysis with the fluorescence 458 nm filter resulted in significantly larger peaks in the acidic region relative to absorbance and the disappearance of the 3 Taking a Closer Look at Your ADC HighD/P Low D/P Greater 458 nm peak area with increasing dye:protein 0 100000 200000 300000 400000 500000 600000 Pk12 Pk11 Pk10 Pk9 Pk8 Pk7 Pk6 Pk5 Pk4 Pk3 Pk2 Pk1 MP Basic Peak Area Fluorescence 458 nm NIF Figure 4. Overlaid NIF and 458 nm fluorescence profiles of (A) unconjugated and (B) conjugated trastuzumab. unconjugated main peak (Figure 3C), indicating that the 458 nm filter detects only the conjugated dye and not the amino acid backbone.
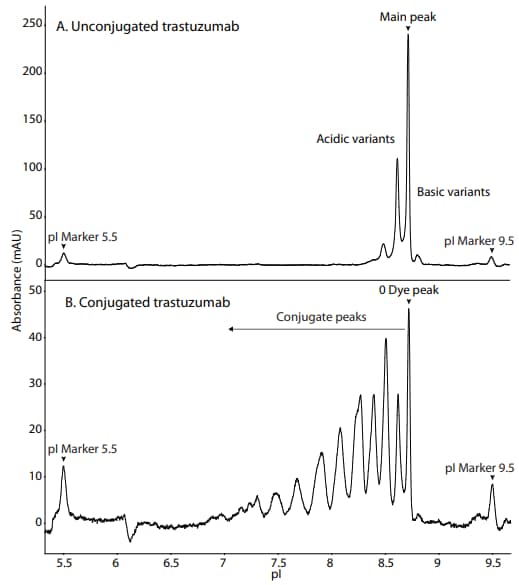
Figure 2. The absorbance profile of (A) unconjugated and (B) AF-350- conjugated trastuzumab.
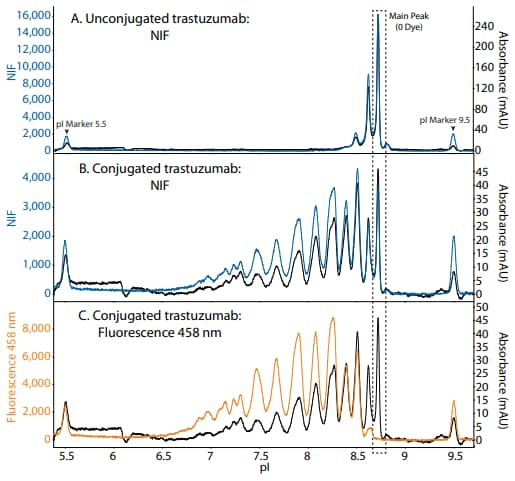
Figure 3. The NIF (blue trace) and 458 nm fluorescence (orange trace) profiles of unconjugated and conjugated mAb overlaid with the absorbance profiles (black traces).
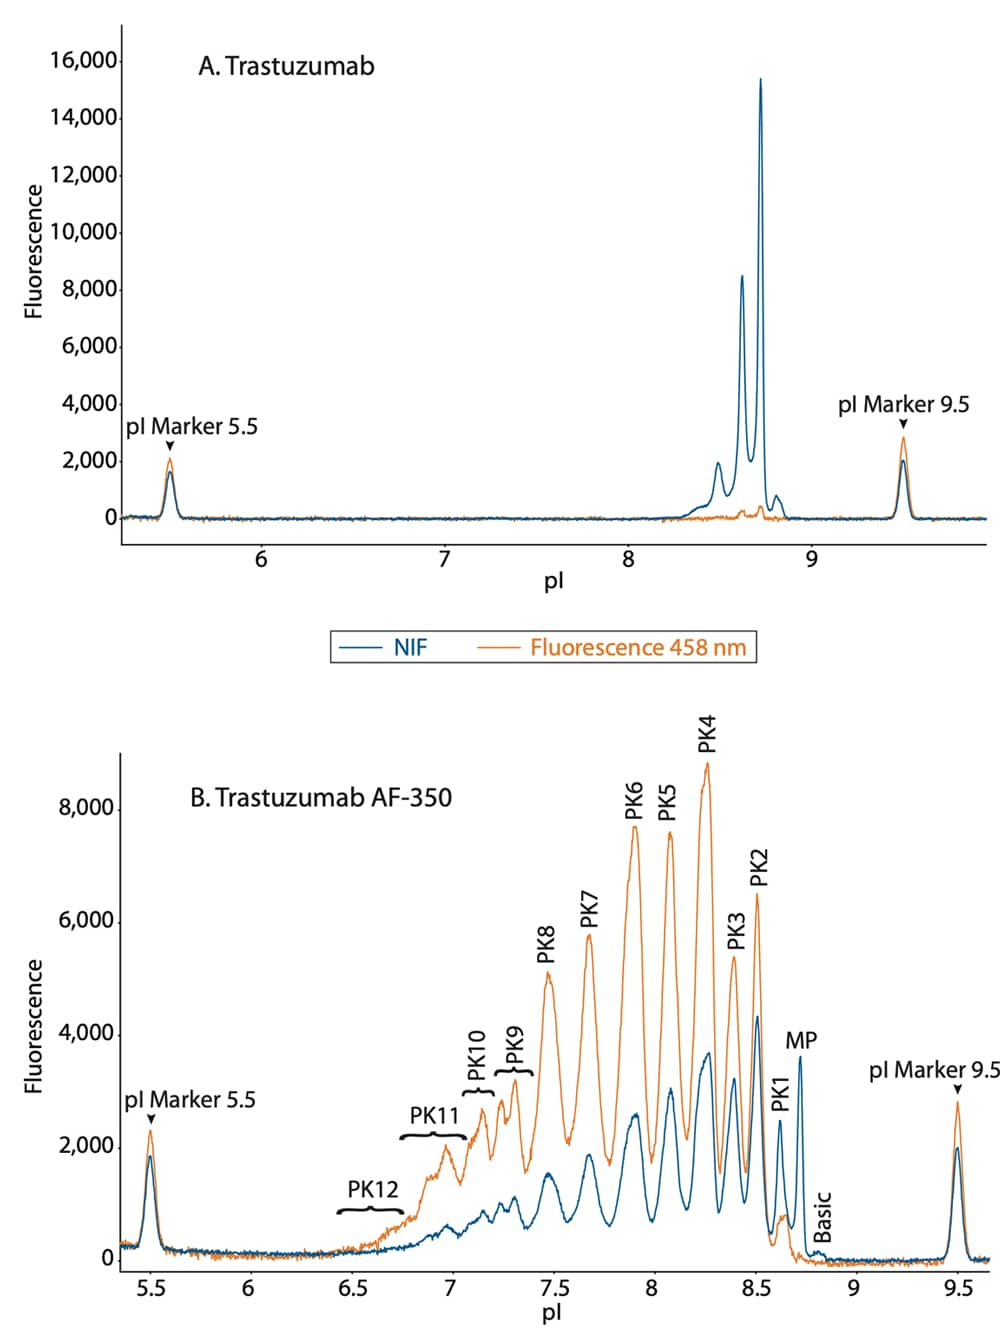
Figure 4. Overlaid NIF and 458 nm fluorescence profiles of (A) unconjugated and (B) conjugated trastuzumab.
To determine the extent of spectral overlap of NIF detection into 458 nm fluorescence detection, we overlaid the electropherograms of unconjugated trastuzumab from these two channels. The spectral overlap of the 458 nm into the NIF channel was minimal as shown by the orange trace of the unconjugated mAb (Figure 4A). Furthermore, when comparing the conjugated mAb in these two channels, the 458 nm filter signal increased significantly among the more acidic peaks (Figure 4B). This is due to the increasing contribution of the additional fluorescent dye conjugates. This shift can be quantified by plotting the absolute peak area of 458 nm to NIF, which confirmed the increase in conjugated peaks in the 458 nm channel, while the unconjugated mAb was very close to zero (Figure 5). Collectively, these results confirm that the 458 nm fluorescence filter is selective for the dye conjugate and not the amino acid back bone of the protein.
So far, we have shown that wavelengths of ~300–400 nm have minimal spectral overlap with the 458 nm fluorescence channel. Likewise, we sought to determine if wavelengths of >500 nm overlap with the 458 nm fluorescence channel. Like AF-350, CY3 is a lysine conjugate, but its emission spectra are >500 nm, and therefore should not be detected in the 458 nm fluorescence channel (Figure 6). To test this, we separately conjugated NIST mAb to CY3 and AF-350 and injected the samples on Maurice. In the NIF overlay, the two conjugates had very similar profiles (Figure 7A). However, in the 458 nm filter, the CY3 conjugate signal was nearly eliminated (Figure 7B), indicating minimal bleed through of the CY3 dye into the 458 nm channel.
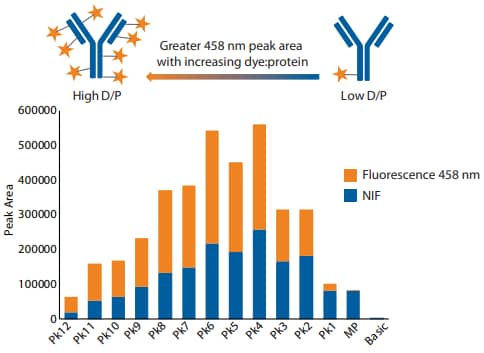
Figure 5. Peak area ratio of 458 nm fluorescence to NIF for each peak of conjugated trastuzumab.
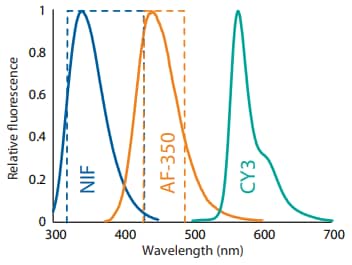
Figure 6. The emission spectra of NIF, AF-350, and CY3. Dashed boxes represent filter bandwidths.
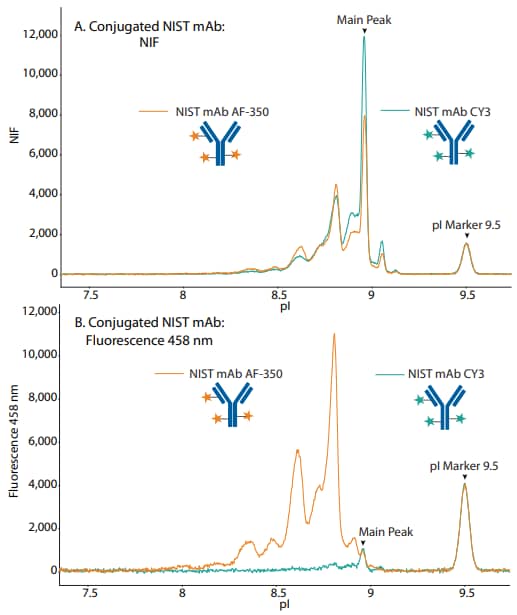
Figure 7. Overlaid electropherograms of NIST mAB conjugated to AF-350 and CY3 in the (A) NIF channel and (B) fluorescence 458 nm channel.
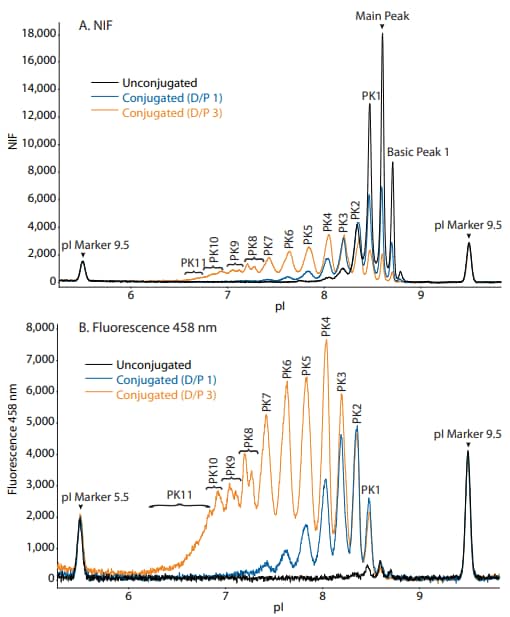
Figure 8. Overlaid electropherograms of unconjugated, D/P 1, and D/P 3 trastuzumab conjugates in the (A) NIF channel and (B) fluorescence 458 nm channel.
Hypothetically, the 458 nm fluorescence signal, but not the NIF signal, should increase proportionally with the amount of dye conjugated to protein (D/P). To test this, we created trastuzumab conjugates with D/P ratios of 1 and 3. When analyzed with NIF, the total peak area varied by approximately 10% among unconjugated, D/P 1 and D/P 3 samples (Figure 8A and 10). By contrast, the total peak area increased dramatically from the unconjugated sample to the D/P 1 and D/P 3 samples when analyzed with the 458 nm channel (Figure 8B and 10). Furthermore, the individual peak area percentages showed a shift towards more acidic peaks between the D/P 1 and D/P 3 conjugates (Figure 9). As expected, the total peak area increased ~3X from the D/P 1 to the D/P 3 sample in the 458 nm fluorescence channel, while remaining relatively unchanged in the NIF channel (Figure 10). Altogether, these data support the hypothesis that the amount of conjugated dye is proportionally related to the fluorescence signal in the 458 nm channel, but not the NIF channel.
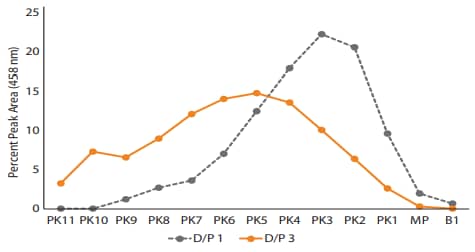
Figure 9. The percent peak area of D/P 1 and D/P 3 conjugates. in the 458 nm fluorescence channel.
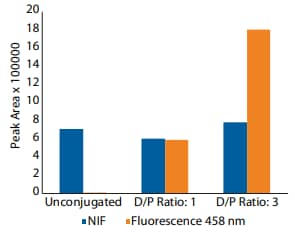
Figure 10. The total peak area for the different conjugates in both NIF and 458 nm fluorescence filters.
Conclusion
Here, we utilize the optional 458 nm filter on Maurice to analyze a fluorescent ADC mimic to address a characterization need for ADCs, which represent a rapidly growing new class of protein therapeutics. These data show that Maurice can separate conjugated mAbs with high speed and resolution. The NIF detection is more sensitive than absorbance, and the new 458 nm filter allows for the detection and quantification of the drug conjugate with minimal NIF crosstalk. As expected, the degree of labeling is correlated with fluorescence intensity in the 458 nm channel. Taken together, these data provide proof-of-concept for a novel charge heterogeneity analysis method for mAbs and their drug conjugates on the same platform.
To determine if your ADC of interest can be analyzed by Maurice's 458 nm fluorescence filter, our recommendation is for you to first perform fluorescent spectral scans using a microplate reader. Set the excitation to 280 nm and scan the emission wavelengths above 280 nm, including at least ~400–500 nm. If the fluorescence intensity of your sample increases at 458 ± 30 nm relative to an unconjugated control, your ADC may be analyzed by Maurice's new 458 nm fluorescence filter. This approach can be expanded to other assays with additional fluorescent filters at different wavelengths.
References
- Strategies and challenges for the next generation of antibody-drug conjugates, A Beck, L Goetsch, C Dumontet and N Corvaïa, Nature Reviews Drug Discovery, 2017; 16, 315–37.
- Challenges and new frontiers in analytical characterization of antibody-drug conjugates, A Wagh, H Song, M Zeng, L Tao and T Das, mAbs, 2018; 10(2):222–43.
- Determination of charge heterogeneity and level of unconjugated antibody by imaged cIEF, J lin and A Lazar, Antibody-Drug Conjugates, 2013; 1045: 293–302.