Analysis of Adalimumab by Maurice
Introduction
Adalimumab is a biological drug used to treat rheumatoid arthritis, Crohn’s disease and psoriasis1. Adalimumab reduces inflammatory responses by inhibiting the binding of TNFα to its receptor. It was the best selling biopharmaceutical until its patent expired in 2016, reaching $16 billion in global sales annually2. Several biosimilars are already on the market3.
Maurice icIEF Method
Carboxypeptidase B (CpB) treatment: Adalimumab was diluted to 1.0 mg/mL in water prior to CpB digestion. CpB (1 mg/mL stock solution) was added at a ratio of 1:100 (CpB to sample) and incubated at 37 °C for 20 minutes and then placed on ice. CpB was obtained from Sigma-Aldrich (PN C9584).
Sample preparation: Adalimumab was diluted to 0.2 mg/mL in the ampholyte solution.
Ampholyte solution: Pharmalytes 8–10.5 (3%) and 5–8 (1%) containing 3.2 M urea, 5 mM IDA and10 mM arginine.
pI markers: 5.85 and 10.17.
Running conditions: 1 minute at 1500 V, then 8 minutes at 3000 V.
Imaging: Absorbance and fluorescence.
Recombinant: The adlimumab recombinant was acquired from R&D Systems, PN MAB9677.
Results
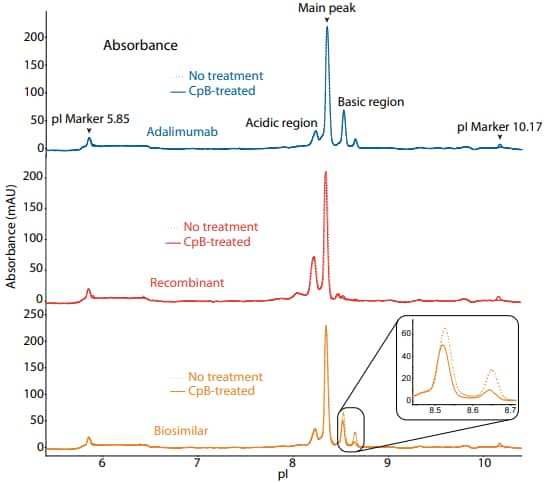
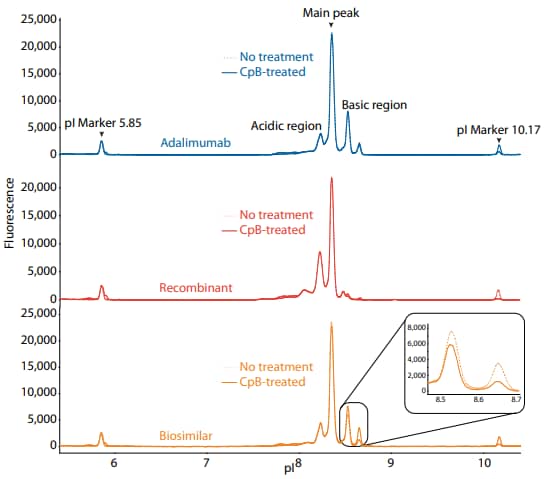
To compare adalimumab to a recombinant and a biosimilar, we used the icIEF platform method described above to monitor charge heterogeneity by absorbance (Figure 1) and by native fluorescence (Figure 2) detection.
These analyses revealed that the innovator, recombinant, and biosimilar are similar in charge heterogeneity and purity. To evaluate the presence of lysine variants, the antibodies were treated with CpB before analysis on icIEF. Treatment with CpB had a more dramatic effect on the basic region of the biosimilar than on the other molecules (Figure 1, 2), indicating that the biosimilar may have more terminal lysine containing variants in the final sample preparation.

Figure 1. icIEF absorbance (top) and peak area percentages (bottom) of adalimumab, a recombinant, and a biosimilar.
| Sample | Acidic Region | Main Peak | Basic Region | Δ Basic Region | |
|---|---|---|---|---|---|
|
Adalimumab |
No treatment | 16.4 | 63.8 | 19.8 | N/A |
| CpB-treated | 20.3 | 72.6 | 7.1 | -12.7 | |
|
Recombinant |
No treatment | 40.9 | 52.6 | 6.5 | N/A |
| CpB-treated | 41.9 | 53.4 | 4.7 | -1.8 | |
|
Biosimilar |
No treatment | 16.8 | 58.8 | 24.4 | N/A |
| CpB-treated | 17.9 | 64.5 | 17.6 | -6.8 | |

Figure 2. icIEF fluorescence (top) and peak area percentages (bottom) of adalimumab, a recombinant, and a biosimilar.
| Sample | Acidic Region | Main Peak | Basic Region | Δ Basic Region | |
|---|---|---|---|---|---|
|
Adalimumab |
No treatment | 17.9 | 58.9 | 23.1 | N/A |
| CpB-treated | 20.8 | 57.6 | 21.5 | -1.6 | |
|
Recombinant |
No treatment | 43.6 | 50.5 | 5.9 | N/A |
| CpB-treated | 45.6 | 50.0 | 4.4 | -1.5 | |
|
Biosimilar |
No treatment | 19.7 | 56.0 | 24.3 | N/A |
| CpB-treated | 24.0 | 59.0 | 17.0 | -7.3 | |
Maurice CE-SDS Method
Sample preparation: Adalimumab was diluted to 1 mg/mL with 1X Sample Buffer prior to treatment for 10 minutes at 70 °C in the presence of either 11.5 mM IAM (non-reducing) or 650 nM β-ME (reducing).
Running conditions: Samples were injected for 20 seconds at 4600 V, followed by a 25-minute separation (reducing) or a 35-minute separation (non-reducing) at 5750 V.
Results
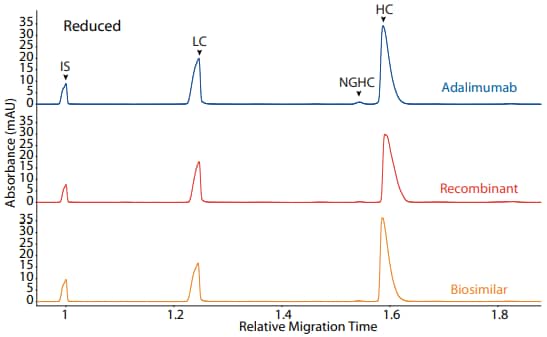
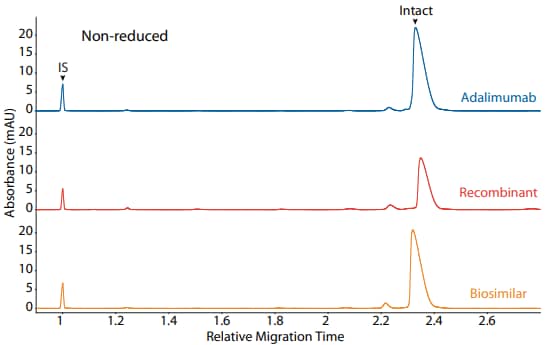
Adalimumab, a recombinant, and a biosimilar were analyzed on the CE-SDS platform method described above under reducing (Figure 3) and non-reducing (Figure 4) conditions, resulting in comparable purity.

Figure 3. CE-SDS reduced (top) and area percentages (bottom) of adalimumab, a recombinant, and a biosimilar. (IS) Internal standard. (LC) Light chain. (NGHC) Non-glycosylated heavy chain. (HC) Heavy chain
| Sample | LC | NGHC | HC | Other |
|---|---|---|---|---|
| Adalimumab | 30.3 | 0.3 | 68.5 | 0.9 |
| Recombinant | 30.9 | 0.3 | 68.6 | 0.2 |
| Biosimilar | 31.5 | 1.9 | 66.1 | 0.5 |

Figure 4. CE-SDS non-reduced (top) and peak area percentages (bottom) of adalimumab, a recombinant, and a biosimilar. (IS) Internal standard. (NG) Non-glycosylated.
| Sample | Other | NG | Intact |
|---|---|---|---|
| Adalimumab | 3.7 | 0.0 | 96.4 |
| Recombinant | 11.7 | 0.0 | 88.3 |
| Biosimilar | 5.5 | 0.0 | 94.5 |
References
- Adalimumab in the treatment of immune-mediated diseases, G Lapadula, A Marchesoni, A Armuzzi, C Blandizzi, R Caporali, S Chimenti, R Cimaz, L Cimino, P Gionchetti, G Girolomoni, P Lionetti, A Marcellusi, FS Mennini and C Salvarani, International Journal of Immunopathology and Pharmacology, 2014; 27:33–48.
- New 2016 data and statistics for global pharmaceutical products and projections through 2017, C Lindsley, ACS Chemical Neuroscience, 2017; 8:1635–36.
- Biosimilars already approved and in development, T Dörner, J Isaacs, J Gonçalves, V Azevedo, G CastañedaHernández, R Strohal and I McInnes, Considerations in Medicine, 2017; 1:7–12.