Analysis of Trastuzumab by Maurice
Introduction
Trastuzumab is a biological drug used to treat HER2- positive breast cancer, which accounts for 20-30% of all breast cancers1. It is one of the earliest antibody-based therapies available for cancer treatment. It was approved by the FDA in September 1998 and several biosimilars have already been approved2 .
Maurice icIEF Method
Carboxypeptidase B (CpB) treatment: Trastuzumab was diluted to 1.0 mg/mL in water prior to CpB digestion. CpB (1 mg/mL stock solution) was added at a ratio of 1:100 (CpB to sample) and incubated at 37 °C for 20 minutes and then placed on ice. CpB was obtained from Sigma-Aldrich (PN C9584).
Sample preparation: Trastuzumab was diluted to 0.2 mg/mL in the ampholyte solution.
Ampholyte solution: Pharmalytes 8–10.5 (3%) and 5–8 (1%) containing 3.2 M urea, 5 mM IDA and10 mM arginine.
pI markers: 5.85 and 10.17.
Running conditions: 1 minute at 1500 V, then 8 minutes at 3000 V.
Imaging: Absorbance and fluorescence.
Recombinant: The trastuzumab recombinant was acquired from R&D Systems, PN MAB9589.
Results
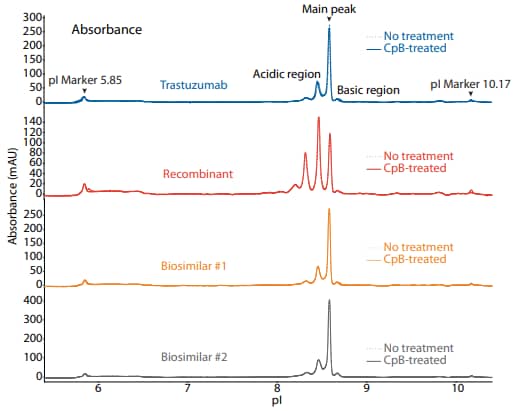
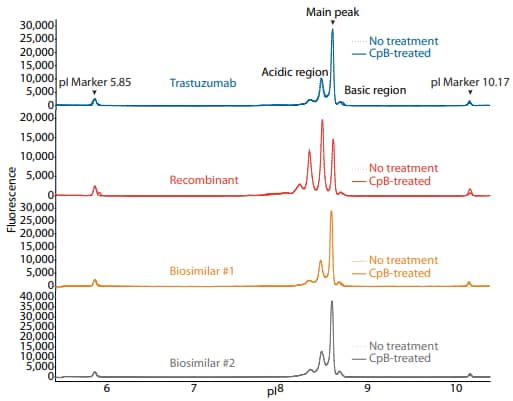
To compare trastuzumab to a recombinant and two biosimilars, we used the icIEF platform method described above to monitor charge heterogeneity by absorbance (Figure 1) and by native fluorescence (Figure 2) detection. These analyses revealed that the innovator, recombinant, and biosimilars are similar in charge heterogeneity and purity. To evaluate the presence of lysine variants, the antibodies were treated with CpB before analysis on icIEF. Treatment with CpB conferred a relatively small (<2%) decrease in the basic region peak area percentage (Figure 1, 2), suggesting that these samples do no contain a significant amount of terminal-lysine variants.

Figure 1. icIEF absorbance (top) and peak area percentages (bottom) of trastuzumab, a recombinant, and two biosimilars.
| Sample | Acidic Region | Main Peak | Basic Region | Δ Basic Region | |
|---|---|---|---|---|---|
|
Trastuzumab |
No treatment | 35.9 | 59.4 | 4.7 | N/A |
| CpB-treated | 36.7 | 60.0 | 3.3 | -1.4 | |
|
Recombinant |
No treatment | 73.7 | 23.7 | 2.5 | N/A |
| CpB-treated | 74.1 | 23.6 | 2.3 | -0.2 | |
|
Biosimilar #1 |
No treatment | 35.8 | 59.5 | 4.8 | N/A |
| CpB-treated | 36.3 | 60.2 | 3.5 | -1.3 | |
|
Biosimilar #2 |
No treatment | 36.3 | 58.9 | 4.8 | N/A |
| CpB-treated | 36.2 | 59.1 | 4.7 | -0.1 | |

Figure 2. icIEF fluorescence (top) and peak area percentages (bottom) of trastuzumab, a recombinant, and two biosimilars.
| Sample | Acidic Region | Main Peak | Basic Region | Δ Basic Region | |
|---|---|---|---|---|---|
|
Trastuzumab |
No treatment | 40.8 | 54.6 | 4.6 | N/A |
| CpB-treated | 40.6 | 56.5 | 2.9 | -1.7 | |
|
Recombinant |
No treatment | 75.8 | 22.2 | 2.0 | N/A |
| CpB-treated | 75.5 | 22.6 | 1.9 | -0.1 | |
|
Biosimilar #1 |
No treatment | 41.5 | 53.6 | 4.9 | N/A |
| CpB-treated | 41.0 | 55.4 | 3.5 | -1.4 | |
|
Biosimilar #2 |
No treatment | 49.5 | 45.7 | 4.9 | N/A |
| CpB-treated | 49.7 | 45.4 | 4.9 | -0.0 | |
Maurice CE-SDS Method
Sample preparation: Trastuzumab was diluted to 1 mg/mL with 1X Sample Buffer prior to treatment for 10 minutes at 70 °C in the presence of either 11.5 mM IAM (non-reducing) or 650 nM β-ME (reducing).
Running conditions: Samples were injected for 20 seconds at 4600 V, followed by a 25-minute separation (reducing) or a 35-minute separation (non-reducing) at 5750 V.
Results
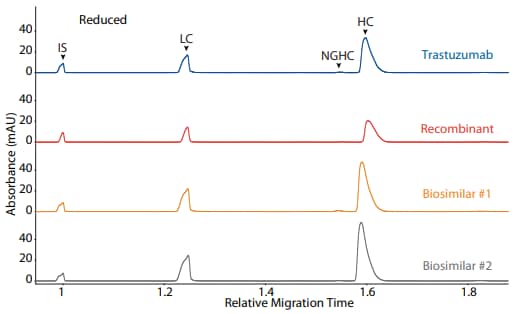
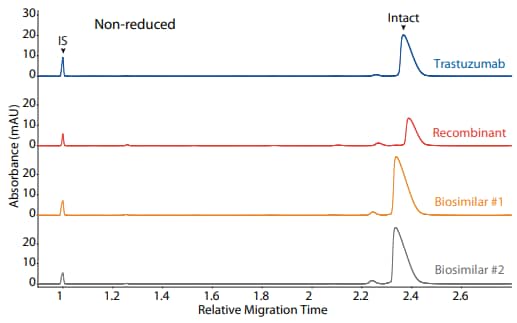
Trastuzumab, a recombinant, and two biosimilars were analyzed on the CE-SDS platform method described above under reducing (Figure 3) and non-reducing (Figure 4) conditions, resulting in comparable purity

Figure 3. CE-SDS reduced (top) and peak area percentages (bottom) of trastuzumab, a recombinant, and two biosimilars. (IS) Internal standard. (LC) Light chain. (NGHC) Non-glycosylated heavy chain. (HC) Heavy chain.
| Sample | LC | NGHC | HC | Other |
|---|---|---|---|---|
| Trastuzumab | 29.5 | 0.5 | 69.7 | 0.3 |
| Recombinant | 30.0 | 0.3 | 69.1 | 0.6 |
| Biosimilar #1 | 29.8 | 0.8 | 69.2 | 0.3 |
| Biosimilar #2 | 30.2 | 0.3 | 69.1 | 0.5 |

Figure 4. CE-SDS non-reduced (top) and peak area percentages (bottom) of trastuzumab, a recombinant, and two biosimilars. (IS) Internal standard. (NG) Non-glycosylated.
| Sample | Other | NG | Intact |
|---|---|---|---|
| Trastuzumab | 3.1 | 0.0 | 96.9 |
| Recombinant | 10.5 | 1.2 | 88.4 |
| Biosimilar #1 | 4.1 | 0.0 | 95.9 |
| Biosimilar #2 | 4.3 | 0.0 | 95.7 |
References
- The HER2 receptor in breast cancer: pathophysiology, clinical use, and new advances in therapy, Z Mitri, T Constantine and R O'Regan, Chemotherapy Research and Practice, 2012; 2012:743193.
- The arrival of biosimilar monoclonal antibodies in oncology: clinical studies for trastuzumab biosimilars, L Barbier, P Declerck, S Simoens, P Neven, A Vulto and I Huys, British Journal of Cancer, 2019; 121:199–210.