Guidelines on how to quantify RNAscope™ Fluorescent Assay Results
Introduction
Use the following guideline to quantify fluorescent signal from manual and automated RNAscope fluorescent assays (Cat. No. 323100 and 322800). We recommend you adopt the methodology described in this technical note using your preferred analysis software. For the latest service and support information, contact our technical services.
Note: The terminology used in the following procedure may differ from the terminology used in your software package.
Workflow
Part 1: Before You Begin
1. Ensure that staining is within the linear range based on exposure time (signal should not be oversaturated).
2. To compare staining intensity between samples, we recommend using the same TSA concentration and exposure time on all of your slides.
Part 2: Quantify Your Results
Count signal dots per ROI
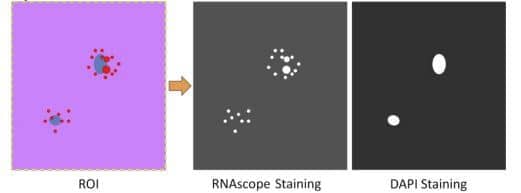
3. Analyze each fluorophore channel separately. Select the region of interest (ROI), or use the whole image as one ROI (Figure 1)

Figure 1. Analyzing each fluorescent channel separately
4. Measure Intensity of Background:
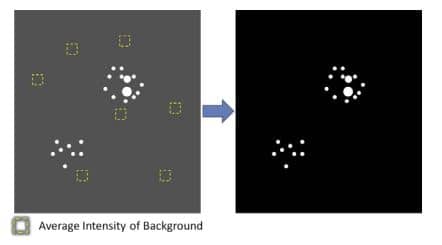
a. Select representative regions on slides containing no positive RNAscope staining, or on slides stained with only negative control probe. Measure the Integrate Intensity (Total Intensity) of the selected background regions. The selected regions should represent the true background. For example, when measuring staining in tissues with autofluorescence select regions containing autofluorescent tissues (Figure 2).
b. Calculate the Average Background Intensity (Average Intensity of Background per Pixel) using the following equation:
Average Background Intensity = ∑
c. (OPTIONAL) Subtract background: Use the software to subtract background or autofluorescence (Figure 2)

Figure 2. Average Background Intensity measurement and background subtraction
5. Quantify staining results consisting of discrete dots. Use the software to count the number of signal dots. After Average Background Intensity is measured, signal dots can be recognized as “Particles”, “Dots” or “Area with intensity greater than x” where x is the threshold value between signal and Average Background Intensity.
6. Quantify staining results consisting of clusters:
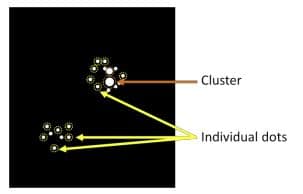
a. Quantify Average Intensity per Single Dot. First, select at least 20 single signal dots and measure the Area and Integrated Intensity (Total Intensity) of each dot (Figure 3). Use the Area of each dot to screen whether the dot is a true single dot. Then calculate the Average Intensity per Single Dot.
Average Intensity per Single Dot =


Figure 3. Selection of single dots to calculate Average Intensity per Single Dot b. Measure Total Area of ROI and Total Intensity of ROI, then use Average Intensity per Single Dot to calculate the Total Dot Number in ROI.

Count average signal dot number per cell
7. Count number of cells in ROI by counting DAPI positive nuclei.
8. Use the number of cells to calculate Average Dot Number per Cell

Count number of signal dots within one cell
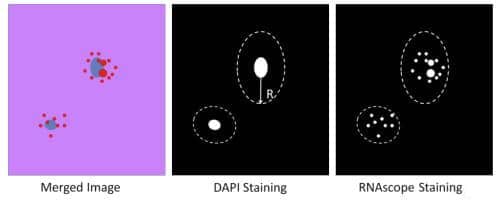
9. Use DAPI nuclear staining to define each cell region by assigning the radius of a cell. Assign each cell as one ROI.
10. Count dot number in each ROI using Steps 5 and 6

Figure 4. Counting the number of signal dots within one cell
Obtaining Support
For the latest services and support information, contact our Technical Services.
At the website, you can:
- Access telephone and fax numbers to contact Technical Support and Sales.
- Search through FAQs.
- Submit a question directly to Technical Support