High-Throughput Glycan Characterization Using Simple Western
Introduction
Glycan characterization is critical to the process of assessing a therapeutic protein’s quality, efficacy, and safety, and glycans must be monitored throughout the product’s life cycle. However, analysis of protein glycosylation can be a challenge due to the complexity of sugar structures and the expertise required for commonly used glycan analytical tools, such as HPLC and mass spectrometry. Additionally, modification of the protein via enzymatic digestion or chemical treatment to release or derivatize glycans are additional factors that must be taken into account upon final analysis and may even result in incomplete assessment if not all glycans are released or modified. Recently, lectin microarrays have been utilized to generate glycan profiles for a series of therapeutic proteins1. While this provides a method for quick screening of glycoproteins, there is no information on which charge isoforms contain the various glycan structures. Here we describe a novel, automated and high-throughput method to simultaneously screen for glycan profiles and charge or size heterogeneity on Peggy Sue™ (Figure 1). By combining both analytical methods in a single instrument, you can quickly screen for critical attributes of glycoproteins, including therapeutic antibodies, de facto creating Simple Western charge and size blots. We also show you how to screen glycan profiles of proteins separated by size on Wes™.
Workflow
Materials
ProteinSimple - A Bio-Techne brand
- Instruments: Peggy Sue and Wes
- XDR Charge Separation Master Kit for Peggy Sue (PN CBS2001)
- 12–230 kDa Wes Separation Module (PN SM-W004)
- Biotin Detection Module for Wes, Peggy Sue or Sally Sue (PN DM-004)
- Anti-Human IgG Detection Module for Wes, Peggy Sue or Sally Sue (PN DM-005)
- Premix G2, ampholyte-free separation gradient (PN 040-967)
- pI Standard Ladder 3 (PN 040-646)
- pI Standard, 9.7 (PN 040-790)
- cIEF 500 mM Arginine (PN 042-691)
- Wes Wash Buffer (PN 042-202)
- EZ Standard Pack 5 (PN PS-ST05EZ-8)
- Total Protein Detection Module for Wes, Peggy Sue or Sally Sue (DM-TP01)
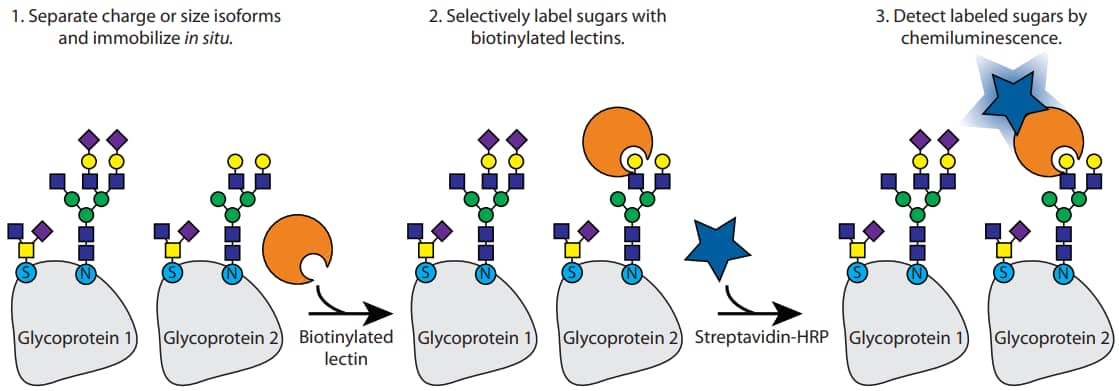
Figure 1. Schematic of glycoprotein detection on Peggy Sue using biotinylated lectins and streptavidin horseradish peroxidase (HRP). Protein isoforms are separated by charge or size, and then biotinylated lectins selectively bind carbohydrates displayed on the protein. Finally, bound lectins are detected by Streptavidin-HRP.
Other materials
- SERVALYT™ pI 2–11 and pI 7–9 (SERVA Electrophoresis GmbH , PN 42907.02 and 42900.02)
- Biotinylated Lectin Kits I & II (Vector Laboratories, PN BK1000 and BK-2100)
- Protein Deglycosylation Mix II (New England Biolabs, PN P6044) • PNGase F (New England Biolabs, PN P0704)
Samples
- All antibodies, Adalimumab (Humira®), Trastuzumab (Herceptin®) and NIST monoclonal antibody (RM 8671), were obtained from commercial sources. CandyCane™ Glycoprotein Molecular Weight Standards was purchased from Thermo Fisher Scientific (C21852).
Glycan Epitopes for Lectins
| Lectins | Glycan Epitope Selectivity |
|---|---|
| Concanavalin A (Con A) | High mannose, αMan, αGlc |
| Dolichos biflorus (DBA) | αGalNAc |
| Lens culinaris (LCA) | High Mannose, αMan, αGlc |
| Peanut (PNA) | Galβ3GalNAc |
| Phaseolus vulgaris Erythroagglutinin (PHA-E) | Galβ4GlcNAcβ2Manα6, Manβ4 |
| Phaseolus vulgaris Leucoagglutinin (PHA-L) | Galβ4GlcNAcβ6, Manα3 |
| Pisum sativum (PSA) | High Mannose, αMan, αGlc |
| Ricinus communis I (RCA I, RCA120) | Gal |
| Soybean (SBA) | α>βGalNAc |
| Ulex europaeus I (UEA I) | αFuc |
| Wheat germ (WGA) | GlcNAc |
TABLE 1. Lectins used in this technical note are part of the biotinylated lectin kits. Sugar Abbreviations: Fuc (L-Fucose), Gal (D-Galactose), GalNAc (N-Acetylgalactosamine), Glc (D-Glucose), GlcNAc (N-Acetylglucosamine), Man (Mannose).
Methods
The Simple Western charge and size lectin blots follow the standard default Peggy Sue and Wes protocols as listed on the product insert, where biotinylated lectins are used in place of the primary antibody. Detection of bound biotinylated lectins is achieved by using our Streptavidn HRP.
Method 1: Simple Western Charge Lectin Blot
- For sample separation, use 4% SERVALYT™ (3% pI 7–9, 1% pI 2–11) and 40 mM Arginine in G2 ampholyte free mix. All mAbs were tested at 1.0 µg/mL. Use pI Standard Ladder 3 (4.9, 6.0, 6.4, 7.0, 7.3) and pI Standard 9.7. For example, if the final sample volume is 200 µL and the protein sample stock concentration is 100 µg/mL: 1. Prepare Part 1: 150 µL G2 ampholyte free mix + 16 µl Arginine + 2 µL 2–11 SERVALYT + 6 µL pI 7–9 SERVALYT.
- Prepare Part 2: 20 µl DI water + 3 µL pI standard ladder 3 + 1 µL pI marker 9.7 + 2 µL protein sample.
- Then, mix part 1 and part 2. 2. For deglycosylation, treat samples at a 1 mg/mL final concentration with Protein Deglycosylation Mix II according to the manufacturer specifications. Incubate at 37 °C for 16 hours. As a negative control, treat samples identically, but leave out the Protein Deglycosylation Mix II and add Deglycosylation Mix Buffer 1 instead. 3. Set the focusing conditions to 50 minutes and 21000 MicroWatts or what is optimal for your protein of interest.
- Dilute all lectins to 20 µg/mL in Wes Wash Buffer (PN 042-202) and use as the primary antibody for 120 minutes.
- For glycan detection, use the ready-to-use (RTU) Streptavidin-HRP. For mAb detection, use the RTU Anti-Human IgG Secondary HRP antibody. Incubate for 60 minutes.
- Follow the default conditions for immobilization, probing and detection as outlined in the Peggy Sue product insert.
Method 2: Simple Western Size Lectin Blot
- For sample preparation, prepare the CandyCane sample at 40 μg/mL final concentration. Treat the NIST mAb at 100 µg/mL final concentration with PNGase F according to the manufacturer specifications. To create untreated samples, simply add water instead of PNGase F. For analysis of NIST mAb with Con A, dilute the sample further to 1 µg/mL in 0.1X Sample Buffer. Heat denature all samples at 95 °C for 5 minutes.
- Dilute the lectins to 20 μg/mL in Wes Wash Buffer (PN 042-202) and use in place of a primary antibody.
- Use the RTU Streptavidin-HRP as the secondary antibody.
- Follow the default conditions for immobilization, probing and detection as outlined in the Wes or Peggy Sue product inserts, except use Wash Buffer in place of Antibody Diluent 2 for blocking all samples probed with lectins.
Results
Method 1: Simple Western Charge Lectin Blot
Following the workflow described above, we characterized the glycan profile of NIST mAb on Peggy Sue. NIST mAb is known to be decorated with mannose, fucose and GalNAc2 . As expected, lectins that selectively bind to these sugars resulted in a chemiluminescent signal, whereas those specific to sugars not present on NIST mAb did not produce a signal (Figure 2). Interestingly, lectins that bind to mannose (Con A, PSA, and LCA) resulted in a separation profile similar to the peak profile produced when using the anti-Human IgG antibody or with direct detection (A280 nm) when running the NIST mAb on Maurice (data not shown), suggesting that mannose groups are present on all charge isoforms of the NIST mAb. Table 2 lists the relative peak area percentage for each lectin and antiHuman IgG antibody.
Next, we asked whether we can confirm the presence of sugars by treatment with deglycosylating enzymes. NIST mAb was treated with Protein Deglycosylation Mix II (New England Biolabs), and then analyzed on Peggy Sue. Detection by the anti-Human IgG antibody revealed a significant change in charge separation of NIST mAb, indicating enzymatic deglycosylation had a significant effect on its molecular structure, causing changes in the charge isoforms. Detection by lectins that specifically bind mannose resulted in no observable signal, suggesting that mannose was completely removed (Figure 3). Furthermore, lectins that bind other sugars revealed diminished peaks or new peaks, likely due to incomplete deglycosylation. As a control, NIST mAb, treated identically but lacking enzymes, had little to no change in the charge separation profile (Figure 4), strongly indicating that these changes are due primarily to the enzymatic removal of glycans and are not the result of heat treatment. Table 3 lists the change in peak area percentage for each lectin and anti-Human IgG antibody after heat treatment.

Figure 2. Lectins and anti-Human IgG antibody peak profiles of NIST mAb.
| Detection Method | Main Peak (%) | Acidic 1 (%) | Acidic 2 (%) | Basic (%) |
|---|---|---|---|---|
| Anti-Human IgG antibody | 71.4 | 20.2 | 1.8 | 6.6 |
| Con A | 76.0 | 18.2 | 0.3 | 5.5 |
| LCA | 83.2 | 14.2 | 0 | 2.5 |
| PSA | 84.6 | 13.1 | 0 | 2.3 |
| UEA I | 80.6 | 19.4 | ND | ND |
| DBA | 77.0 | 17.9 | 0 | 5.1 |
| WGA, PNA, SBA, PHA-L, PHA-E, RCA120 | ND | ND | ND | ND |
TABLE 2. The relative distribution of peak area (%) for each lectin and anti-Human IgG antibody screened against NIST mAb. ND = no detectable signal.
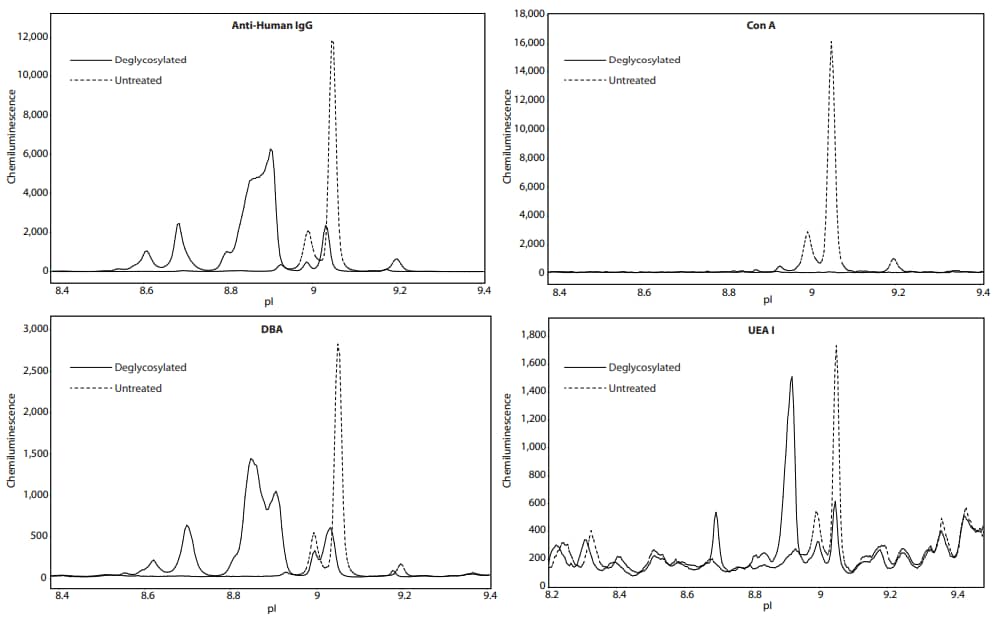
Figure 3. Deglycosylation treatment (solid line) versus no treatment (dashed line) of NIST mAb shows a decrease in signal for the lectins that bind mannose, Con A, PSA, and LCA (PSA/LCA data not shown), suggesting complete removal of mannose groups. Additional peaks appear in the anti-Human IgG, DBA, and UEA I profiles with treatment, likely due to incomplete deglycosylation.

Figure 4. Incubation of NIST mAb at 37 °C does not significantly change the charge separation or lectin binding profiles. Shown is the peak pattern of NIST mAb after overnight incubation at 37 °C (solid line) versus the no-treatment control (dashed line). The NIST mAb was detected with anti-Human IgG (left panel) and Con A (right panel). The NIST mAb peak distribution changed minimally when probed with the other lectins (Table 3).
| Detection Method | Main Peak (% Change) | Acidic 1 (% Change) | Acidic 2 (% Change) | Basic (% Change) |
|---|---|---|---|---|
| Anti-Human IgG antibody | 2.3 | -1.5 | 0.8 | -1.5 |
| Con A | 0.5 | -0.4 | 0.8 | -0.9 |
| LCA | 2.3 | -2.4 | 0 | 0.2 |
| PSA | 2.8 | -2.4 | 0 | 0.2 |
| UEA I | -7.2 | 7.2 | ND | ND |
| DBA | -0.4 | 1.6 | 0 | -1.2 |
TABLE 3. Minimal change in relative percent peak area for NIST mAb incubated at 37 °C shows that heat treatment does not affect NIST mAb lectin binding profile. ND = no detectable signal. Note that no signal was detected with UEA I of the acidic 2 and basic peaks even in untreated sample (Table 2).
To test whether this assay can be used to characterize the glycan-charge profile of commercially-available therapeutic monoclonal antibodies, we analyzed Humira® and Herceptin® using the same method as described above. These results reveal the distribution of specific sugar groups among the charge isoforms (Figure 5, 6) that agree with previous studies3,4. The distribution of relative peak percentages produced by each lectin and the antiHuman IgG antibody are summarized in Tables 4 and 5.
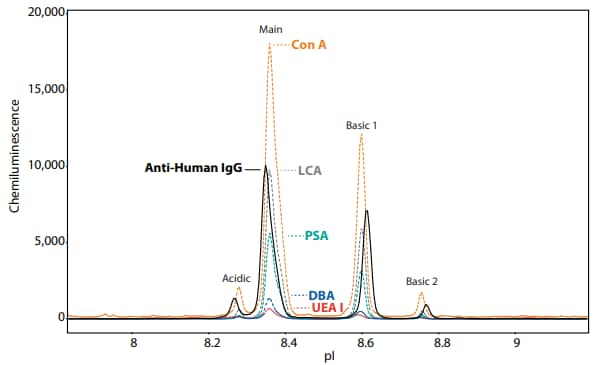
Figure 5. The lectin binding profiles for Humira show varying distributions for high mannose (Con A, LCA, PSA) and fucose (UEA I) in separated peaks when comparing to the anti-Human IgG peak profile. Table 4 lists the relative distribution of peak area (%) for each lectin screened against Humira. Humira® is a registered trademark of AbbVie.
| Detection Method | Main Peak (%) | Acidic (%) | Basic 1 (%) | Basic 2 (%) |
|---|---|---|---|---|
| Anti-Human IgG antibody | 60 | 6 | 31 | 3 |
| Con A | 60.6 | 4.3 | 32.3 | 2.8 |
| LCA | 65.8 | 2.3 | 30.4 | 1.5 |
| PSA | 66.8 | 1.6 | 30.3 | 1.3 |
| UEA I | 55.5 | 14.2 | 24.2 | 6.0 |
| DBA | 68.5 | 5.2 | 23.2 | 3.1 |
TABLE 4. The relative distribution of peak area (%) for each lectin screened against Humira.
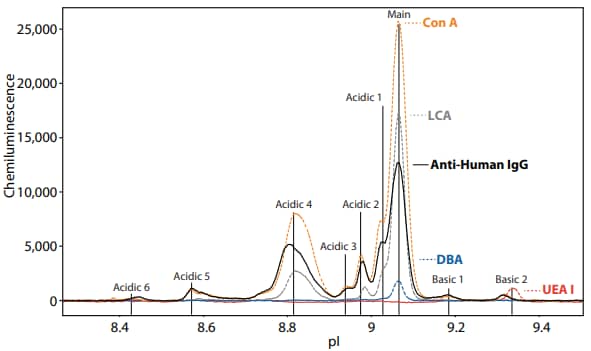
Figure 6. The lectin binding profile for Herceptin. Herceptin® is a registered trademark of Genentech. Table 5 lists the relative distribution of peak area (%) for each lectin screened against Herceptin.
| Detection Method | Main Peak (%) | Acidic 1 (%) | Acidic 2 (%) | Acidic 3 (%) | Acidic 4 (%) | Acidic 5 (%) | Acidic 6 (%) | Basic 1 (%) | Basic 2 (%) |
|---|---|---|---|---|---|---|---|---|---|
| Anti-Human IgG antibody | 42.7 | 9*.8 | 6.9 | 3.6 | 29.6 | 3.5 | 0.9 | 1.7 | 1.2 |
| Con A | 53.3 | 9.1 | 5.4 | 2.1 | 26.3 | 1.8 | 0.3 | 0.7 | 0.8 |
| LCA | 72.6 | 7.4 | 3.5 | 0 | 16.1 | 0.3 | 0 | 0 | 0 |
| UEA I | 54.6 | 7.4 | 5.2 | 6.8 | 2.6 | 13.1 | 9.8 | 0.4 | 0 |
| DBA | 91.6 | 8.4 | 0 | 0 | 0 | 0 | 0 | 0 | 0 |
TABLE 5. The relative distribution of peak area (%) for each lectin screened against Herceptin.
Method 2: Simple Western Size Lectin Blot
The results presented so far have shown how Simple Western can characterize glycan profiles after charge isoform separation by isoelectric focusing. To demonstrate the utility of the lectin assay on size separation, we analyzed a commercially available mix of glycosylated and non-glycosylated proteins on Wes. Four of the eight proteins in the CandyCane MW Standard (Thermo Fisher Scientific) contain high mannose. When CandyCane was analyzed on Wes with biotinylated Con A, which detects high mannose, we observed four peaks at sizes that correlate with the expected size of the four mannosecontaining proteins, α2-macroglobulin, glucose oxidase, α1-acid glycoprotein and avidin (Figure 7A). A comparison to the CandyCane product insert confirms that lectin blots on Simple Western Size are equivalent to traditional lectin blots (Figure 7B).
Similar to the way the Simple Western charge lectin blot allows for the identification of glycans attached to charge isoforms of therapeutic antibodies as described above, the Simple Western size lectin blot allows for the identification of glycans attached to size variants of antibodies, including the heavy chain and light chain under reducing conditions. In our analysis of NIST mAb, for example, Con A and WGA recognized the heavy chain and to a lesser extent the light chain, suggesting that these glycans are attached preferentially to the heavy chain of the antibody (Figure 8). As a control, all protein in the sample was detected with the Total Protein Kit. As expected, binding of Con A and WGA was eliminated when NIST mAb was treated with PNGase F. These results demonstrate how Simple Western allows you to easily monitor glycosylation patterns without the need for orthogonal analysis techniques that are complex, costly and time-consuming2.

Figure 7. (A) Binding profile of Con A to the CandyCane glycoprotein standards containing mannose. (B) Comparison of Wes data to the CandyCane product insert. Listed are the four glycoproteins detected detected by Con A in Simple Western (left) and by a glycoprotein stain (right).
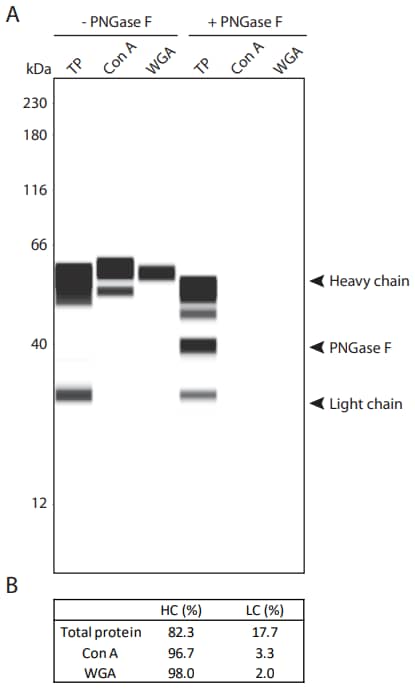
Figure 8. Lectin-glycan and total protein (TP) characterization of NIST mAb under reducing conditions. (A) Lane view. The EZ Standard Pack 5 was used to avoid cross-reactivity of Streptavidin-HRP at 230 kDa. (B) Heavy chain (HC) and light chain (LC) peak area percentages of glycosylated NIST mAb.
Conclusion
Glycan profiling is vital to the characterization of therapeutic antibodies; however, the standard methods used for this can be complex and require manipulation of the antibody being analyzed. Here we present the use of Simple Western as a lectin blot to quickly analyze glycan profiles of antibodies and glycoproteins separated by charge isoform or molecular weight, and our data agree with their known glycosylation properties. These results demonstrate that glycan characterization is possible on Simple Western by both charge and size separation. Peggy Sue allows for lectin blot analysis of antibodies in their native format to be compared to the charge heterogeneity profile in a single Simple Western Charge assay due to Peggy Sue’s high-throughput capabilities. Additionally, Simple Western Size assays on Wes can be used to analyze glycan isoforms of proteins based on molecular weight. Simple Western lectin blots could be used as a quick screening method in antibody development and as a complementary tool to traditional methods for glycan analysis.
References
- The use of lectin microarray for assessing glycosylation of therapeutic proteins, L Zhang, S Luo and B Zhang, mAbs, 2016; 8(3):524–35.
- Orthogonal technologies for NISTmAb N-glycan structure elucidation and quantitation, J Prien, H Stöckmann, S Albrecht, S Martin, M Varatta, M Furtado, S Hosselet, M Wang, T Formolo, P Rudd and J Schiel, Stateof-the-Art and Emerging Technologies for Therapeutic Monoclonal Antibody Characterization Volume 2. Biopharmaceutical Characterization: The NISTmAb Case Study, 2015; 1201:185–235.
- Assessing analytical similarity of proposed Amgen biosimilar ABP 501 to adalimumab, J Liu, T Eric, C Li, S Cao and S Kuhns, BioDrugs, 2016; 30(4):321–38.
- Challenges of glycosylation analysis and control: an integrated approach to producing optimal and consistent therapeutic drugs, P Zhang, S Woen, T Wang, B Liau, S Zhao, C Chen, Y Yang, Z Song, M Wormald, C Yu and P Rudd, Drug Discovery Today, 2016; 21(5):740–65.