Method Transfer between Maurice and Peggy Sue
Introduction
Capillary isoelectric focusing (cIEF) is routinely used to monitor protein purity, stability and charge heterogeneity. Imaged capillary isoelectric focusing (icIEF) has emerged as the gold standard for quantitative protein charge heterogeneity monitoring and characterization. Instrumentation based on icIEF like ProteinSimple’s Maurice™ relies on the inherent UV absorption and native fluorescence of proteins for direct detection. This is ideally suited for charge profiling in late stages of process development that typically analyze fully or partially purified proteins in regulated environments.
For earlier stages in process development, characterization of charge distribution under conditions that are less well defined, such as crude cell extracts, is desirable because it enables fast clone selection and formulation screens1 . ProteinSimple’s Peggy Sue™ combines icIEF separation with enzyme-amplified immunodetection. With approximately 500 times greater sensitivity than direct UV absorption detection, crude samples can be directly analyzed without any pre-treatment. The high specificity, sensitivity, and throughput of this system is ideal for inprocess analysis, as rapid charge characterization without any sample pre-treatment is useful in product process optimization for the biopharma industry.
When utilizing Peggy Sue and Maurice as analytical techniques in tandem, users can obtain comparable charge separation profiles in samples from early stages of product development and to later stages of purified samples. Thus, easy method transferability between these platforms will enable protein monitoring that covers the entire protein therapeutic development pipeline, from target discovery to QC release and stability (Figure 1).
In this protocol, we show you that, with a little optimization, methods can easily be transferred from Maurice to Peggy Sue and vice versa. We provide two examples of chemical conditions optimized for maximum resolution of (1) a therapeutic mAb with a high pH gradient and (2) a reagent-grade mAb with a neutral pH gradient. The conditions defined below can be used without modification to create split Maurice and Peggy Sue samples for parallel analysis.
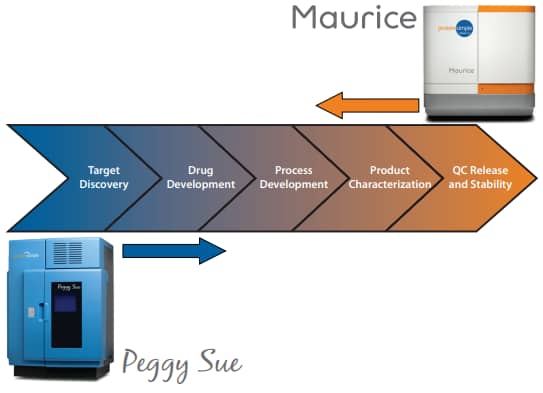
Figure 1. Coupling Peggy Sue and Maurice icIEF enables protein monitoring throughout the entire protein therapeutic development pipeline.
General Remarks
There are only a few minor adjustments that need to be made when running Maurice samples on Peggy Sue:
- Sample mixes are essentially prepared to be run on Maurice, but are diluted 100X before analysis on Peggy Sue.
- Fluorescent Peggy Sue pI markers must be added to the sample mix because the unlabeled Maurice pI markers are not detected by Peggy Sue.
- Since the final sample is different compared to the optimized Peggy Sue ampholyte Premix G2 Separation Gradients, the focusing speed and electroosmotic flow (EOF) will likely be higher. Thus, focusing times that are shorter than default are typically needed on Peggy Sue when Maurice icIEF reagents are used, which will require some optimization.
Workflow
Materials
Instruments
- ProteinSimple Maurice and Peggy Sue
Maurice Consumables
- Maurice cIEF Method Development Kit (PN PS-MDK01-C)
- Maurice cIEF Cartridge (PN PS-MC02-C)
Peggy Sue Consumables
- Premix G2, Pharmalyte pH 5–8 separation gradient (PN 040-973)
- Premix G2, ampholyte-free separation gradient (PN 040-967)
- pI Standard Ladder 1 (PN 040-644)
- pI Standard Ladder 3 (PN 040-646)
- pI Standard, 8.4 (PN 041-036)
- pI Standard, 9.7 (PN 040-790)
- Anti-Human IgG Detection Module (PN DM-005)
- Capillaries - Charge Separation (PN CBS701)
Samples
- NIST mAb (RM8671, Lot #14HB-D-002)
- Maurice CE-SDS IgG Standard (046-039)
Method 1: High pH Gradient with High Resolution
Therapeutic humanized antibodies typically have a high isoelectric point and require the use of basic narrow range gradients for maximal resolution. In this example, the NIST mAb2 is analyzed under the high pH gradient condition.
Step 1. Prepare the IEF Master Mix
To achieve maximum resolution for a high pH gradient, we used Pharmalytes pH 8–10.5 and pH 3–10 at a ratio of 85:15. The Peggy pI Standard Ladders 1 or 3 are suitable for a high pH gradient, and Peggy pI markers 8.4 and 9.7 should be supplemented. If the pI of the molecule is higher than 8.5, a final concentration of 10 mM arginine should be added to block the basic end of the pH gradient.
The strategy here is to allow sufficient available volume in the mix for additional additives, like urea, if necessary. (See the Simple Western IEF Assay Development Guide for recommendations on final urea concentration).
As an example, the IEF Master Mix in Table 1 will allow for up to 500 µL of prepared sample.
| In Maurice Method Development Kit (PS-MDK01-C) | Peggy Sue Charge Reagents | |||||
|---|---|---|---|---|---|---|
| 1% Methyl Cellulose | 500 mM Arginine | Pharmalytes 8–10.5 | Pharmalytes 3–10 | pI Standard Ladder 1 | pI Standard 8.4 | pI Standard 9.7 |
| 162 µL | 9 µL | 15 µL | 2.5 µL | 8 µL | 1.8 µL | 1.8 µL |
TABLE 1. IEF Master Mix example.
Step 2. Prepare the Maurice sample by combining:
- 44 parts of IEF Master Mix
- 56 parts of analyte
To prepare the analyte, 2.5 µL NIST mAb stock (10 mg/mL) was diluted in 53.5 µL of water.
Step 3. Prepare the Peggy Sue split sample by combining:
- 44 parts of IEF Master Mix
- 55 parts water
- 1 part Maurice sample
Running split samples when optimizing focusing time will help ensure a similar profile is achieved.
Results
Optimizing the focusing time on Peggy Sue
Because sample preparation for Maurice and Peggy Sue are different, focusing speed and EOF are expected to be higher. Therefore, different focusing times should be tested. This is easily done in one run on Peggy Sue by testing a different focusing time in each cycle. In this example, a focusing time of 20 minutes was chosen for further analysis of NIST mAb on Peggy Sue using Maurice reagents (Figure 2). NIST mAb was detected using the Anti-Human IgG Detection Module (DM-005).
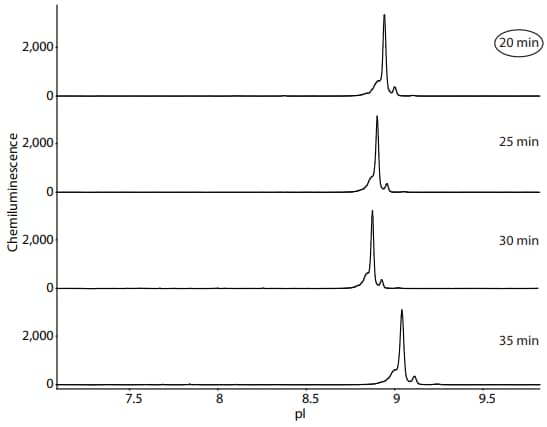
Figure 2. Optimization of NIST mAb focusing time on Peggy Sue using Maurice reagents. Detection of NIST mAb was performed using the Anti-Human IgG Detection Module (DM-005) and default immunoassay conditions. On Peggy Sue, the pI standards are detected in the fluorescence channel and thus do not appear in these electropherograms. A focusing time of 20 minutes was chosen for further analysis of NIST mAb on Peggy Sue using Maurice reagents.
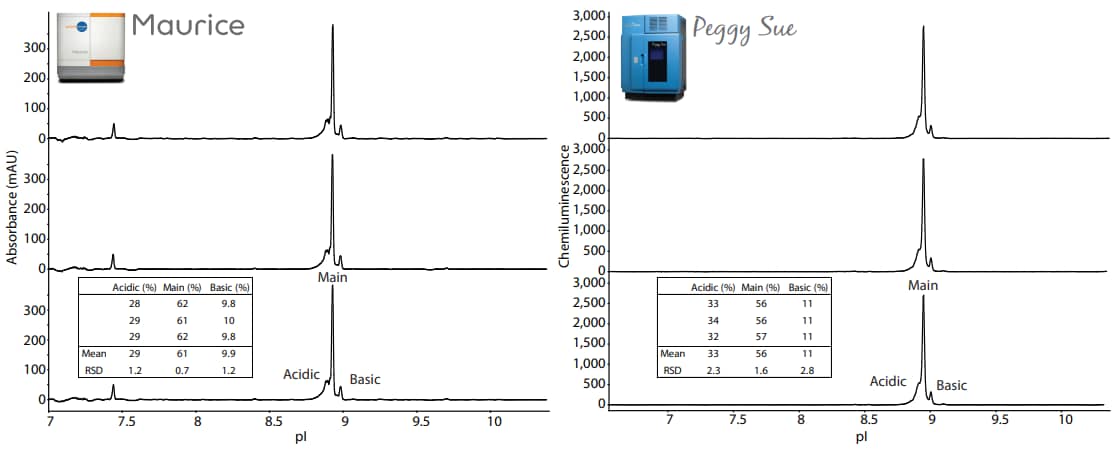
Figure 3. Three injections of the Maurice sample in Maurice reagents run on Maurice (left panel) and three capillaries of the Peggy Sue sample in Maurice reagents on Peggy Sue (right panel). The embeded tables show the peak area percentages of each replicate. The focusing time on Peggy Sue was set to the optimal condition of 20 minutes. Detection of NIST mAb was performed on Peggy Sue using the Anti-Human IgG Detection Module (DM-005) and default immunoassay conditions. In the Maurice injections in the left panel, minor peaks detected at pI 7.3, 8.4, and 9.7 represent the Peggy Sue pI standards.
Comparing Peggy Sue and Maurice charge separation profiles
The samples were analyzed in triplicate on Maurice and Peggy Sue. The electropherograms from these samples resulted in very similar charge separation profiles (Figure 3). The peak area percentages for the acidic, main and basic peak for each replicate are listed in the embedded tables.
Determining pH gradient linearity around pH 8-10 range
To confirm that your assay has been successfully optimized for Peggy Sue, you should determine the pH gradient linearity of the high pH range generated by the Pharmalyte mixture on the Peggy Sue by plotting the peak position by the pI. A strong linear relationship between peak position and pI means you can be confident in the apparent pI of each peak in your sample. In this case, a strong linear correlation was achieved between peak position and pI around pH 8–10 (Figure 4).
Evaluating reproducibility of the peak area percentage
To confirm that your assay has been successfully optimized for Peggy Sue, we recommend testing the reproducibility of the charge separation profile by performing multiple runs over several days. We show in Figure 5 that the NIST mAb separation pattern can be divided into three peaks labeled acidic, main and basic. To evaluate the reproducibility of the peak area percentage, three replicates were performed each day for three days. The peak area percentages of the three peaks for each replicate are listed in Figure 5. The relative standard deviations (RSDs) for each peak are as expected when compared with historical iCE/Maurice results (as seen in the Improving Charge Variant Analysis with Maurice Native Fluorescence application note).
Method 2: Neutral pH Gradient with High Resolution
Other antibodies, like those of murine origin, may have a lower isoelectric point and require the use of neutral range gradients for maximal resolution. ProteinSimple's Maurice CE-SDS IgG Standard (PS IgG, 046-039) is used here as the example for neutral pH gradient condition.
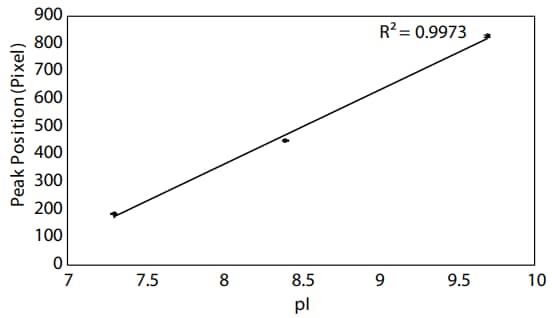
Figure 4. pH gradient linearity around pH 8–10 on Peggy Sue. Data are the averages of results from three replicates, and error bars represent the standard errors of the mean.
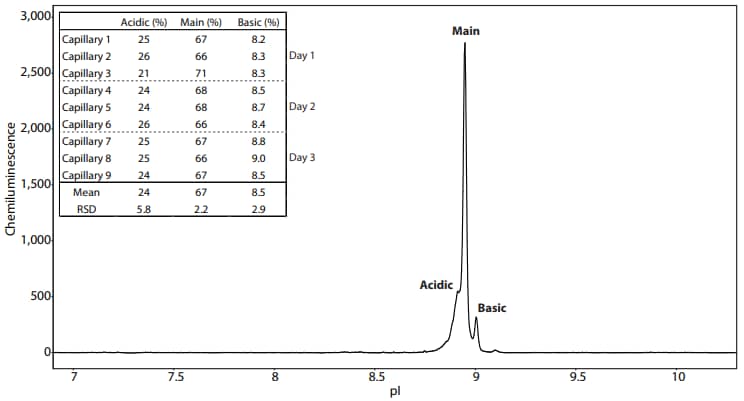
Figure 5. Reproducibility of the NIST mAb peak area percentage separated on Peggy Sue using Maurice reagents. The NIST mAb separates into three peaks labeled as acidic, main, and basic. The table lists the peak percentage of three capillaries performed each day over the course of three days.
Step 1. Prepare the IEF Master Mix
To achieve maximum resolution under a neutral pH gradient, we used Pharmalytes pH 5–8 and pH 3–10 at a ratio of 3:1. The Peggy pI Standard Ladders 1 or 3 are suitable for a neutral pH gradient. The strategy here is to allow sufficient available volume in the mix for additional additives, like urea, if necessary. (See the Simple Western IEF Assay Development Guide for recommendations on final urea concentration).
As an example, the IEF Master Mix in Table 2 will allow for up to 500 µL of prepared sample.
| In Maurice Method Development Kit (PS-MDK01-C) | Peggy Sue Charge Reagent | ||
|---|---|---|---|
| 1% Methyl Cellulose | Pharmalytes 3–10 | Pharmalytes 5–8 | pI Standard Ladder 1 |
| 172 µL | 5 µL | 15 µL | 8 µL |
TABLE 2. IEF Master Mix example.
Step 2. Prepare the Maurice sample by combining:
- 44 parts of IEF Master Mix
- 56 parts of analyte
To prepare the analyte, the content of the PS IgG vial was dissolved in 25 µL of 0.1X PBS to make a 2 mg/mL stock solution.
Step 3. Prepare the Peggy Sue split sample by combining:
- 44 parts of IEF Master Mix
- 55 parts water
- 1 part Maurice sample
Running split samples when optimizing focusing time will help ensure a similar profile is achieved.
Results
Optimizing the focusing time on Peggy Sue
Different focusing times should be tested to find one that is optimal for your sample of interest. In this example, a focusing time of 35 minutes was chosen for further analysis of PS IgG on Peggy Sue using a sample prepared with Maurice reagents (Figure 6).
Comparing Peggy Sue and Maurice charge separation profiles
The samples were analyzed in triplicate on Maurice and Peggy Sue. The electropherograms from these samples resulted in very similar charge separation profiles (Figure 7). The peak area percentages for each replicate are listed in the embedded tables.
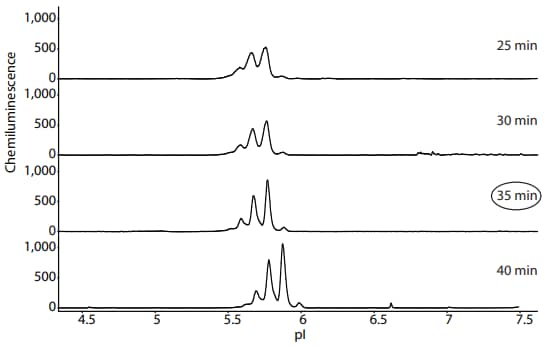
Figure 6. Optimization of PS IgG focusing time on Peggy Sue when using Maurice reagents. Detection of PS IgG was performed using Anti-Mouse Detection Module (DM-002) and default immunoassay conditions. On Peggy Sue, the pI standards are detected in the fluorescence channel and thus do not appear in these electropherograms. A focusing time of 35 minutes was chosen for further analysis of PS IgG on Peggy Sue using Maurice reagents.
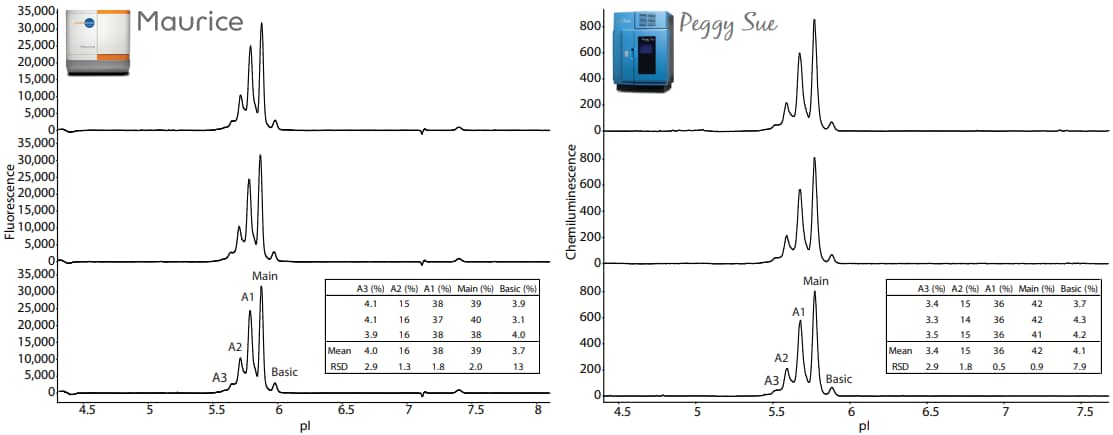
Figure 7. Three injections of the Maurice sample in Maurice reagents run on the Maurice (left panel) and three capillaries of the Peggy Sue split sample in Maurice reagents run on the Peggy Sue (right panel). The embeded tables show the peak area percentages of each replicate. The focusing time on Peggy Sue was set to the optimal condition of 35 minutes. Detection of PS IgG was performed on Peggy Sue using Anti-Mouse Detection Module (DM-002) and default conditions.
Determining pH gradient linearity around pH 5–8 range
To confirm that your assay has been successfully optimized for Peggy Sue, we recommend determining the pH gradient linearity of the neutral pH range generated by the Pharmalyte mixture on the Peggy Sue by plotting the peak position by the pI. A strong linear relationship between peak position and pI means you can be confident in the predicted pI of each peak in your sample. In this case, a strong linear correlation was achieved between peak position and pI around pH 5–8 (Figure 8).
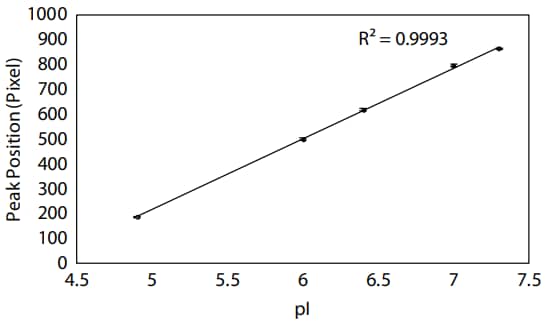
Figure 8. pH gradient linearity around pH 5–8 on Peggy Sue. Data are the averages of results from three replicates, and error bars represent the standard errors of the mean.
Evaluating reproducibility of the peak area percentage
We show the reproducibility of the charge separation profile by performing multiple replicates over several days. The PS IgG separation pattern is divided into five peaks (A1, A2, A3, Main and B1) as shown in Figure 9. To evaluate the reproducibility, three replicates on Peggy Sue were performed each day for three days, and the resulting percentages of each peak are listed in Figure 9. The RSDs for each peak are as expected when compared with historical iCE/Maurice results (as seen in the Improving Charge Variant Analysis with Maurice Native Fluorescence application note).
Method 3: Transferring Methods from Peggy Sue to Maurice
For Peggy Sue users wanting to transfer methods to Maurice, Peggy Sue reagents, including Peggy Sue markers, can be used to prepare samples for Maurice. Maurice electrolytes and default focusing times should be used. However, due to the sensitivity differences between the instruments, the Maurice sample concentration should be 100-fold higher than Peggy Sue (200 µg/mL for Maurice and 2 µg/mL for Peggy Sue). Also, due to the difference in ampholyte matrices, the injection time on Maurice should be extended from 55 seconds to 90 seconds. As a proof of concept, Figure 10 shows PS IgG in Peggy Sue reagents run on Maurice. As expected, the results are similar to PS IgG in Maurice reagents run on Maurice as shown in the inset.
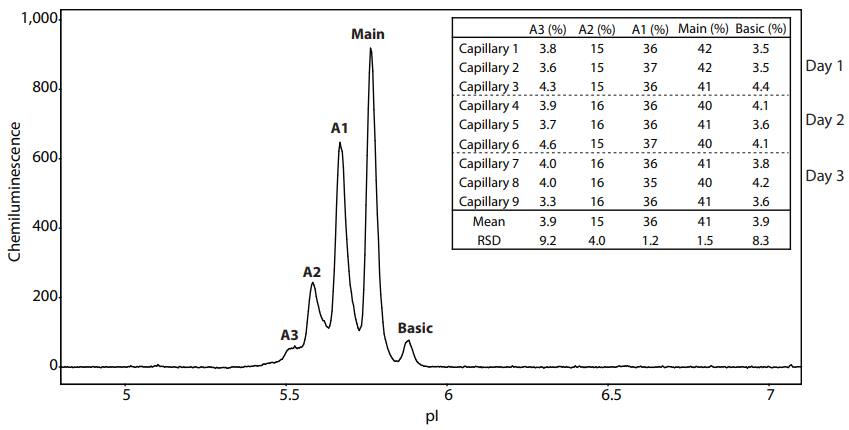
Figure 9. Reproducibility of the PS IgG peak area percentage separated on Peggy Sue using Maurice reagents. The PS IgG separation pattern consists of five peaks: three acidic peaks labeled A1-A3, a main peak, and a basic peak. The table lists the peak area percentages of three capillaries performed each day over the course of three days.
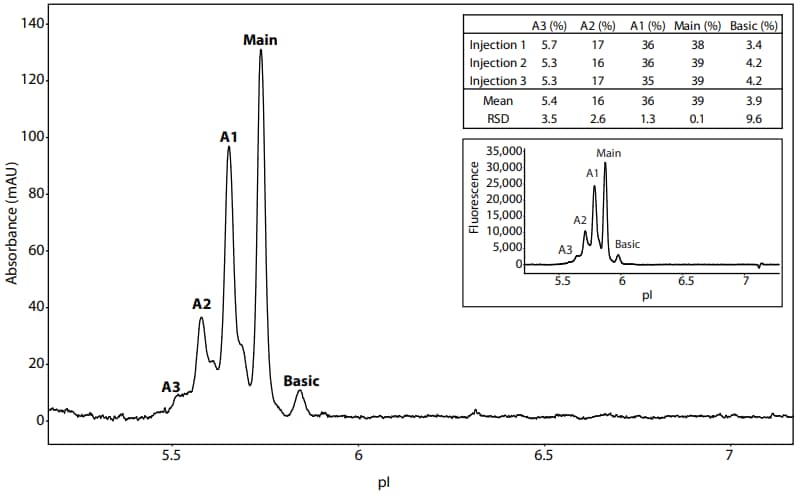
Figure 10. PS IgG in Peggy Sue reagents separated on Maurice. PS IgG (200 µg/mL) was diluted in 4% Pharmalytes (Peggy Sue G2 5-8) and 4 M urea. The antibody was focused for 1 minute at 1.5 kV and then for 12 minutes at 3 kV. The table lists the peak area percentages of three injections. For comparison, the inset shows PS IgG in Maurice reagents run on Maurice.
Conclusion
The method transfer between Maurice and Peggy Sue and vice versa is straightforward and requires only minor modifications in sample preparation and focusing time. Once the focusing time has been optimized, split samples can be run on Maurice and Peggy Sue to give results with high comparability and reproducibility. This enables you to analyze proteins by their absorbance and native fluorescence in addition to chemiluminescent enzyme-linked detection in parallel. Here we successfully applied this parallel analysis strategy on two monoclonal antibodies with very different properties. In doing so, the separation profiles of both molecules from Peggy Sue matched those obtained on Maurice, with no observable compromise in resolution. This helps you get the most out of your instruments by broadening the sample types to include those that require enzyme-linked detection, like crude or partially purified samples which are typically found early in the protein therapeutic development pipeline.
References
- Charge heterogeneity of monoclonal antibodies by multiplexed imaged capillary isoelectric focusing immunoassay with chemiluminscence detection, D Michels, A Tu, W McElroy, D Voehringer and O SalasSolano, Analytical Chemistry, 2012; 84(12):5380-86.
- Separation methods and orthogonal techniques, D Michels, A Ip, T Dillon, K Brorson, S Lute, B Chavez, K Prentice, L Brady and K Miller, State-of-the-Art and Emerging Technologies for Therapeutic Monoclonal Antibody Characterization Volume 2. Biopharmaceutical Characterization: The NISTmAb Case Study, 2015; 237-84.