Using CellProfiler to Analyze RNAscope™ and BaseScope™ Data
Introduction
This Technical Note provides guidelines for performing quantitative image analysis with CellProfiler on in situ- hybridized (ISH) slides that have been processed using the RNAscope™ or BaseScope™ assays. You can use CellProfiler to analyze singleplex, duplex, and fluorescent multiplex images. Download CellProfiler from https://cellprofiler.org.
Apply the CellProfiler analysis workflow demonstrated in this Technical Note into larger workflows to analyze large images.
Note: CellProfiler has limited capability with handling large, high-resolution images. We recommend using a field of view limited to a maximum number of two gigapixels in (x,y) to count cells and punctate dots present within cell boundaries. To perform whole slide image (WSI) analysis using your CellProfiler pipeline, Glencoe sells a plugin to allow you to interface CellProfiler with the open source platform QuPath. The plugin works through the OMERO + platform.
Information on this plugin can be found by contacting Glencoe through their webpage: https://www.glencoesoftware.com/contact/. Other open source options to perform whole slide image (WSI) analysis include QuPath, Orbit, and SlideToolkit.
Workflow
Below is an example of a chromogenic RNAscope™ image stained with one probe in red. We will use this image to demonstrate image analysis using CellProfiler.
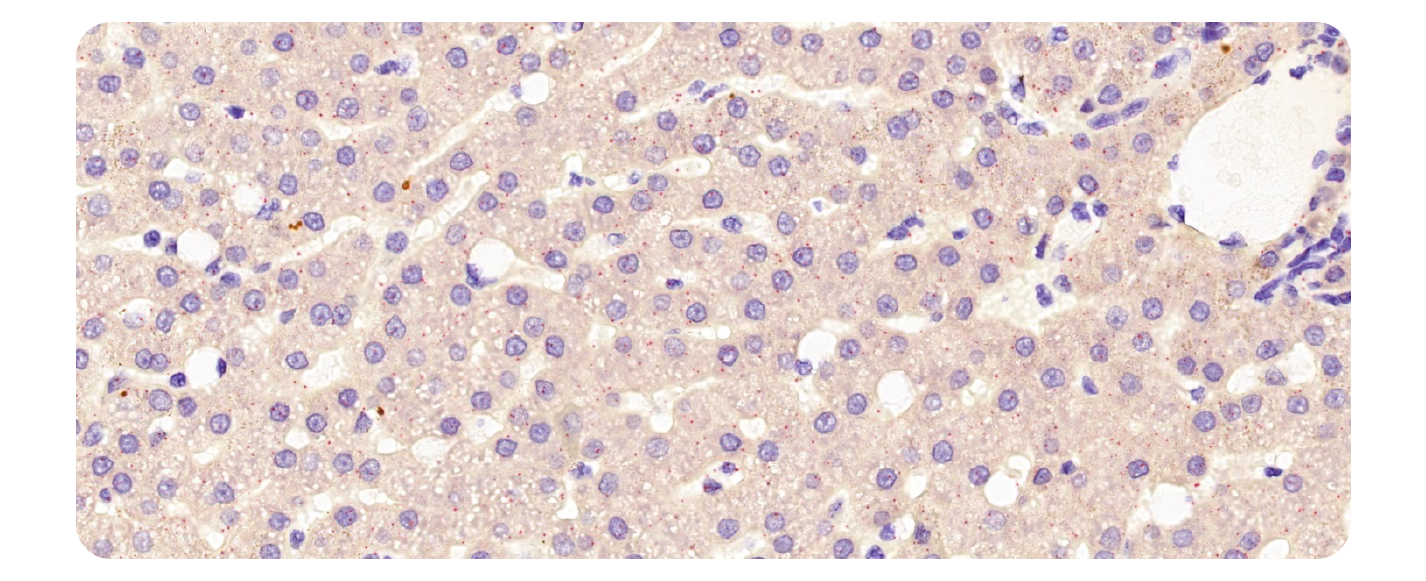
Figure 1. Singleplex image example
Part 1: Build the Pipeline Workflow
- Open CellProfiler. The primary user interface pre-loads with the first four modules of a pipeline (left panel):
- Images
- Metadata
- NamesAndTypes
- Groups

Figure 2. CellProfiler interface
Note: CellProfiler opens in three separate windows (see Figure 2), including a welcome page that includes many helpful links. Explore the help available in the manuals, tutorials and demos, and participate in the Q&A forum to answer specific questions.
2. Select the Images module, then drag the image you want to analyze into the right panel while the module is active (see Figure 3).
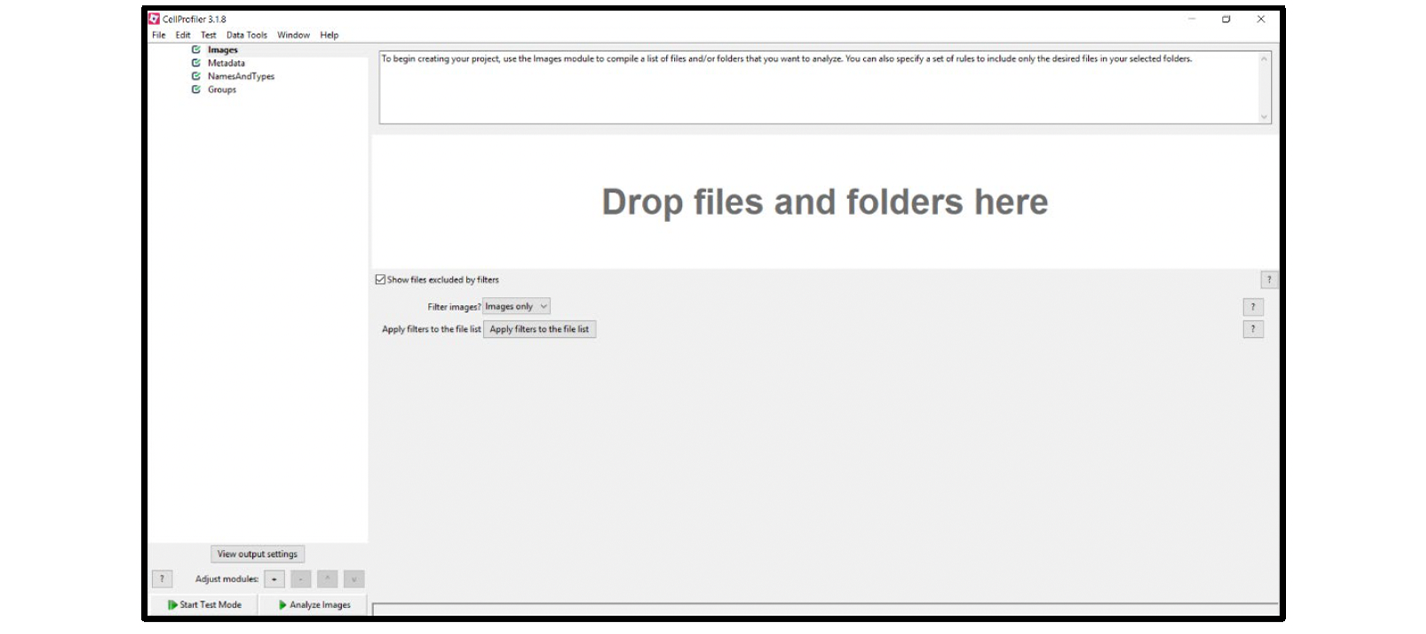
Figure 3. Loading images
Note: For best results, use images that are uncompressed .tif files no larger than 2 gigapixels in (x,y). 40x magnification is required.
3. Click the + button (see Figure 4) to add a new module to your pipeline in the following order. Make sure to save your pipeline file frequently.
- UnmixColors
- Smooth
- IdentifyPrimaryObjects
- EnhanceOrSuppressFeatures
- IdentifyPrimaryObjects
- IdentifySecondaryObjects
- MaskObjects
- RelateObjects
- MeasureObjectSizeShape
- DisplayHistogram
- ExportToSpreadsheet
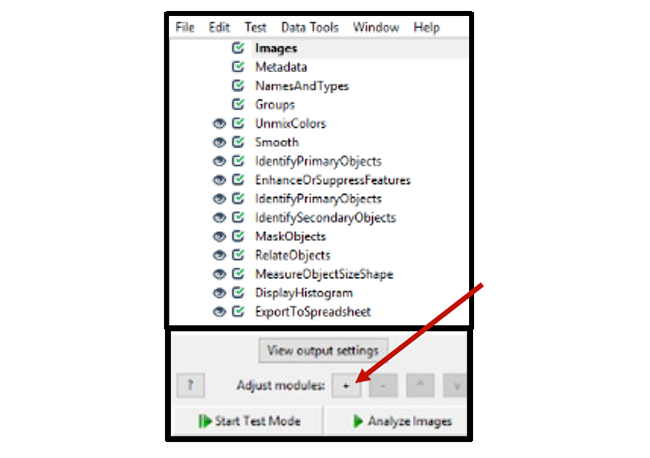
Figure 4. Pipeline overview
4. To find a module, use the Search box or select the correct category under Module Categories to choose the module from the drop-down menu. For example, the UnmixColors module is listed under Image Processing (see Figure 5).
5. Add each module to your pipeline by clicking + Add to Pipeline.
Note: Each module is accompanied by a Help page that includes module definitions, citations, and resources (see Figure 6). To locate the Help page for any given module, click the ? Module Help button (see Figure 5).
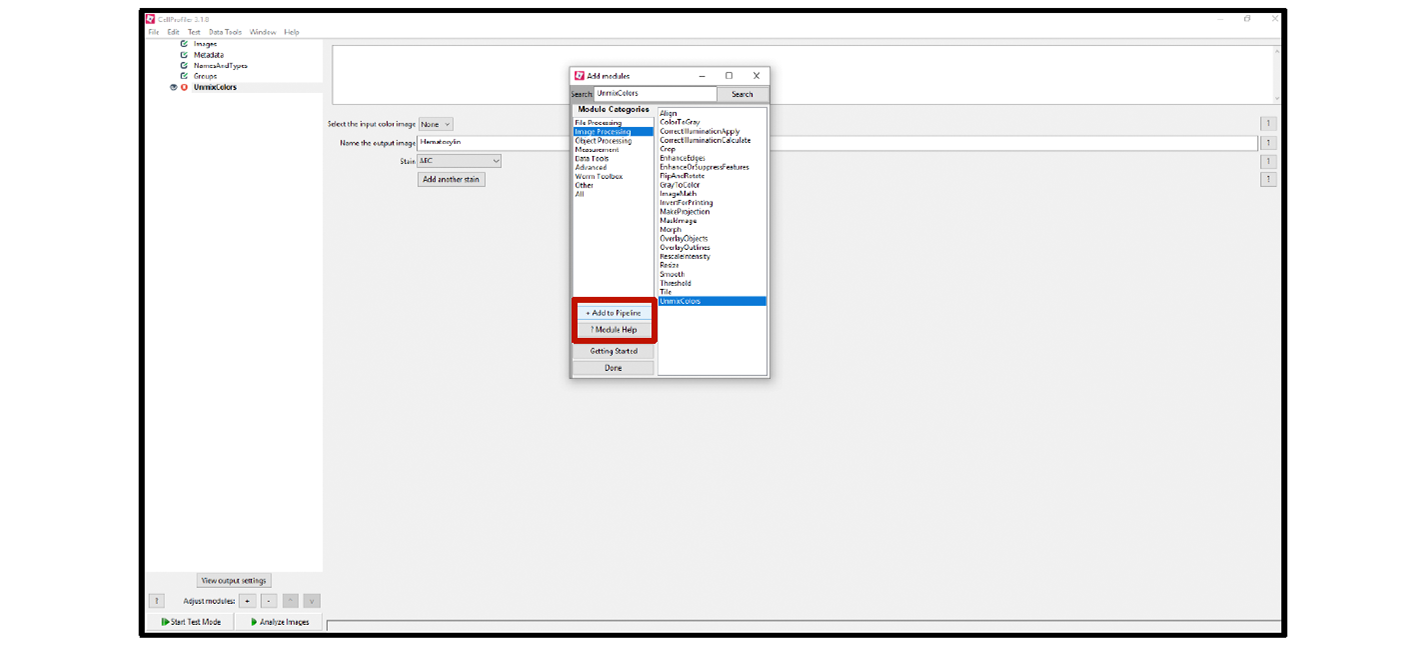
Figure 5. Finding modules
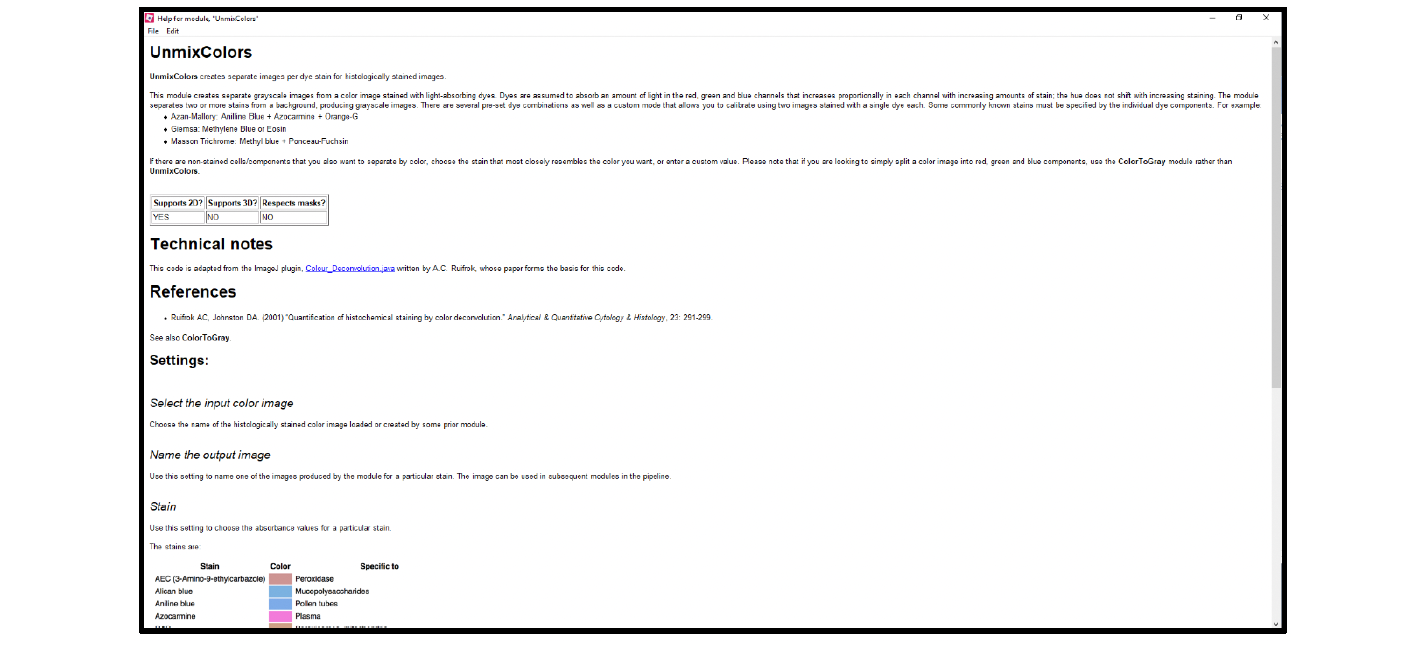
Figure 6. Module help page
6. Put the modules together by entering the input file names according to the following table. When all the names are entered correctly, a green checkmark will appear to the left of the module.
Table 1. Singleplex chromogenic workflow
|
Module |
Input name(s) |
Output name(s) |
|
Images |
N/A |
N/A |
|
Metadata |
N/A |
N/A |
|
NamesAndTypes |
All images (color image) |
Rawdata |
|
Groups |
N/A |
N/A |
|
UnmixColors (see Figure 8) |
Rawdata |
Hematoxylin |
|
RedISH |
||
|
Exclusion |
||
|
Smooth (see Figure 9) |
Hematoxylin |
FilteredHematoxylin |
|
IdentifyPrimaryObjects (see Figure 10) |
FilteredHematoxylin |
Nuclei |
|
EnhanceOrSuppressFeatures (see Figure 11) |
RedISH |
FilteredRNA |
|
IdentifyPrimaryObjects (see Figure 12) |
FilteredRNA |
RNA |
|
IdentifySecondaryObjects (see Figure 13) |
FilteredHematoxylin |
Cells |
|
Nuclei |
||
|
MaskObjects (see Figure 14) |
RNA (Objects to be masked) |
MaskedRNA |
|
Cells (Masking objects) |
||
|
RelateObjects (see Figure 15) |
Cells (Parent objects) |
RelatedRNA |
|
MaskedRNA (Child objects) |
||
|
MeasureObjectSizeShape (see Figure 16) |
RelatedRNA |
N/A |
|
DisplayHistogram (see Figure 17) |
Cells |
N/A |
|
Children |
||
|
MaskedRNA_Count |
||
|
ExportToSpreadsheet |
N/A |
N/A |
7. Visually inspect all of the modules. If an error message appears, hover over the error to identify the problem.
Part 2: Adjusting the Modules in Test Mode
- Select the NamesAndTypes and set it to color image.
- Select the module and drag a test image into the Images module.
- Click Start Test Mode.
- Select the Step button to move from one module to the next, or select the Run button to run all of the analysis modules. Output (image) windows will display with the results of each module beginning with the UnmixColors module.
Note: Using the test mode interface, adjust the parameters within each module to optimize and tailor the analysis to your unique image. We recommend testing one module at a time.
Note: The output windows will only appear if the eye icon to the left of the module is open (click on the eye to open it). See Figure 7 for an example of test mode output windows.
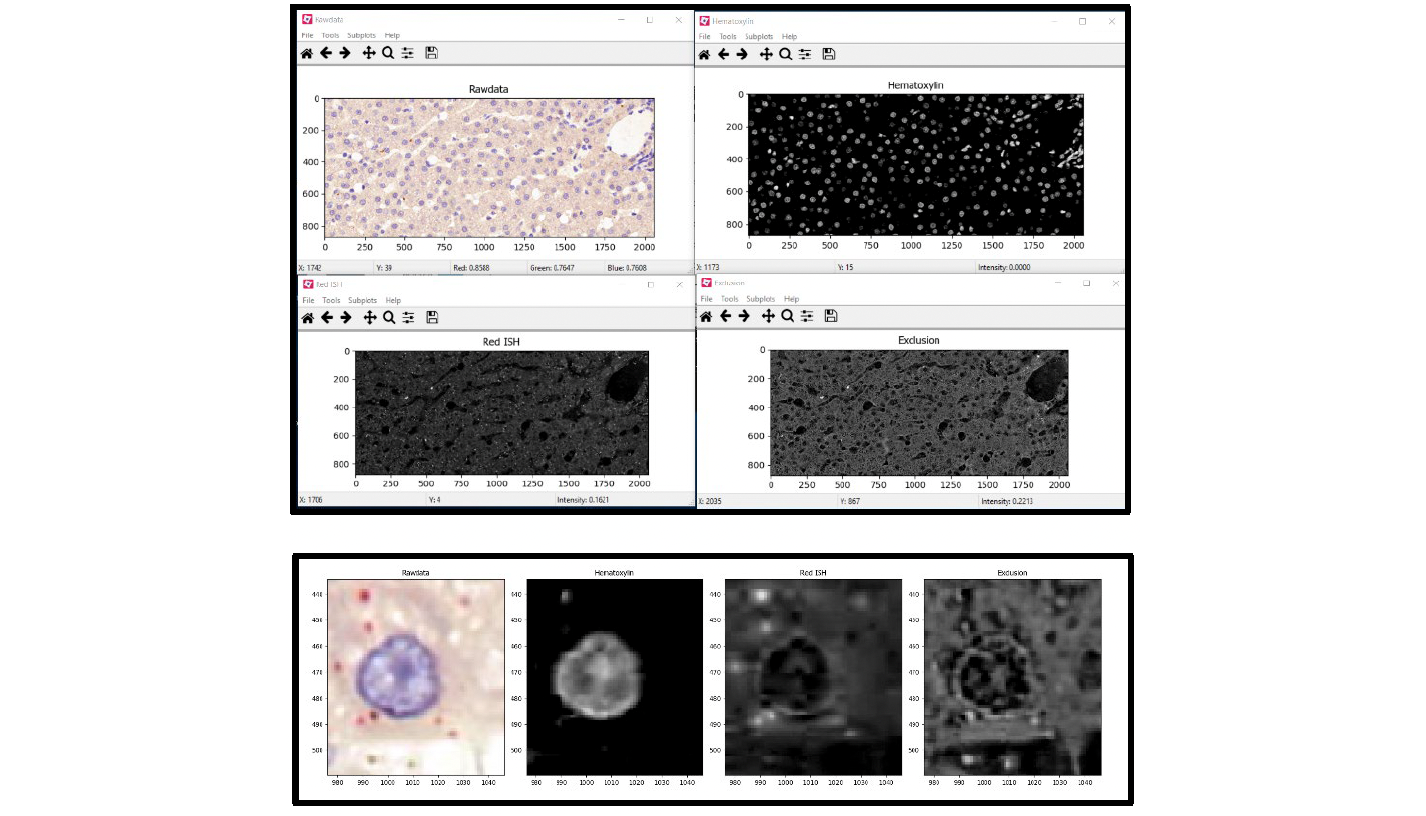
Figure 7. Test mode output windows: UnmixColors
Note: When reviewing the output images of each module using Test Mode, pay close attention to the output of the initial UnmixColors module and the two IdentifyPrimaryObjects modules. These three modules are the most important steps in the workflow and may require significant adjustments to tailor them to each unique image. Recommended settings for each of these modules are provided, but the exact settings will depend on the image. We recommend exploring the different settings within each module and referring to the help menus provided by CellProfiler.
5. Select the UnmixColors module, and choose the settings from the drop-down menus. Alternatively, you can use the actual images and create crops of each relevant color (each cropped image should only contain the color of interest), or enter the (R,G,B) values directly.
Example: Figure 8 displays the UnmixColors settings applied to the test image in Figure 1. For a singleplex red RNAscope or BaseScope™ assay, start with the Hematoxylin color palette provided in the CellProfiler drop-down menu, set the red ISH color to Custom with (R,G,B) to (0.05,1,1), and set the Exclusion channel to Custom with (R,G,B) to (1,1,1). The settings entered in the exclusion channel will eliminate black pixels from the analysis.
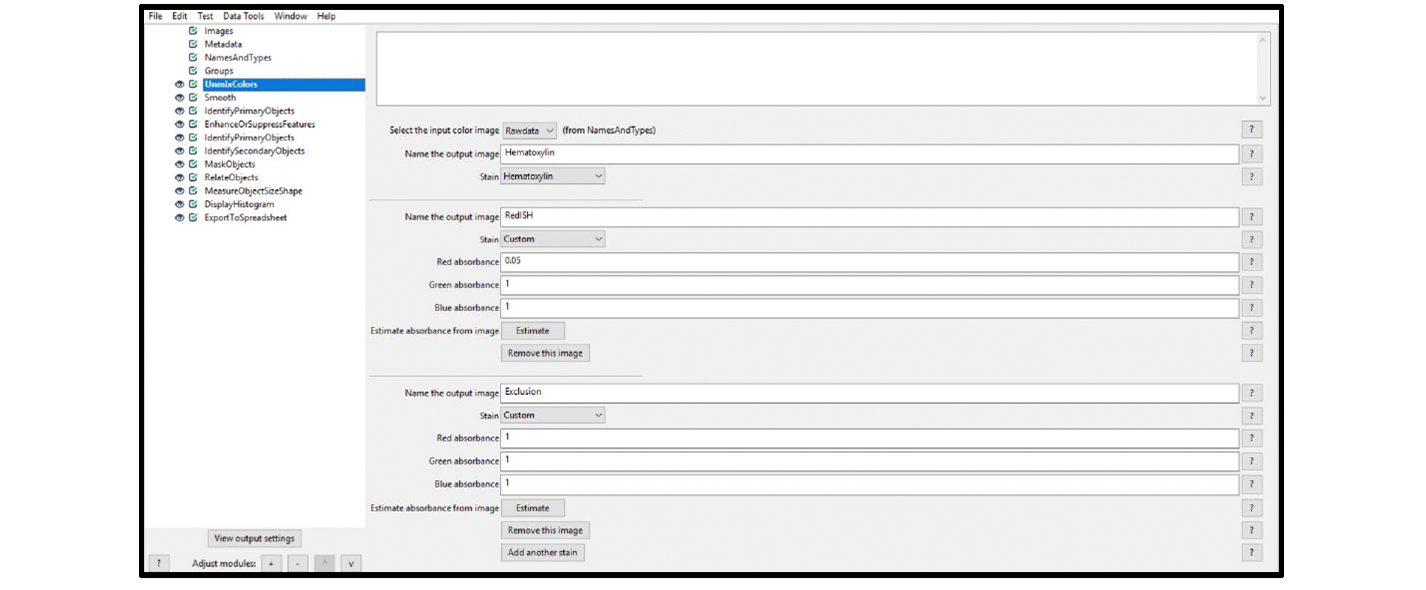
Figure 8. Module settings: UnmixColors
6. Select the Smooth module, and choose the settings from the drop-down menus. The best smoothing method depends on the unique attributes of your particular image.
Example: Figure 9 displays the setting applied to smooth the nuclear image in Figure 1 (Circular Average Filter). Depending on the image attributes, the Gaussian Filter setting can also be used. Some nuclear images are best analyzed using the Suppress Features function within the EnhanceOrSuppressFeatures module, as an alternative to the Smooth module. For this example image, the Circular Average Filter gave the best results.

Figure 9. Module settings: Smooth
7. Select the IdentifyPrimaryObjects module, and choose the settings from the drop-down menus. To view advanced settings, select yes next to Use advanced settings?.
Example: Figure 10 displays the recommended settings for this module. Start with setting the (Min,Max) object diameter to (10,100) and discard objects outside of the diameter range. Set the threshold strategy and method to Global and Otsu, and use two-class thresholding. Use Shape to distinguish clumped objects and Intensity to draw dividing lines between objects. We recommend filling holes in identified objects after both thresholding and declumping.
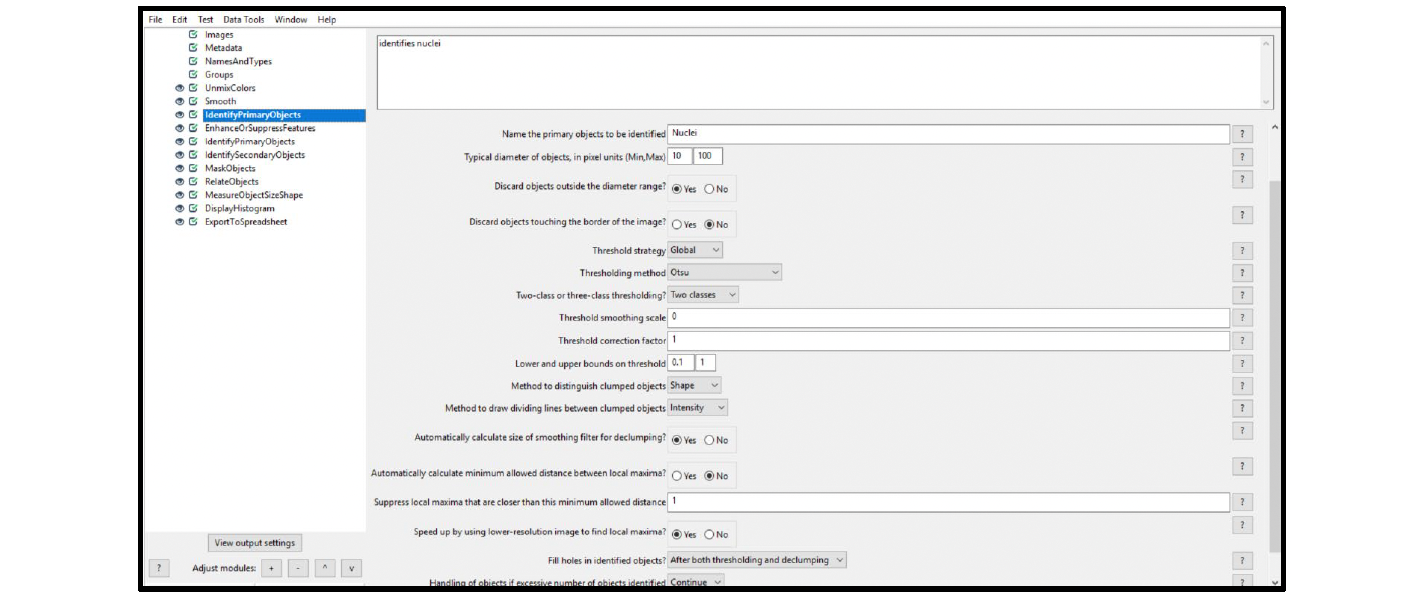
Figure 10. Module settings: IdentifyPrimaryObjects (nuclei)
8. Select the EnhanceOrSuppressFeatures module, and choose the settings from the drop-down menus. See Figure 11 for example settings (ISH).

Figure 11. Module settings: EnhanceOrSuppressFeatures
9. Select the IdentifyPrimaryObjects module, and choose the settings from the drop-down menus.
Example: Figure 12 displays the recommended settings for this module (ISH channel). Name the primary object to be identified (in this case RNA). Start with setting the (Min,Max) object diameter to (1,10) and discard objects outside of the diameter range. Set the threshold strategy and method to Adaptive and Otsu, and use two-class thresholding. As a starting point we recommend using the (Min,Max) object diameter (1,10) and to discard objects outside of the diameter range. Use Intensity to distinguish clumped objects and to draw dividing lines between objects. We recommend filling holes in identified objects after both thresholding and declumping.
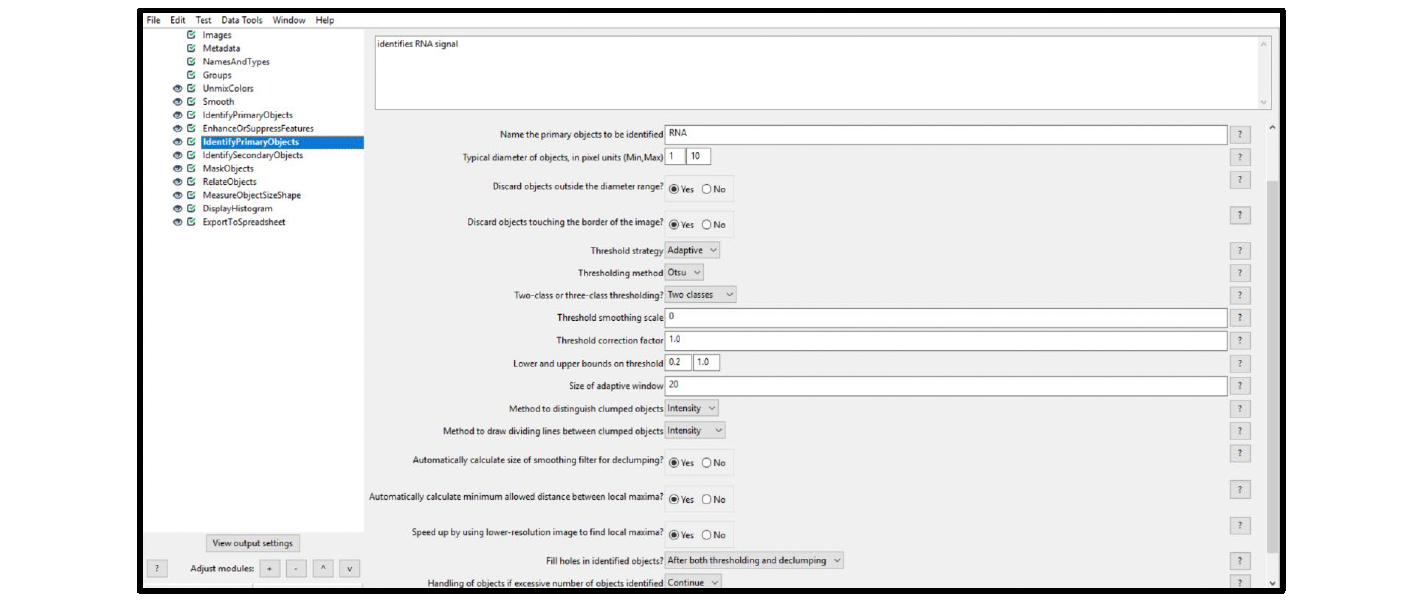
Figure 12. Module settings: IdentifyPrimaryObjects (ISH)
10. Select the IdentifySecondaryObjects module, and choose the settings from the drop-down menus.
Example/Recommendations: Figure 13 displays the recommended settings for this module. Make sure to set the method to identify secondary objects to Distance-N. For our sample image, we used a value of 50 pixels to propagate the cell cytoplasm from the nuclear outlines.

Figure 13. Module settings: IdentifySecondaryObjects (cells)
11. Select the MaskObjects module, and choose the settings from the drop-down menus.
Example/Recommendations: Figure 14 displays the recommended settings for this module. You must select RNA for the
objects to be masked if your primary object identified is RNA (see step 8). Select Cells for the masking object.

Figure 14. Module settings: MaskObject
12. Select the RelateObjects module, and choose the settings from the drop-down menus (see Figure 15).

Figure 15. Module settings: RelateObjects
13. Select the MeasureObjectSizeShape module, and choose the object to measure from the drop-down menu. The object is the output of the RelateObjects module (see Figure 16).

Figure 16. Module settings: MeasureObjectSizeShape
14. Select the DisplayHistogram module, and choose the settings from the drop-down menus (see Figure 17). Start with the default number of bins (100) to quickly visualize the cell population distribution and adjust from there.

Figure 17. Module settings: DisplayHistogram
15. Adjust the ExportToSpreadsheet settings to suit your requirements.
Part 3: Interpreting the Data
The CellProfiler workflow includes a histogram showing the dots per cell identified using the pipeline. Figure 18 displays the histogram of the data taken from the example in Figure 1.
Use the histogram to examine the distribution of dots/cell, verify the mean dots/cell, and view the maximum and minimum dots/cell in your image. Make sure to spot-check the data and correlate the results with a visual inspection of your image. In the example, most cells have two to three dots/cell, which matches a scan of the raw image. To translate the dots/cell into a semi-quantitative score or H-score using the binning criteria established by AdvancedCell Diagnostics, refer to the data analysis guidelines provided on the ACD website.
A .csv file containing the per-cell data for every cell is also exported in the final module. You can transform this information into our typical H-score output or your preferred data presentation format.
Note: The cells can be sorted according to expression level within the CellProfiler workflow using a series of ClassifyObjects modules, by specifying the binning criteria for each round of cell sorting.
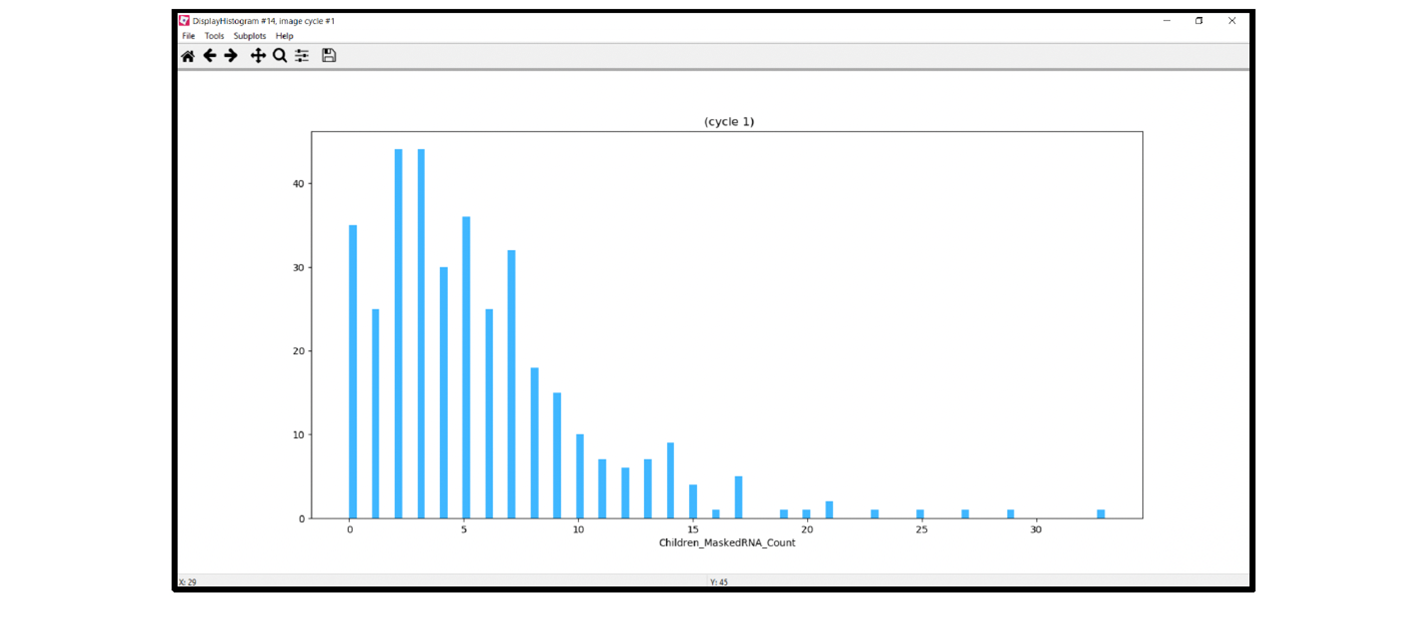
Figure 18. Example histogram module output
Part 4: Adding Another Channel to the Chromogenic Assay Analysis Workflow
To analyze a duplex chromogenic assay, modify the singleplex chromogenic workflow by duplicating the initial ISH channel modules (Enhance or Suppress Feature and Identify Primary Objects) and by modifying the Unmix Color module to accurately separate the channels. For each additional ISH channel, another set of Mask Objects and Relate Objects modules must be added to the workflow. To calculate the number of cells that are positive for both ISH targets (co-expressing cells), using the Classify Objects module. See Figure 19 and Table 2 for the workflow overview. Note on each of the modules, especially on those that differ from the singleplex workflow, are given in Table3. Figure 20 provides the details for the Classify Objects module.
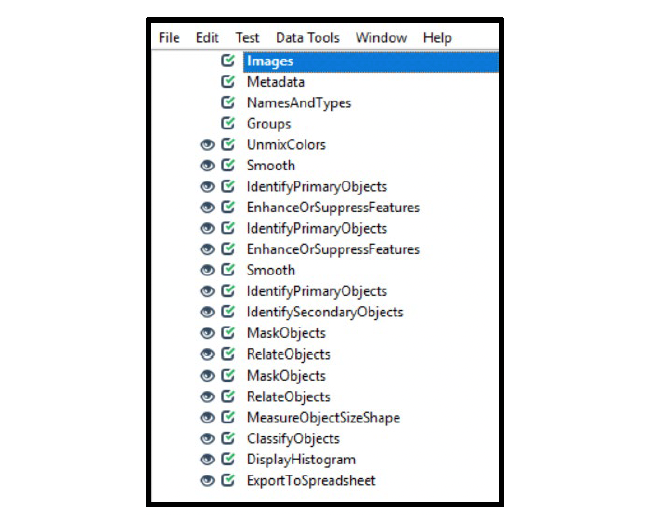
Figure 19. Sample chromogenic duplex assay workflow
Table 2. Duplex chromogenic workflow
| Module | Input Name(s) | Output Name(s) |
| Images | N/A | N/A |
| Metadata | N/A | N/A |
| NamesAndTypes | All images | Rawdata |
| Groups | N/A | N/A |
| UnmixColors | Rawdata | Hematoxylin |
| RedISH | ||
| Exclusion | ||
| GreenISH | ||
| Smooth | Hematoxylin | FilteredHematoxylin |
| IdentifyPrimaryObjects | FilteredHematoxylin | Nuclei |
| EnhanceOrSuppressFeatures | RedISH | FilteredRNA |
| IdentifyPrimaryObjects | FilteredRNA | RNA |
| EnhanceOrSuppressFeatures | GreenISH | FilteredGreenISH |
| IdentifyPrimaryObjects | FilteredGreenISH | GreenRNA |
| IdentifySecondaryObjects | FilteredHematoxylin | Cells |
| Nuclei | ||
| MaskObjects | RNA (Objects to be masked) | MaskedRNA |
| Cells (Masking objects) | ||
| RelateObjects | Cells (Parent objects) | RelatedRNA |
| MaskedRNA (Child objects) |
| Module | Input Name(s) | Output Name(s) |
| MaskObjects | GreenRNA (Objectsto be masked) | MaskedGreenRNA |
| Cells (Masking objects) | ||
| RelateObjects | Cells (Parent objects) | RelatedGreenRNA |
| MaskedGreenRNA (Child objects) | ||
| MeasureObjectSizeShape | RelatedRNA | N/A |
| RelatedGreenRNA | ||
| ClassifyObjects | Cells (object name) | NotExpressing |
| Children | RedExpressing | |
| MaskedGreenRNA_Count | GreenExpressing | |
| Children | Coexpressing | |
| MaskedRNA_Count | CoexpressingCells | |
| DisplayHistogram | Cells | MaskedRNA_Count |
| DisplayHistogram | Cells | MaskedGreenRNA_Count |
| ExportToSpreadsheet | N/A | N/A |
Table 3. Notes on duplex chromogenic workflow and modules
| Module | Notes |
| Images | N/A |
| Metadata | N/A |
| NamesAndTypes | Use ‘color image’ |
| Groups | N/A |
| UnmixColors | Add GreenISH with settings (1,0.05,1) |
| Smooth | Same settings as singleplex |
| IdentifyPrimaryObjects | Identify nuclei as in the singleplex chromogenic workflow |
| EnhanceOrSuppressFeatures | Enhance speckles feature size = 20 |
| IdentifyPrimaryObjects | Min, Max (1,10) |
| EnhanceOrSuppressFeatures | Enhance speckles feature size = 20 |
| IdentifyPrimaryObjects | Min, Max (1,4) Green ISH dots tend to be smaller than red ISH dots. |
| IdentifySecondaryObjects | Propagate cell boundaries as in the singleplex chromogenic workflow |
| MaskObjects | Same settings as singleplex |
| RelateObjects | Same settings as singleplex |
| MaskObjects | Add GreenRNA |
| RelateObjects | Add MaskedGreenRNA |
| MeasureObjectSizeShape | Measure RelatedRNA and RelatedGreen RNA features separately |
ClassifyObjects (see Figure 20) | Classify the MaskedGreenRNA_Count separately from the MaskedRNA_Count |
| Module | Notes |
| DisplayHistogram | Display data from MaskedRNA_COunt |
| DisplayHistogram | Display data from MaskedGreenRNA_Count |
| ExportToSpreadsheet | Same settings as singleplex |
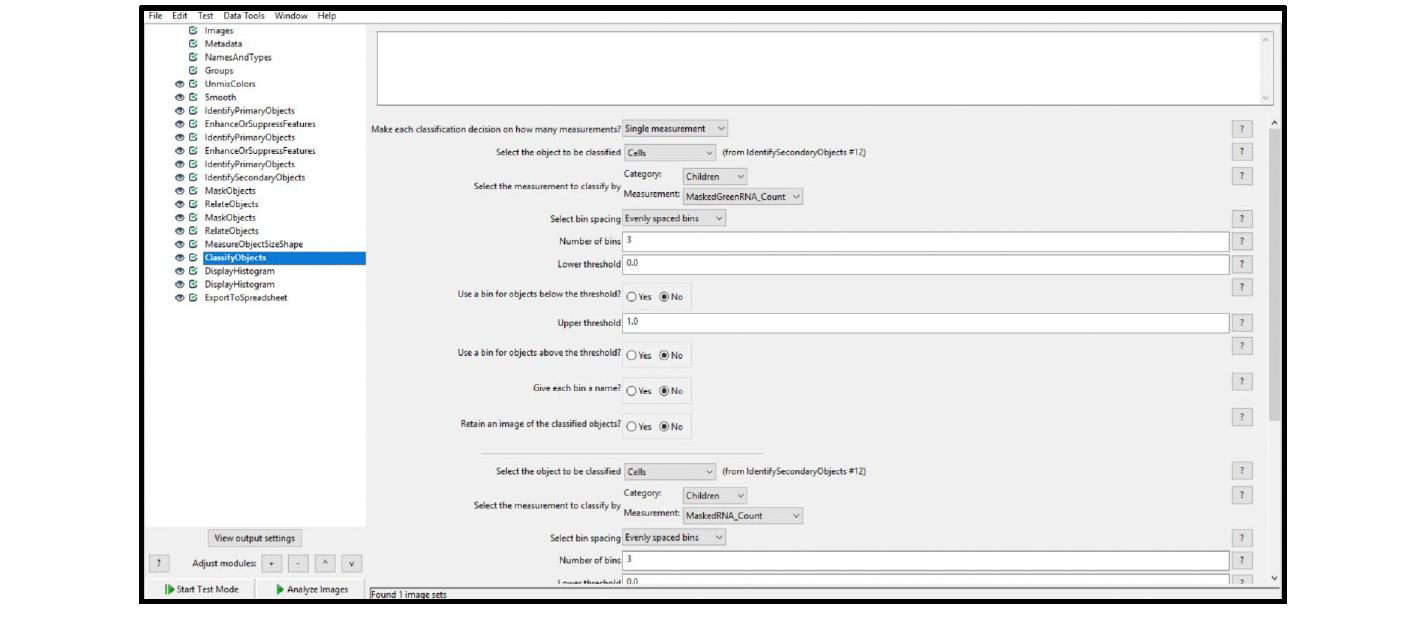
Figure 20. ClassifyObjects module output
Part 5: Fluorescent Assay Analysis Workflow
To analyze a multiplex fluorescent assay, modify the duplex chromogenic workflow by eliminating the color deconvolution step and duplicating the ISH channel modules (EnhanceOrSuppressFeatures, IdentifyPrimaryObjects, MaskObjects, and RelateObjects) until the desired number of ISH channels have been included. To calculate the number of cells that are positive for two ISH targets (co-expressing cells), use the ClassifyObjects module or the FilterObjects module. A good starting point for a multiplex fluorescent assay CellProfiler workflow isthe pipelinepublished by Erben et al.(2017). Download this pipeline from the CellProfiler website at https://cellprofiler.org/examples/published_pipelines (see Figure 21).Table 4 and Figures 22-24 contains the namesand uniquemodule details associated with thisworkflow.
Note: The Erben et al. analysis workflow focuses on the red FISH signal. If needed, adjust the workflow, including the names, to calculate your desired data output.
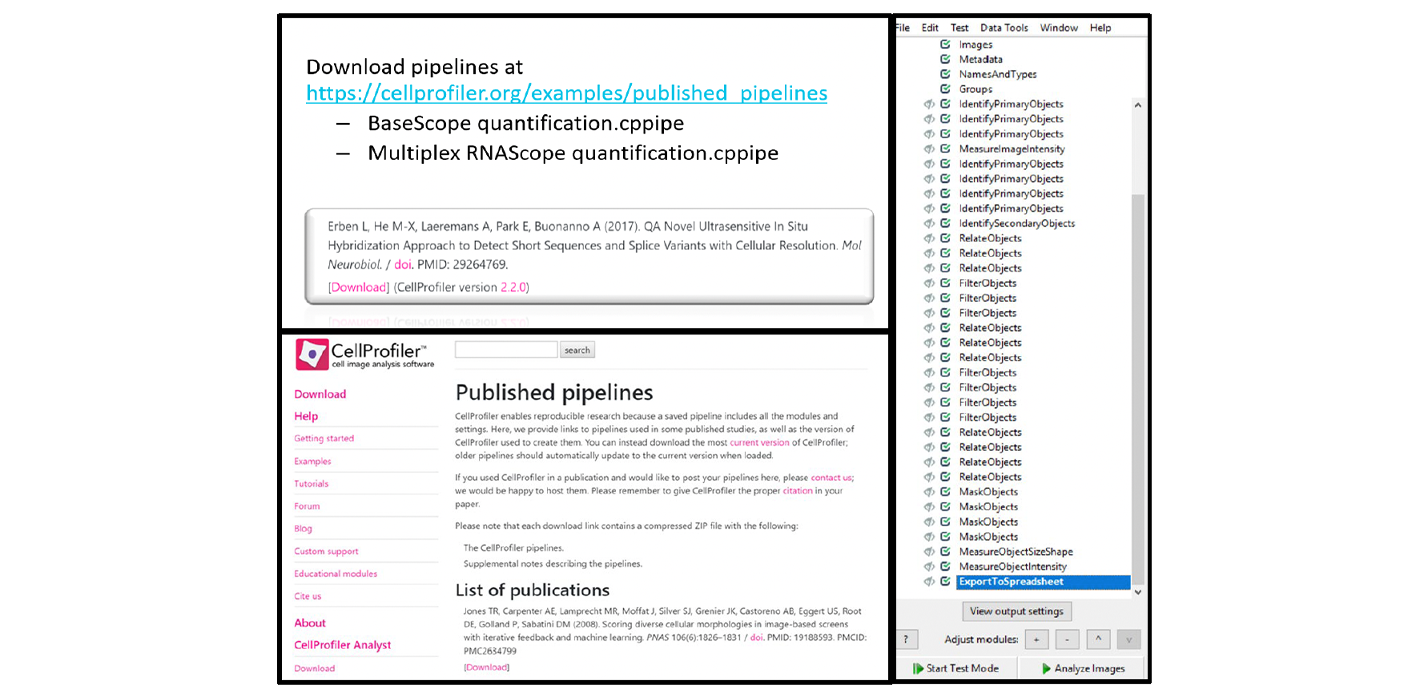
Figure 21. Sample fluorescent assay workflow from Erben et al (2017)
Table 4. Multiplex fluorescent assay CellProfiler analysis workflow
| Module | Input Name(s) | Output Name(s) |
| Images (see Figure 22) | Note: Load single images for each channel. Include C1 through C4 in the file names. | N/A |
| Metadata | N/A | N/A |
| NamesAndTypes (see Figure 23) | C1 | DAPI (color image) |
| C2 | Green (color image) | |
| C3 | Red (color image) | |
| C4 | White (Grayscale image) | |
| Groups | N/A | N/A |
| ColorToGray (see Figure 24) | C1 | OrigNuclei |
| Split | ||
| RGB | ||
| ColorToGray | C2 | OrigGreen |
| Split | ||
| RGB | ||
| ColorToGray | C3 | OrigRed |
| Split | ||
| RGB |
| Module | Input Name(s) | Output Name(s) |
| EnhanceOrSuppressFeatures | OrigGreen | EnhancedGreen |
| EnhanceOrSuppressFeatures | C4 | EnhancedWhite |
| EnhanceOrSuppressFeatures | OrigRed | EnhancedRed |
| IdentifyPrimaryObjects | OrigNuclei | NucleiArea |
| IdentifyPrimaryObjects | OrigGreen | GreenArea |
| IdentifyPrimaryObjects | OrigRed | RedArea |
| IdentifyPrimaryObjects | C4 | WhiteArea |
| MeasureImageIntensity | OrigNuclei/ NucleiArea | N/A |
| C4/ WhiteArea | N/A | |
| OrigRed/ RedArea | N/A | |
| OrigGreen/ GreenArea | N/A | |
| IdentifyPrimaryObjects | OrigNuclei | Nuclei |
| IdentifyPrimaryObjects | EnhancedGreen | Green |
| IdentifyPrimaryObjects | EnhancedRed | Red |
| IdentifyPrimaryObjects | EnhancedWhite | White |
| IdentifySecondaryObjects | OrigNuclei | Cells |
| Nuclei | ||
| RelateObjects | Cells (Parent objects) | RelateObjects |
| Red (Child objects) | ||
| RelateObjects | Cells (Parent objects) | RelateObjects |
| Green (Child objects) | ||
| RelateObjects | Cells (Parent objects) | RelateObjects |
| White (Child objects) | ||
| FilterObjects | Cells | RedCells |
| FilterObjects | Cells | WhiteCells |
| FilterObjects | Cells | GreenCells |
| RelateObjects | RedCells | RelateObjects |
| Red | ||
| RelateObjects | RedCells | RelateObjects |
| Green | ||
| RelateObjects | RedCells | RelateObjects |
| White | ||
| FilterObjects | RedCells | RedandGreenCells |
| FilterObjects | RedCells | RedandWhiteCells |
| FilterObjects | RedCells | RedandNoneCells |
| FilterObjects | RedCells | RedandBothCells |
| RelateObjects | RedandGreenCells (Parent objects) | RelateObjects |
| Red (Child Objects) | ||
| RelateObjects | RedandWhiteCells (Parent Objects) | RelateObjects |
| White (Child Objects) | ||
| RelateObjects | RedandNoneCells (Parent Objects) | RelateObjects |
| Red (Child Objects) | ||
| RelateObjects | RedandBothCells (Parent Objects) | RelateObjects |
| Red (Child Objects) | ||
| MaskObjects | Red | RedDotsonRedandGreenCells |
| MaskObjects | Red | RedDotsonRedandWhiteCells |
| MaskObjects | Red | RedDotsonRedandNoneCells |
| MaskObjects | Red | RedDotsonRedandBothCells |
| MeasureObjectSizeShape | Red | N/A |
| MeasureObjectIntensity | OrigRed (Image) | N/A |
| Red (Objects) |
| Module | Input Name(s) | Output Name(s) |
RedDotsonRedandGreenCells (Objects) | ||
RedDotsonRedandWhiteCells (Objects) | ||
| RedDotsonRedandNoneCells (Objects) | ||
| RedDotsonRedandBothCells (Objects) | ||
| ExportToSpreadsheet | N/A | N/A |

Figure 22. Fluorescent assay Images module
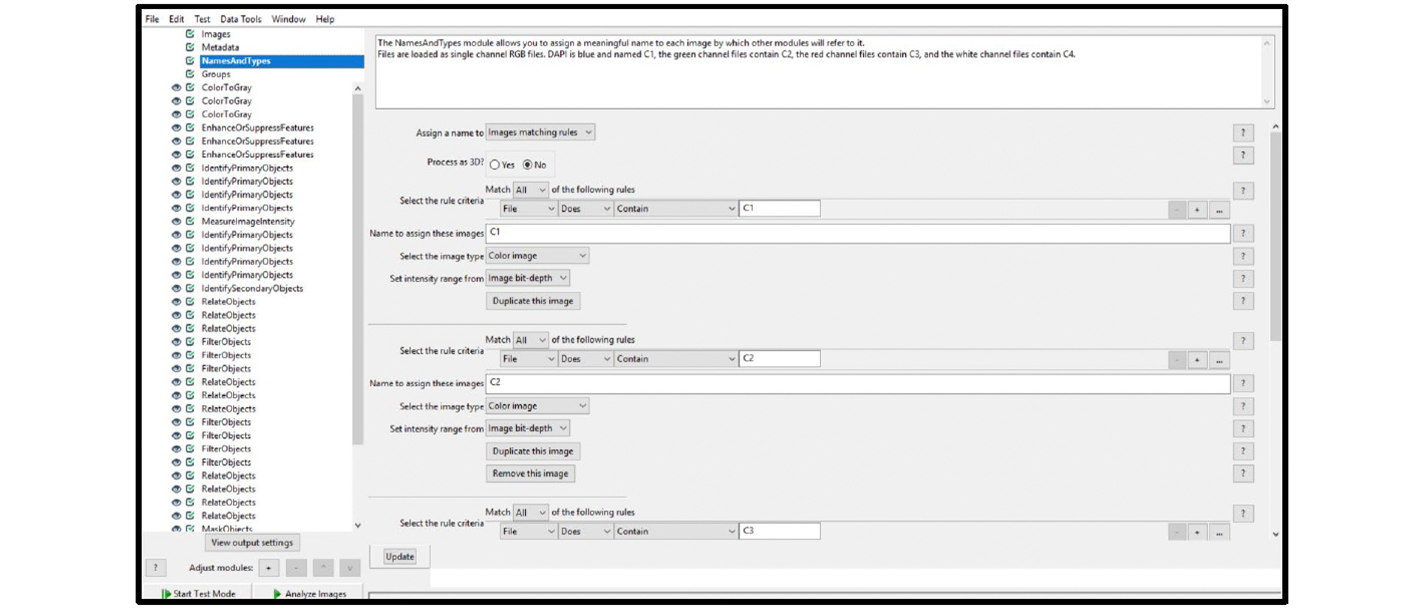
Figure 23. Fluorescent assay NamesAndTypes module
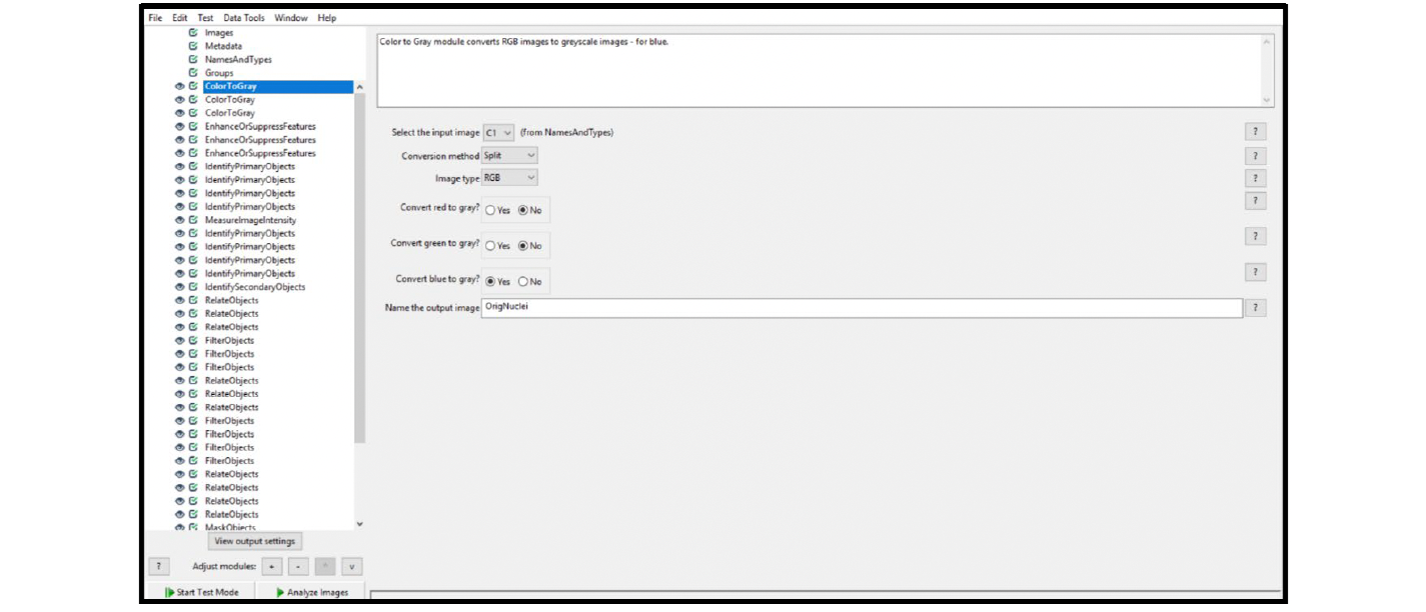
Figure 24. Fluorescent assay ColorToGray module