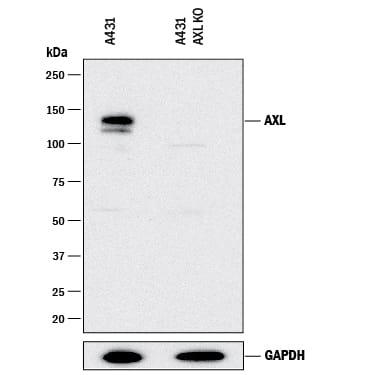
Western Blot Shows Human Axl Specificity by Using Knockout Cell Line.
Western blot shows lysates of A431 human epithelial carcinoma parental cell line and Axl knockout A431 cell line (KO). PVDF membrane was probed with 1 µg/mL of Goat Anti-Human Axl Antigen Affinity-purified Polyclonal Antibody (Catalog # AF154) followed by HRP-conjugated Anti-Goat IgG Secondary Antibody (
HAF017). A specific band was detected for Axl at approximately 150 kDa (as indicated) in the parental A431 cell line, but is not detectable in knockout A431 cell line. GAPDH (Catalog #
AF5718) is shown as a loading control. This experiment was conducted under reducing conditions and using Immunoblot Buffer Group 1.
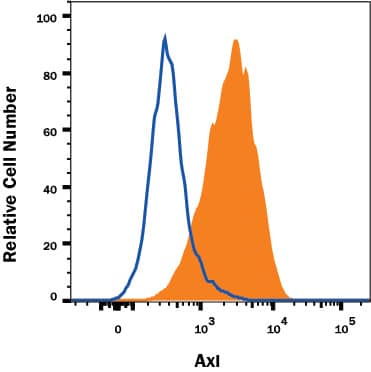
Axl Specificity is Shown by Flow Cytometry in Knockout Cell Line.
Axl knockout A431 human epithelial carcinoma cell line was stained with Goat Anti-Human Axl Affinity-Purified Polyclonal Antibody (Catalog # AF154, filled histogram) or normal goat IgG control antibody (AB-108C, open histogram) followed by APC-conjugated anti-Goat IgG Secondary Antibody (
F0108). No staining was observed in the Axl knockout A431 cell line. View our protocol for Staining Membrane-associated Proteins.
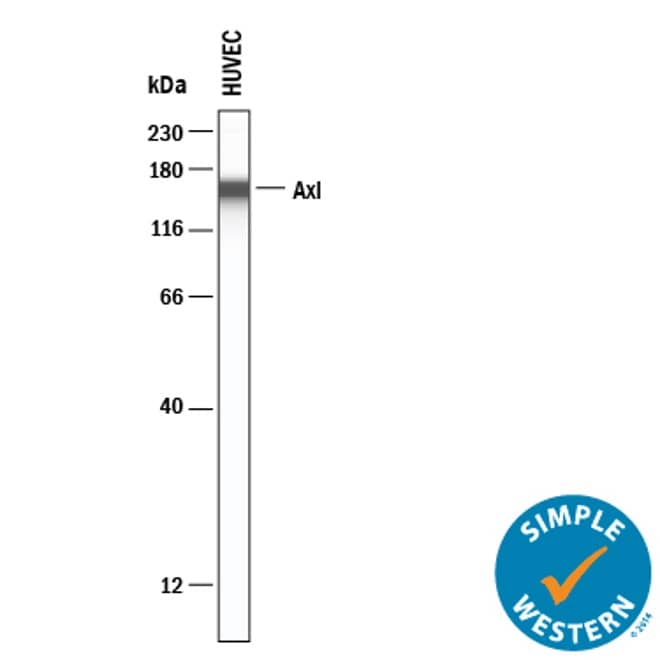
Detection of Human Axl by Simple WesternTM.
Simple Western lane view shows lysates of HUVEC human umbilical vein endothelial cells, loaded at 0.2 mg/mL. A specific band was detected for Axl at approximately 154 kDa (as indicated) using 10 µg/mL of Goat Anti-Human Axl Antigen Affinity-purified Polyclonal Antibody (Catalog # AF154). This experiment was conducted under reducing conditions and using the 12-230 kDa separation system.
Detection of Human Axl by Western Blot
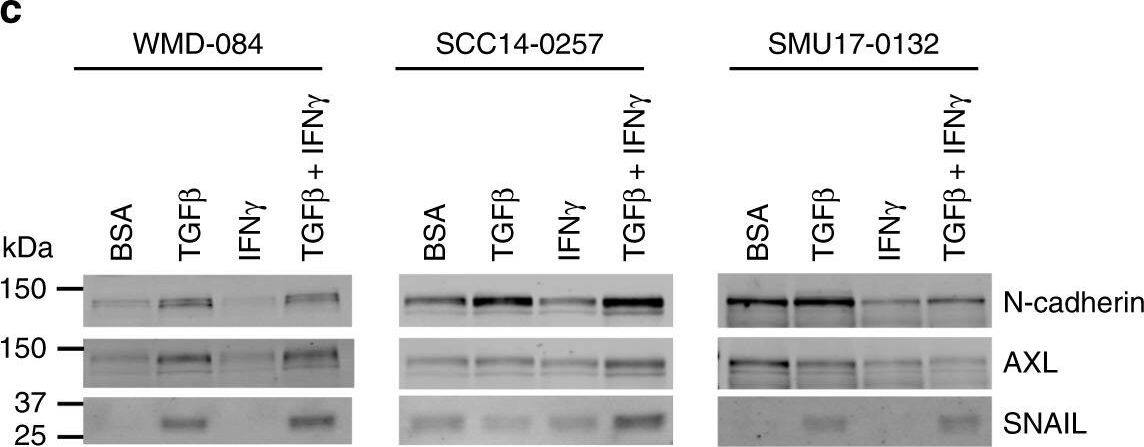
TGF beta promotes HLA-ABC downregulation at baseline and in response to IFN gamma.a IFN gamma-mediated induction (IFN gamma-treated/vehicle-treated control) of cell surface HLA-ABC in MITFhigh/AXLlow or /MITFlow/AXLhigh short-term PD-1 PROG melanoma cell lines. Each dot represents one cell line and HLA-ABC induction was measured by flow cytometry 24 h after treating cultures with vehicle control or 1000 U/ml IFN gamma. Box plots show the median and interquartile ranges, and data were compared using Mann-Whitney test. b Cell surface expression (median fluorescence intensity; MFI) of HLA-ABC in WMD-084, SCC14-0257 and SMU17-0132 melanoma cells treated with vehicle (Control), 1000 U/ml IFN gamma and/or 10 ng/ml TGF beta for 72 h. Data (mean ± s.d.) were compared using one-way ANOVA with the Geisser-Greenhouse correction. c Expression of de-differentiation markers AXL, N-cadherin and SNAIL in WMD-084, SCC14-0257 and SMU17-0132 melanoma cells treated with vehicle (Control), 1000 U/ml IFN gamma- and/or 10 ng/ml TGF beta for 72 h. d IFN gamma production after co-culture of TGF beta pre-treated (10 ng/ml for 72 h) melanoma cells with the patient-matched tumor-infiltrating lymphocytes expanded from the same tumor biopsy. IFN gamma was measured by flow cytometry. Data (mean ± s.d.) show relative IFN gamma expression in T cells (TGF beta pre-treated/BSA pre-treated) after background subtraction (spontaneous IFN gamma production on immune cell-only cultures). Paired BSA-treated vs TGF beta-treated data were compared using paired t-test, **p < 0.01, *p < 0.05. Image collected and cropped by CiteAb from the following publication (https://pubmed.ncbi.nlm.nih.gov/32312968), licensed under a CC-BY license. Not internally tested by R&D Systems.
Detection of Rat Axl by Western Blot
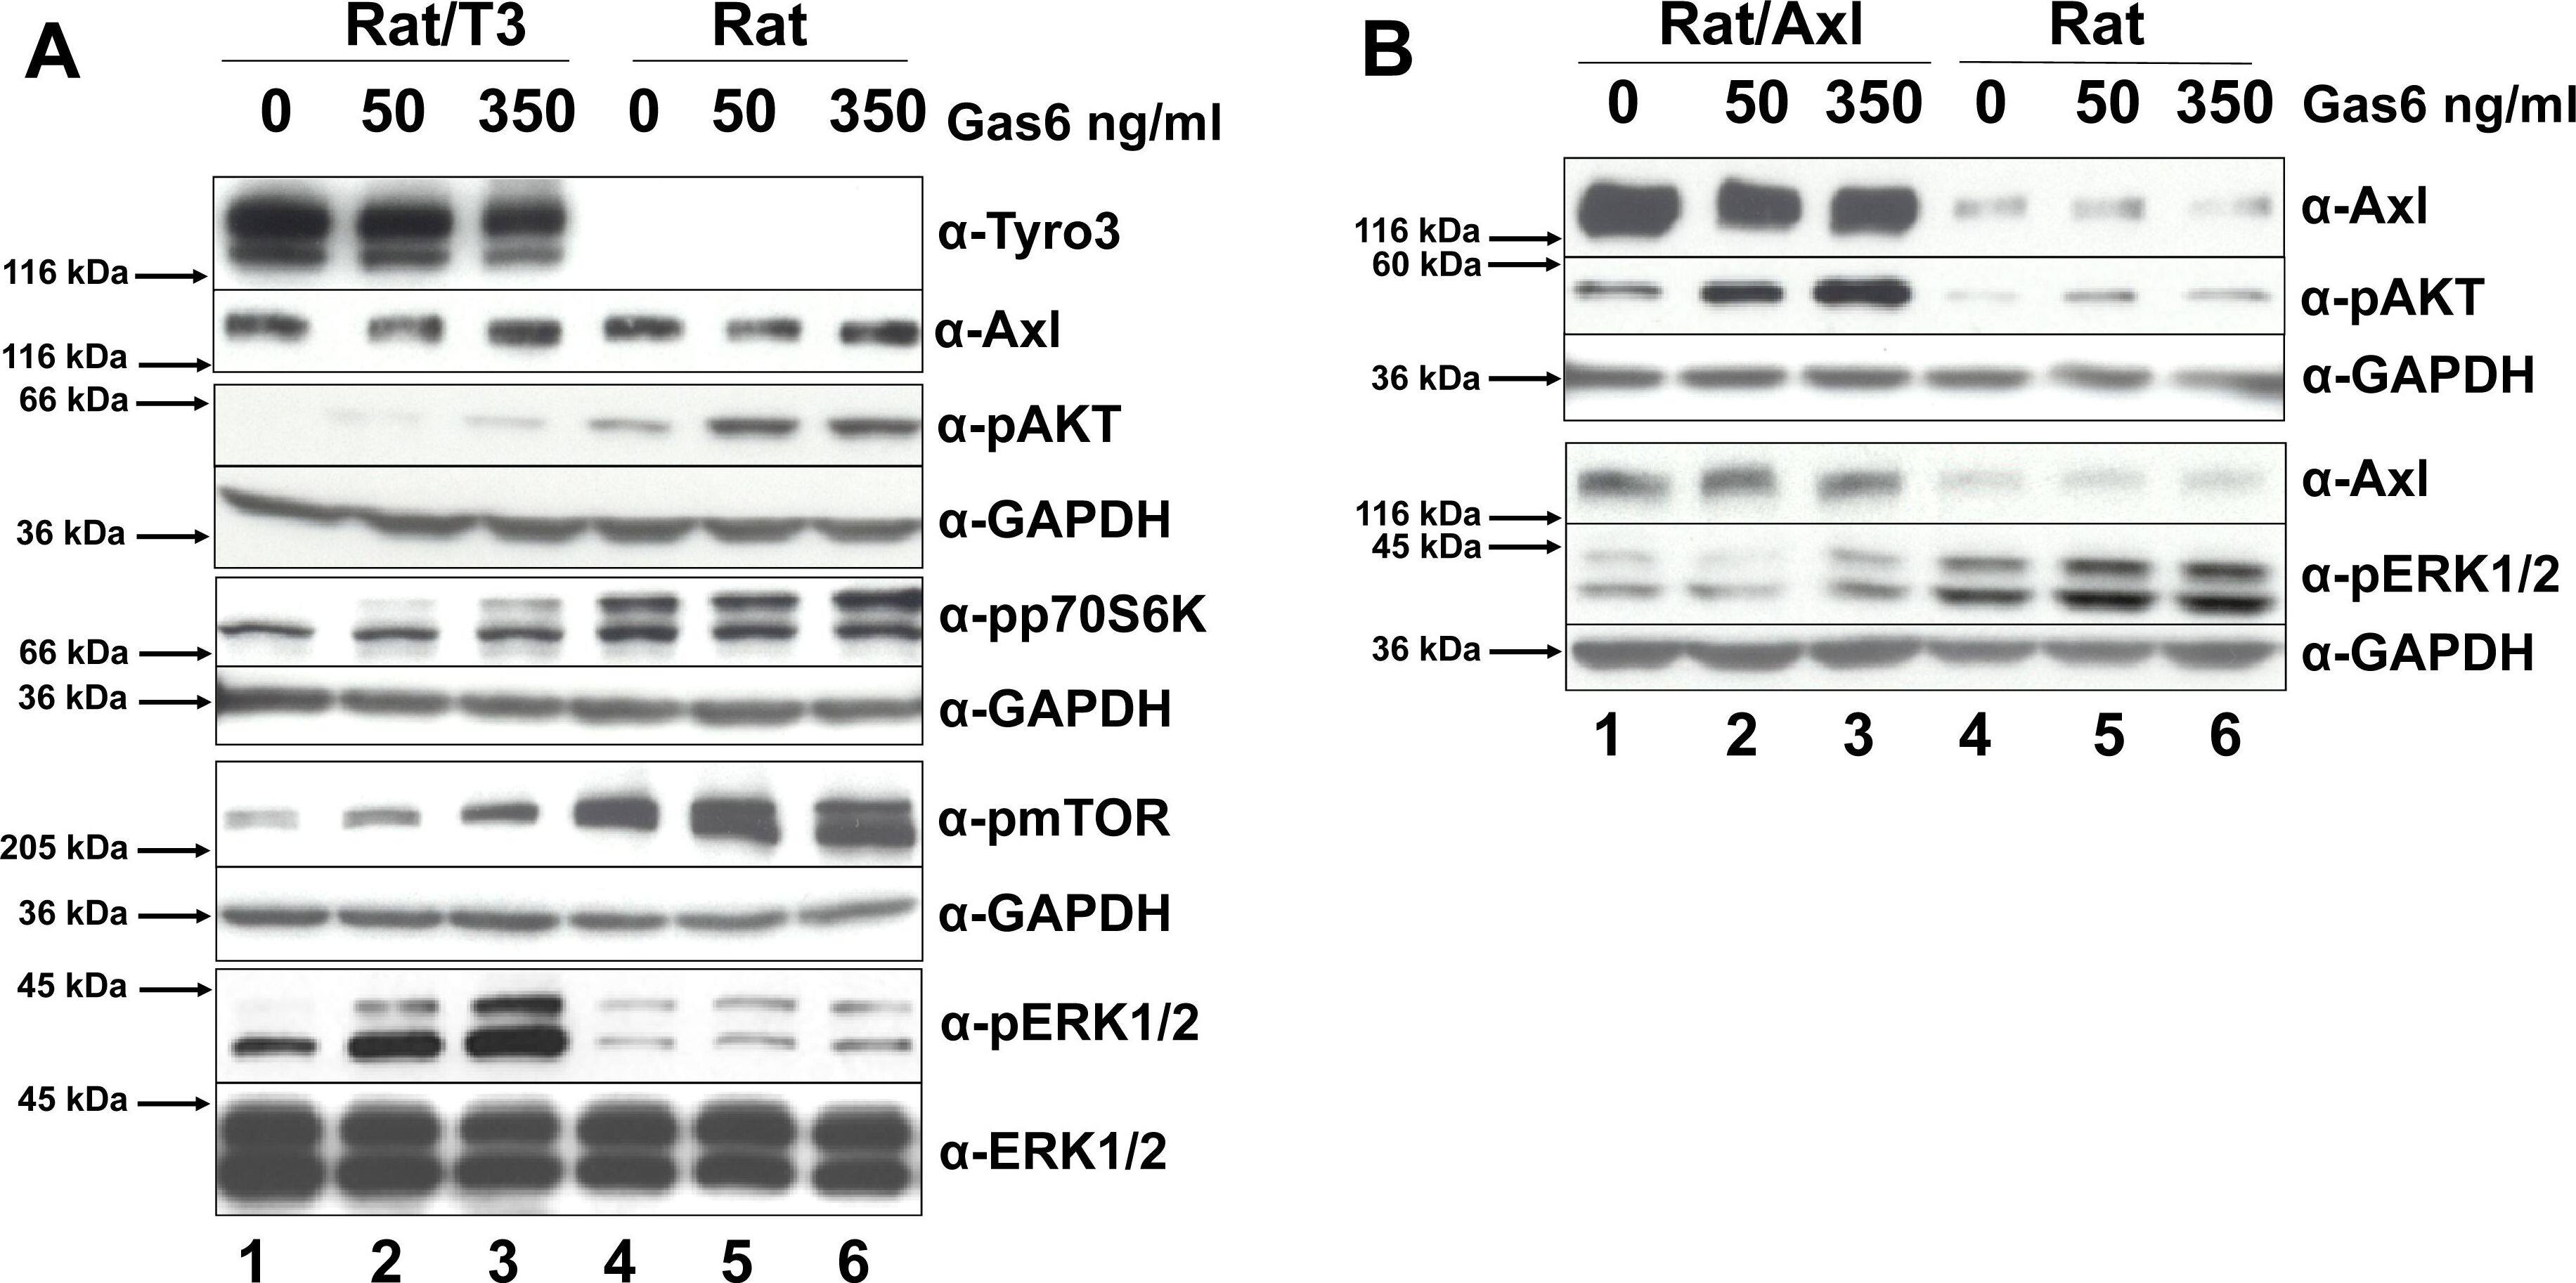
Tyro3 modulates MAPK and PI(3)K signaling pathways.As shown in panel A, Rat/T3V5 (Rat/T3, lanes 1–3) and Rat2 cells (Rat, lanes 4–6) were treated with 0, 50, and 350 ng/ml of Gas6 for 20 min. Detergent cell extracts normalized for protein concentration were separated by SDS-PAGE using 4–20% gels. Western blotting was performed with antibodies directed against alpha-Tyro3, alpha-Axl, alpha-pAKT, alphapp70S6K, alpha-pmTOR, and alpha-pERK1/2. The membranes were stripped or cut and reprobed with alpha-ERK1/2 or alpha-GAPDH and shown beneath each panel as protein loading control. These blots are representative of 5 experiments. As shown in panel B, transiently transfected Rat2/Axl cells (Rat/Axl, lanes 1–3) and Rat2 cells (Rat, lanes 4–6) were treated and processed as above. Western blotting was performed with alpha-Axl, alpha-pAKT, and alpha-pERK1/2. The membranes were cut and reprobed with alpha-GAPDH shown beneath each panel as protein loading control. These blots are representative of 4 experiments. The total levels of MAPK and PI(3)K signaling pathway molecules was compared in Rat2 cells overexpressing Tyro3 (panel C) and Axl (panel D). For Tyro3 overexpressing cells (panel C), Rat/T3V5 cells (Rat/T3, lanes 1–3), and Rat2 untransfected cells (Rat, lanes 4–6), were treated with 0, 50 and 350 ng/ml of Gas6 for 20 min. Detergent cell extracts normalized for protein concentration were separated by SDS-PAGE using 4–20% gels. Western blotting was performed with antibodies directed against alpha-AKT, alphap70S6K, alpha-mTOR. The membranes were cut and reprobed with alpha-GAPDH shown beneath each panel as protein loading control. For total levels of Tyro3, Axl, and ERK1/2 in Rat2 and Rat2/T3V5 cells, see Fig. 3 A and B. These blots are representative of 4 experiments. For Axl overexpressing cells (panel D), transiently transfected Rat2/Axl cells (Rat/Axl, lanes 1–3) and Rat2 untransfected cells (Rat, lanes 4–6) were treated and processed as above. Western blotting was performed with alpha-Axl, alpha-AKT, and alpha-ERK1/2. The membranes were cut and reprobed with alpha-GAPDH shown beneath each panel as protein loading control. These blots are representative of 4 experiments. Image collected and cropped by CiteAb from the following publication (https://dx.plos.org/10.1371/journal.pone.0036800), licensed under a CC-BY license. Not internally tested by R&D Systems.
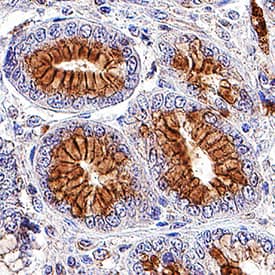
Detection of Human Axl by Immunohistochemistry
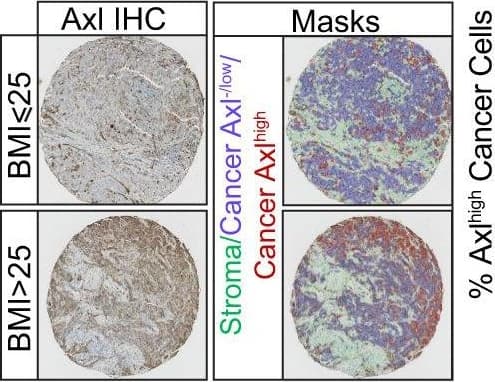
Obesity is associated with increased frequency of stem cell-like cancer cells in PM/ER−/PR− breast cancer patients and mouse models of breast cancer.a Tumor incidence following orthotopic implantation of cancer cells into the mammary fat pads of chow- and HFD-fed mice. b Kaplan–Meier curves show disease-specific survival for PM/ER−/PR− patients (n = 48) with high (red) or low (blue) BMI. Log-rank (Mantel–Cox) P value is denoted for difference in disease-specific survival. c, d Representative tissue microarray and QuPath analysis mask pictures of CD133 (c) and Axl (d) staining in high (BMI > 25, n = 23 for CD133; n = 21 for Axl) or low (BMI ≤ 25, n = 13 for CD133; n = 11 for Axl) BMI PM/ER−/PR− patients’ tumor samples, stroma is marked in green, CD133− or Axl−/low cancer cells are marked in blue and positive staining cancer cells are marked in red (for c, P = 0.0245; d, P = 0.023). e Time-dependent proliferation assay of ex vivo E0771 cells isolated from chow or HFD-fed mice. For each time point, data are represented as mean ± SEM of four tumor samples (eight replicates per tumor sample were measured) from each group. f Tumorsphere formation assay of E0771 ex vivo cells isolated from chow diet or HFD-fed mice. Representative images of day-5 tumorspheres formation of E0771 ex vivo cells and red arrowheads mark the identified tumorspheres. Quantification of day-5 tumorspheres is represented as mean ± SEM of four tumor samples from each group and three replicates were measured for each sample, P = 0.0002. g Fatty acid and glucose oxidation on E0771 ex vivo cells isolated from two chow diet-fed mice and three HFD-fed mice. The oxidation data are normalized to cell protein content. For each sample, 8 replicates are measured and data are represented as mean ± SEM of all replicates from each group. Fatty acid oxidation P = 0.0002, Glucose oxidation P = 0.0365. For c, d, unpaired, two-tailed Welch’s t-test was used for statistical testing. For f, g, statistical significance determined with unpaired, two-tailed Student’s t-test (*P value <0.05; ***P value <0.001). Source data are provided as a Source data file. Image collected and cropped by CiteAb from the following publication (https://pubmed.ncbi.nlm.nih.gov/35013251), licensed under a CC-BY license. Not internally tested by R&D Systems.
Detection of Human Axl by Immunohistochemistry
Expression of Axl and Gas6 in clinical samples. (A,B) Immunohistochemical analysis of Axl (A) or Gas6 (B) in non-small cell lung cancer tissues from patients who underwent surgery following preoperative chemotherapy or chemoradiotherapy. Insets show higher magnification of the areas indicated in the boxes. Scale bar, 50 μm. (A) Representative images showing tumor Axl-negative tumor tissues (left), and tumor Axl-positive tumor tissues (right). Tissues were stained with an anti-Axl antibody (brown) and counterstained with hematoxylin. (B) Representative images showing stromal Gas6-negative tumor tissues (left) and stromal Gas6-positive tumor tissues (right). Tissues were stained with an anti-Gas6 antibody (brown) and counterstained with hematoxylin. (C) Correlation between tumor Axl expression and stromal Gas6 expression in tumor tissues observed in (A and B). (D) Correlation between tumor Axl, stromal Gas6 expression and survival. Kaplan–Meier plot of disease-free survival in patients with non-small cell lung cancer who underwent surgery following preoperative chemotherapy or chemoradiotherapy, stratified according to tumor Axl and stromal Gas6 expression. Five-year disease-free survival in the patients with tumors expressing both tumor Axl and stromal Gas6 (n = 37) was significantly worse than in the both-negative group (n = 12) (21.9% vs 51.3%, p = 0.04). The five-year disease-free survival of tumor Axl-negative and stromal Gas6-positive group was 50.7%, and the difference in survival between this group and both-positive or both-negative group was not significant (p = 0.20 and 0.49, respectively); *p < 0.05. Image collected and cropped by CiteAb from the following publication (https://pubmed.ncbi.nlm.nih.gov/28878389), licensed under a CC-BY license. Not internally tested by R&D Systems.
Detection of Human Axl by Western Blot
rVSV∆G/EBOV entry kinetics: (A) VeroS cells were infected with rVSV∆G/EBOV at multiple MOIs, inoculum was removed after 1 h, and monitored for luciferase production over time. (B) VeroS, HEK293T, and HAP1 cells were infected with rVSV∆G/EBOV (MOI 1), inoculum was not removed, and monitored for luciferase production over time. Right panel zooms in to display the signals observed in HAP1 and HEK293T cells. (C) Immunoblots demonstrating production of the transfected receptors in HEK293T cells. (D) HEK293T cells transfected with the indicated receptors were infected with rVSV∆G/EBOV and monitored for luciferase production over time. Each experiment was repeated in duplicate, three independent times. Data shown are the averages of averages and corresponding SEM of three independent trials. Image collected and cropped by CiteAb from the following publication (https://pubmed.ncbi.nlm.nih.gov/33348746), licensed under a CC-BY license. Not internally tested by R&D Systems.
Detection of Rat Axl by Western Blot
Tyro3 increases Gas6-induced Axl phosphorylation.Rat2 (Rat lanes 1–3) and Rat2/T3V5 cells (Rat/T3, lanes 4–6) were treated with 0, 50, 350 ng/ml Gas6 for 20 min. Detergent cell lysates were prepared and normalized for protein concentration. The samples were divided in two for Tyro3 (panel A) and Axl (panel B) immunoprecipitations (IP). This was followed by SDS-PAGE using 8% gels followed and Western blot analysis. The membranes were probed with anti-phosphotyrosine ( alpha-pTyr) antibodies (PY20 and P99 mixture 1∶3,500) (top, panels A and B). The membranes were stripped and reprobed with alpha-Tyro3 serum 5424 (1∶3,500) (A, bottom panel) or affinity purified rabbit alpha-Axl (1∶3,500) (B, bottom panel). These blots are representative of 4 experiments. To determine whether Tyro3 expression affects Axl levels in Rat2 cells (panel C), detergent cell extracts were prepared from Rat2 cells (lane 1), and independently derived stably transfected Rat2/T3V5 cell lines (clone (cl) 25, lane 2; clone 11, lane 3; clone 30, lane 4). SDS-PAGE using 4–20% gels followed by Western blot analysis was performed on these extracts. The membranes were cut at the level of the 66 kDa marker and the top portion was probed with rabbit alpha-Tyro3 (5424 serum 1∶3,500) or rabbit alpha-Axl (1∶3,500). The bottom portion of the membranes were blotted with alpha-GAPDH (1∶500). These blots are representative of 5 experiments. To determine if the levels of Axl phosphorylation depended on the levels of Tyro3 expressed (panel D) Rat2 cells (lanes 1 and 2) and Rat2/T3V5 cell lines cl25 (lanes 3 and 4) and cl30 (lanes 5 and 6) were activated with media only (0) or 350 ng/ml of Gas6 for 10 min. Detergent cell lysates were prepared and normalized for protein concentration. The samples were divided in two for Tyro3 and Axl immunoprecipitations (IP). SDS-PAGE using 8% gels followed by Western blot analysis was performed. The membranes were probed with anti-phosphotyrosine ( alpha-pTyr) antibodies (PY20 and P99 mixture 1∶3,500) (top and third panels). An aliquot of the remaining Axl IPs were reloaded and probed with affinity purified rabbit alpha-Axl (1∶3,500) (second panel from the top). The membrane corresponding to Tyro3 IP’s was stripped and reprobed with alpha-Tyro3 serum 5424 (1∶3,500) (bottom panel). These blots are representative of 6 experiments. Image collected and cropped by CiteAb from the following publication (https://dx.plos.org/10.1371/journal.pone.0036800), licensed under a CC-BY license. Not internally tested by R&D Systems.
Detection of Human Axl by Western Blot
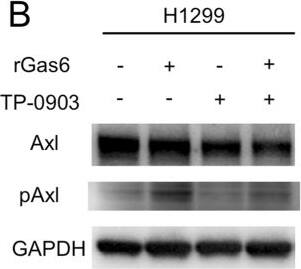
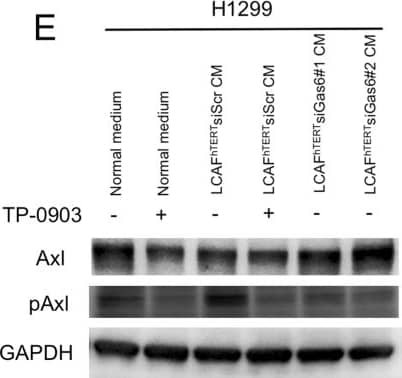
Migration of H1299 NSCLC cells enhanced by ligand-dependent Axl activation. (A) Western blotting to assess Gas6 expression in H1299 cells. Expression of Gas6 in LCAFhTERT cells was used as a positive control. (B) Phosphorylation of Axl was analyzed by Western blotting of whole cell lysates using different antibodies. GAPDH was used as an internal control. H1299 cells were stimulated for 15 min with 400 nM recombinant human Gas6 (rGas6). H1299 cells were treated with or without TP-0903 (0.2 µmol/L) for 24 h. (C) Migration of H1299 cells was analyzed using rGas6 (400 nM) added to the lower chamber. H1299 cells were treated with or without TP-0903 (0.2 µmol/L) for 24 h. (D) Western blotting of conditioned medium from LCAFhTERT transfected with siGas6 or siScr (control) to assess whether they contains Gas6 secreted by CAFs. (E) Phosphorylation of Axl in H1299 cells analyzed by Western blotting after stimulation with conditioned medium from siRNA-transfected LCAFhTERT. H1299 cells were treated with or without TP-0903 (0.2 µmol/L) for 24 h. The medium (DMEM containing 10% FBS) was used as control. (F) Migration of H1299 cells analyzed using conditioned medium of siRNA-transfected LCAFhTERT. H1299 cells were treated with or without TP-0903 (0.2 µmol/L) for 24 h. The medium (DMEM containing 10% FBS) was used as control. The relative number of migrated H1299 cells is indicated on the y-axis. Data show the mean ± SEM (n = 3); **p < 0.01. Image collected and cropped by CiteAb from the following publication (https://pubmed.ncbi.nlm.nih.gov/28878389), licensed under a CC-BY license. Not internally tested by R&D Systems.
Detection of Human Axl by Western Blot
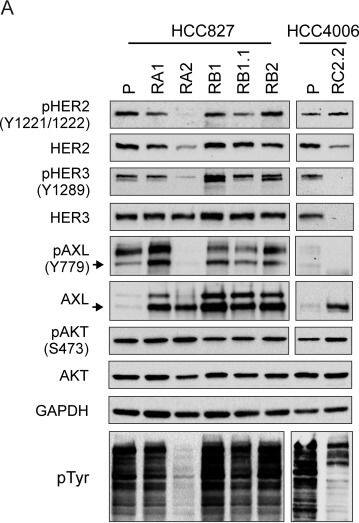
HER2/HER3 and AXL expression and phosphorylation analysis.A) Representative western blots of total cell lysates of HCC827 and HCC4006 parental cell lines (P) and their derived ERL-resistant cell lines. Arrows indicate the expected molecular weight size. Total cell lysates loaded were 40 μg for AXL and pAXL analyses and 25 μg for the others. B) qPCR analysis of AXL mRNA normalized to rp-L31 mRNA and expressed relative to the levels in parental cell lines set as 1 (mean ± SD of triplicate determinations). Western blots and qPCR data are representative of those obtained respectively from 3 and 2 independent analysis. C) Dose-effect curves were calculated using CompuSyn software and plotting the entered Fa values against the entered dose values. For combination treatments, the combined drugs dose was entered. Each data point represents the mean of 3 replicates. Image collected and cropped by CiteAb from the following publication (https://dx.plos.org/10.1371/journal.pone.0143333), licensed under a CC-BY license. Not internally tested by R&D Systems.
Detection of Human Axl by Immunohistochemistry
The expression of p-AXL&AXL positively correlates with the expression of KLF5 in human TNBC specimens. Moreover, DCC-2036 increases the sensitivity of TNBC chemotherapy by decreasing BCSCs.A Representative immunohistochemical staining images of p-AXL, AXL,&KLF5 protein in TNBC specimens, in which the expression of p-AXL, AXL,&KLF5 proteins was indicated by mild positive (+), moderate positive (++),&strong positive (+++), respectively. Left: Scale bars, 200 μm (magnification 40×); Right: Scale bars, 50 μm (magnification 100×). Image collected & cropped by CiteAb from the following open publication (https://pubmed.ncbi.nlm.nih.gov/36042208), licensed under a CC-BY license. Not internally tested by R&D Systems.
Detection of Human Axl by Immunohistochemistry
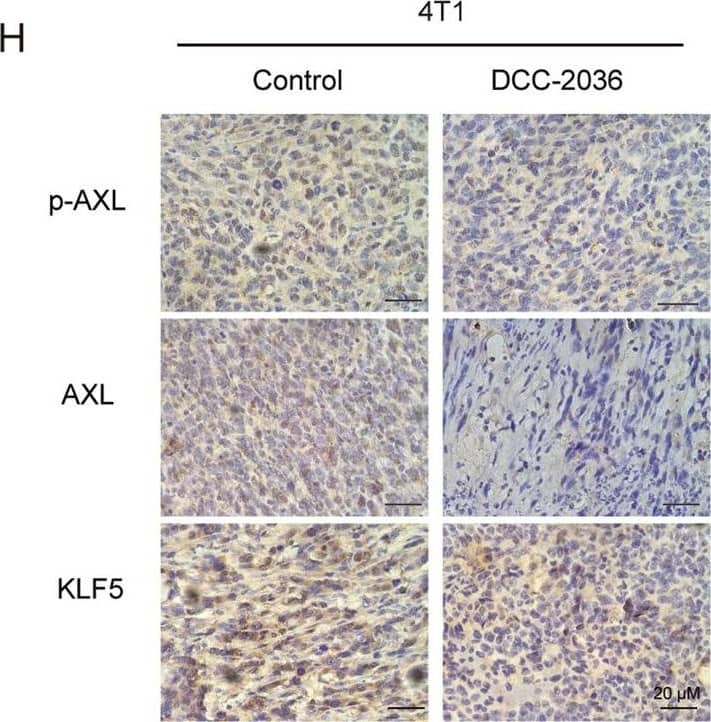
DCC-2036 inhibits CSCs in vivo according to the limited dilution assay by pretreating 4T1 cells with DCC-2036 or DMSO for 48 h.A In vivo tumorigenicity assay with limited dilution using DMSO or DCC-2036 treated 4T1 cells respectively: 200,000 (n = 7 and 8), 20,000 (n = 9 and 8), or 2000 (n = 10 and 10) cells per injection site. The frequency of BCSCs was calculated by ELDA. B Weight variation of mice following transplant of 4T1 cells into BALB/C mice after 7 days. C Images of tumor formation in BALB/C mice. D, E Transplanted tumors were harvested, and the tumor size and weight were measured at the end of the experiment. The statistical significance was determined by Student’s t-test. F Tumor-free survival curve of BALB/C mice is shown. G Hematoxylin and eosin (H&E) staining indicates the histology of tumor tissues. Scale bars, 20 μm. H Immunohistochemical analysis using p-AXL, AXL, and KLF5 antibodies in xenograft tissues from BALB/C mice. Scale bars, 20 μm. I Immunoblot of transplanted tumors from BALB/C mice posterior to the experiments. C means Control, T means DCC-2036. We chose the tumor tissues randomly for H&E staining, immunohistochemical analysis, and immunoblotting. Image collected and cropped by CiteAb from the following open publication (https://pubmed.ncbi.nlm.nih.gov/36042208), licensed under a CC-BY license. Not internally tested by R&D Systems.


