Western Blot Shows Human MMP‑1 Specificity by Using Knockout Cell Line.
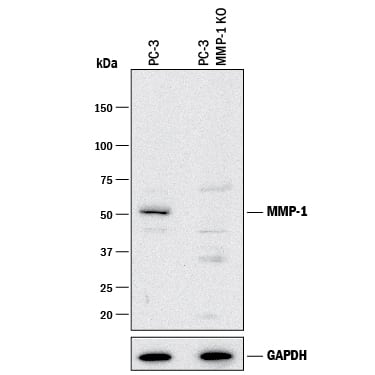
Western blot shows lysates of PC-3 human prostate cancer parental cell line and MMP-1 knockout PC-3 cell line (KO). PVDF membrane was probed with 2 µg/mL of Mouse Anti-Human MMP-1 Monoclonal Antibody (Catalog # MAB901) followed by HRP-conjugated Anti-Mouse IgG Secondary Antibody (Catalog #
HAF018). A specific band was detected for MMP-1 at approximately 50 kDa (as indicated) in the parental PC-3 cell line, but is not detectable in knockout PC-3 cell line. GAPDH (Catalog #
AF5718) is shown as a loading control. This experiment was conducted under reducing conditions and using Immunoblot Buffer Group 1.
Detection of Human MMP-1 by Western Blot
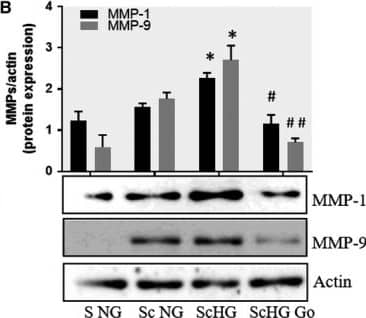
Inhibition of PKC alpha decreases the protein expression of MMP‐1 and MMP‐9 induced by cell cross‐talk in SMC. A, Evaluation of PKC alpha activation in control SMC (S NG) vs SMC previously co‐cultured with MAC in HG (Sc HG). Note that, the phosphorylated form of PKC alpha is significantly increased in SMC that were before exposed to MAC in HG conditions. Silencing of CCR2 or p65 decreases the phosphorylation of PKC alpha to control levels. B, Effect of PKC alpha inhibitor – Go 6976 on the MMP‐1 and MMP‐9 protein expression induced by SMC‐MAC cross‐talk. S NG – control SMC, Sc NG – SMC which were co‐cultured with MAC in normal glucose, Sc HG ‐ SMC which were co‐cultured with MAC in high glucose, Sc HGGo ‐ SMC which were co‐cultured with MAC in high glucose in presence of 1 μmol/L Go 6976. n = 3, *P < .05, **P < .01, #P < .05, ##P < .01 Image collected and cropped by CiteAb from the following publication (https://pubmed.ncbi.nlm.nih.gov/29992758), licensed under a CC-BY license. Not internally tested by R&D Systems.
Detection of Human MMP-1 by Western Blot
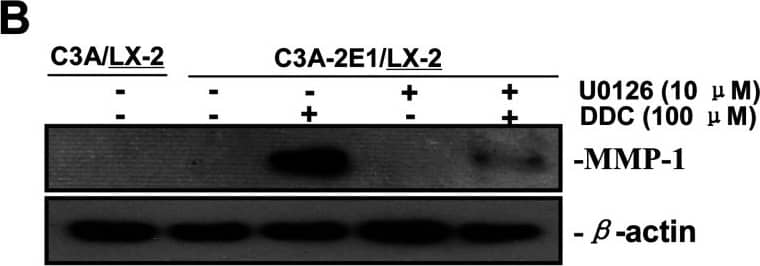
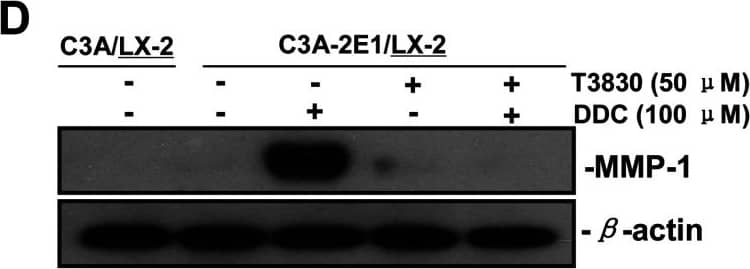
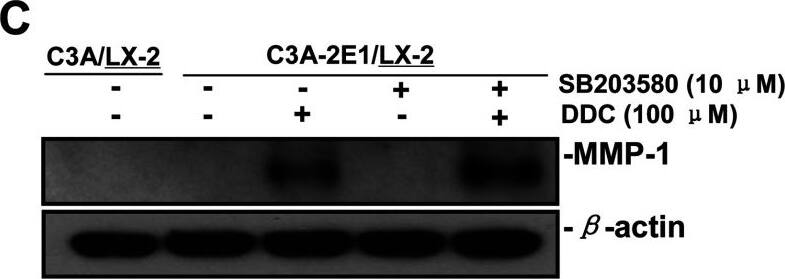
DDC up-regulates MMP-1 through ERK1/2 and Akt activation(A) Co-cultures were treated with 100 μM DDC for the indicated time. Phosphorylation of ERK1/2, p38 and Akt were determined by Western blotting analysis. The corresponding non-phosphorylated ERK1/2, p38, Akt and beta-actin were used for protein loading control. (B) Co-cultures were treated with or without 100 μM DDC for 24 h in the presence or absence of ERK1/2 inhibitor (U0126, 10 μM). MMP-1 protein levels were analysed by Western blotting. (C) Co-cultures were treated with or without 100 μM DDC for 24 h in the presence or absence of p38 inhibitor (SB203580, 10 μM). MMP-1 protein levels were analysed by Western blotting. (D) Co-cultures were treated with or without 100 μM DDC for 24 h in the presence or absence of Akt inhibitor (T3830, 50 μM). MMP-1 protein levels were analysed by Western blotting. Image collected and cropped by CiteAb from the following publication (https://pubmed.ncbi.nlm.nih.gov/23577625), licensed under a CC-BY license. Not internally tested by R&D Systems.
Detection of Human MMP-1 by Western Blot
DDC up-regulates MMP-1 expression in a dose-dependent manner and lowered collagen I in LX-2 cellsCo-culture systems were treated with 25, 50, 100 and 200 μM DDC for 24 h. LX-2 cells and the culture medium were collected and analysed. (A) Quantitative RT-PCR results of MMP-1 expression in LX-2 cells. The results were normalized with beta-actin and expressed as fold increase relative to the control in each experiment. (B) 20 μg aliquots of total protein extracts from LX-2 cells were subjected to Western blotting analysis with anti-MMP-1 antibody (MAB 901 and MAB 3223 for active form only) and beta-actin antibody as a loading control, as described in the Materials and Methods section. (C) 30 μg of LX-2 lysates or 20 μl aliquots of 10-fold concentrated culture medium with 5×loading buffer were assayed by Casein Zymography for MMP-1 activity. (D) Levels of collagen I in LX-2 cells were assayed by western blotting. (E) Levels of collagen I in the culture medium were assayed by ELISA. *P<0.05 compared with untreated C3A-2E1/LX-2. Image collected and cropped by CiteAb from the following publication (https://pubmed.ncbi.nlm.nih.gov/23577625), licensed under a CC-BY license. Not internally tested by R&D Systems.
Detection of Human MMP-1 by Western Blot
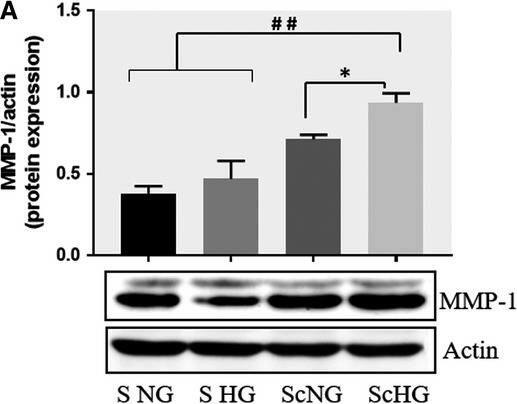
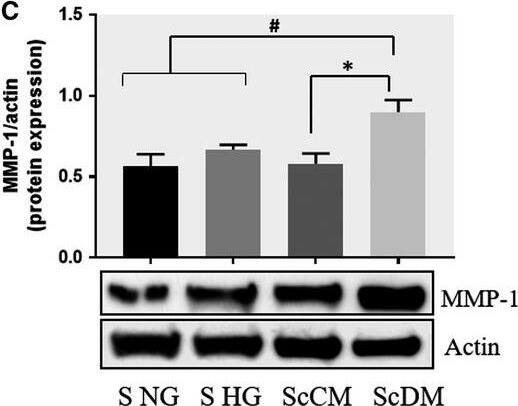
Co‐culture of SMC and MAC in high glucose conditions (24 h) induces a significant increase in the protein expression of MMP‐1 and MMP‐9. A, B: Protein expression of MMP‐1 (A) and MMP‐9 (B) was assessed in SMC after co‐culture with THP‐derived macrophages and evaluated by Western blot assay. C, D: Protein expression of MMP‐1 (C) and MMP‐9 (D) in SMC after co‐culture with human macrophages derived from freshly isolated monocytes from control subjects (CM) or diabetic patients with ACS (DM). S NG –control SMC, S HG – SMC exposed to HG, Sc NG or Sc CM – SMC which were co‐cultured with MAC in normal glucose, Sc HG or Sc DM ‐ SMC which were co‐cultured with MAC in high glucose. n = 3, *P < .05, **P < .01, ***P < .001, #P < .05, ##P < .01, ###P < .001 Image collected and cropped by CiteAb from the following publication (https://pubmed.ncbi.nlm.nih.gov/29992758), licensed under a CC-BY license. Not internally tested by R&D Systems.
Detection of Human MMP-1 by Western Blot
DDC up-regulates MMP-1 through ERK1/2 and Akt activation(A) Co-cultures were treated with 100 μM DDC for the indicated time. Phosphorylation of ERK1/2, p38 and Akt were determined by Western blotting analysis. The corresponding non-phosphorylated ERK1/2, p38, Akt and beta-actin were used for protein loading control. (B) Co-cultures were treated with or without 100 μM DDC for 24 h in the presence or absence of ERK1/2 inhibitor (U0126, 10 μM). MMP-1 protein levels were analysed by Western blotting. (C) Co-cultures were treated with or without 100 μM DDC for 24 h in the presence or absence of p38 inhibitor (SB203580, 10 μM). MMP-1 protein levels were analysed by Western blotting. (D) Co-cultures were treated with or without 100 μM DDC for 24 h in the presence or absence of Akt inhibitor (T3830, 50 μM). MMP-1 protein levels were analysed by Western blotting. Image collected and cropped by CiteAb from the following publication (https://pubmed.ncbi.nlm.nih.gov/23577625), licensed under a CC-BY license. Not internally tested by R&D Systems.
Detection of Human MMP-1 by Western Blot
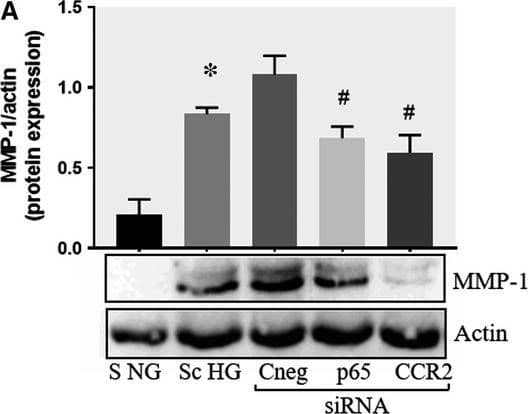
Effect of CCR2 and p65 silencing in the regulation of MMP‐1 and MMP‐9 expression in SMC. Protein expression of MMP‐1 (A) and MMP‐9 (B) determined by Western blot in control SMC (S NG), SMC which were co‐cultured with MAC in HG conditions (Sc HG), and SMC subjected to silencing of CCR‐2 and p65 and co‐cultured with MAC in HG conditions (Cneg, p65, CCR2 siRNA). Note that silencing of CCR2 or p65 decreases significantly the protein expression of MMP‐1 and MMP‐9 induced by SMC‐MAC co‐culture in high glucose conditions. n = 3, *P < .05, #P < .05 Image collected and cropped by CiteAb from the following publication (https://pubmed.ncbi.nlm.nih.gov/29992758), licensed under a CC-BY license. Not internally tested by R&D Systems.
Detection of Human MMP-1 by Western Blot
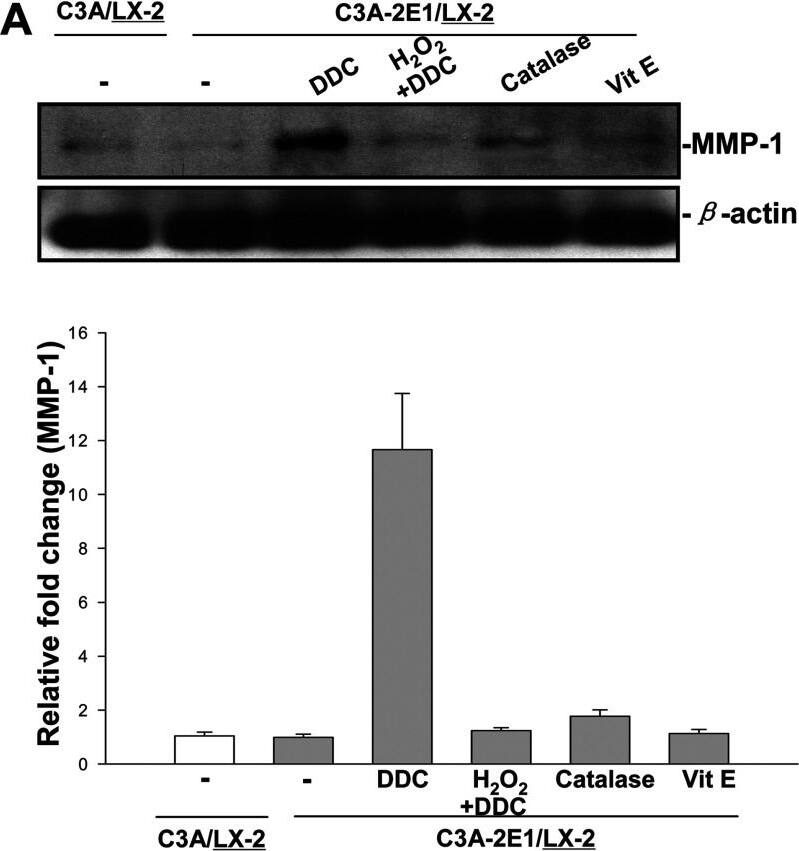
DDC up-regulates MMP-1 expression in an H2O2-associated mannerCo-cultures were treated with 100 μM DDC, 2000 Units catalase, 25 μM vitamin E and 5μM H2O2 combined with 100 μM DDC for 24 h. Cell lysates from the LX-2 cells were collected and analysed. (A) 20 μg aliquots of total protein extracts from LX-2 cells were subjected to Western blotting analysis with anti-MMP-1 antibody (MAB 901) and beta-actin antibody as a loading control, as described in the Materials and Methods section. (B) Levels of collagen I in LX-2 cells were assayed by Western blotting. Image collected and cropped by CiteAb from the following publication (https://pubmed.ncbi.nlm.nih.gov/23577625), licensed under a CC-BY license. Not internally tested by R&D Systems.
Detection of Human MMP-1 by Western Blot
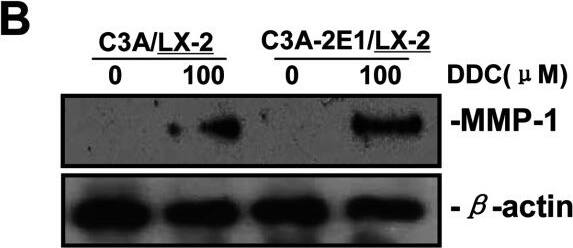
DDC up-regulates MMP-1 expression in LX-2 cellsCo-culture systems were treated with 100 μM DDC for 24 h. LX-2 cells and the culture medium were collected and analysed. (A) Quantitative RT-PCR results of MMP-1 expression in LX-2 cells. The results were normalized with beta-actin and expressed as fold increase relative to the control in each experiment. (B) 20 μg aliquots of total protein extracts from LX-2 cells were subjected to western blotting analysis with anti-MMP-1 antibody (MAB 901) and beta-actin antibody as a loading control, as described in the Materials and Methods section. Image collected and cropped by CiteAb from the following publication (https://pubmed.ncbi.nlm.nih.gov/23577625), licensed under a CC-BY license. Not internally tested by R&D Systems.
Detection of MMP-1 by Western Blot
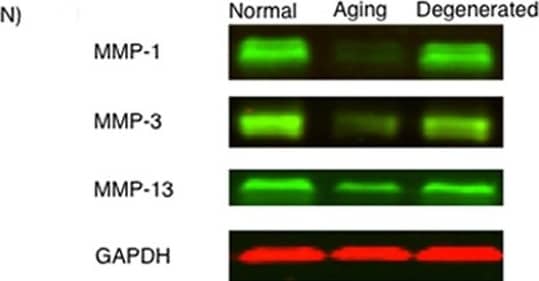
MMP-1, MMP-3, and MMP-13 expression. (A-D) MMP-1; (E-H) MMP-3; (I-L) MMP-13 (A,E,I) ACL from young normal knee; (B,F,J) ACL from aging knee; (C,G,K) fibroblast-like cell aggregates in the degenerated ACL; (D,H,L) chondrocyte-like cell aggregates in the degenerated ACL. (Original magnification ×40). The graph (M) represents the percentage (mean ± SEM) of MMP-1-, MMP-3-, and MMP-13-positive cells in each group. **P < 0.01. (N) Western blotting for MMP-1, MMP-3, and MMP-13 (n = 3 for each category). Image collected and cropped by CiteAb from the following open publication (https://arthritis-research.biomedcentral.com/articles/10.1186/ar4165), licensed under a CC-BY license. Not internally tested by R&D Systems.


